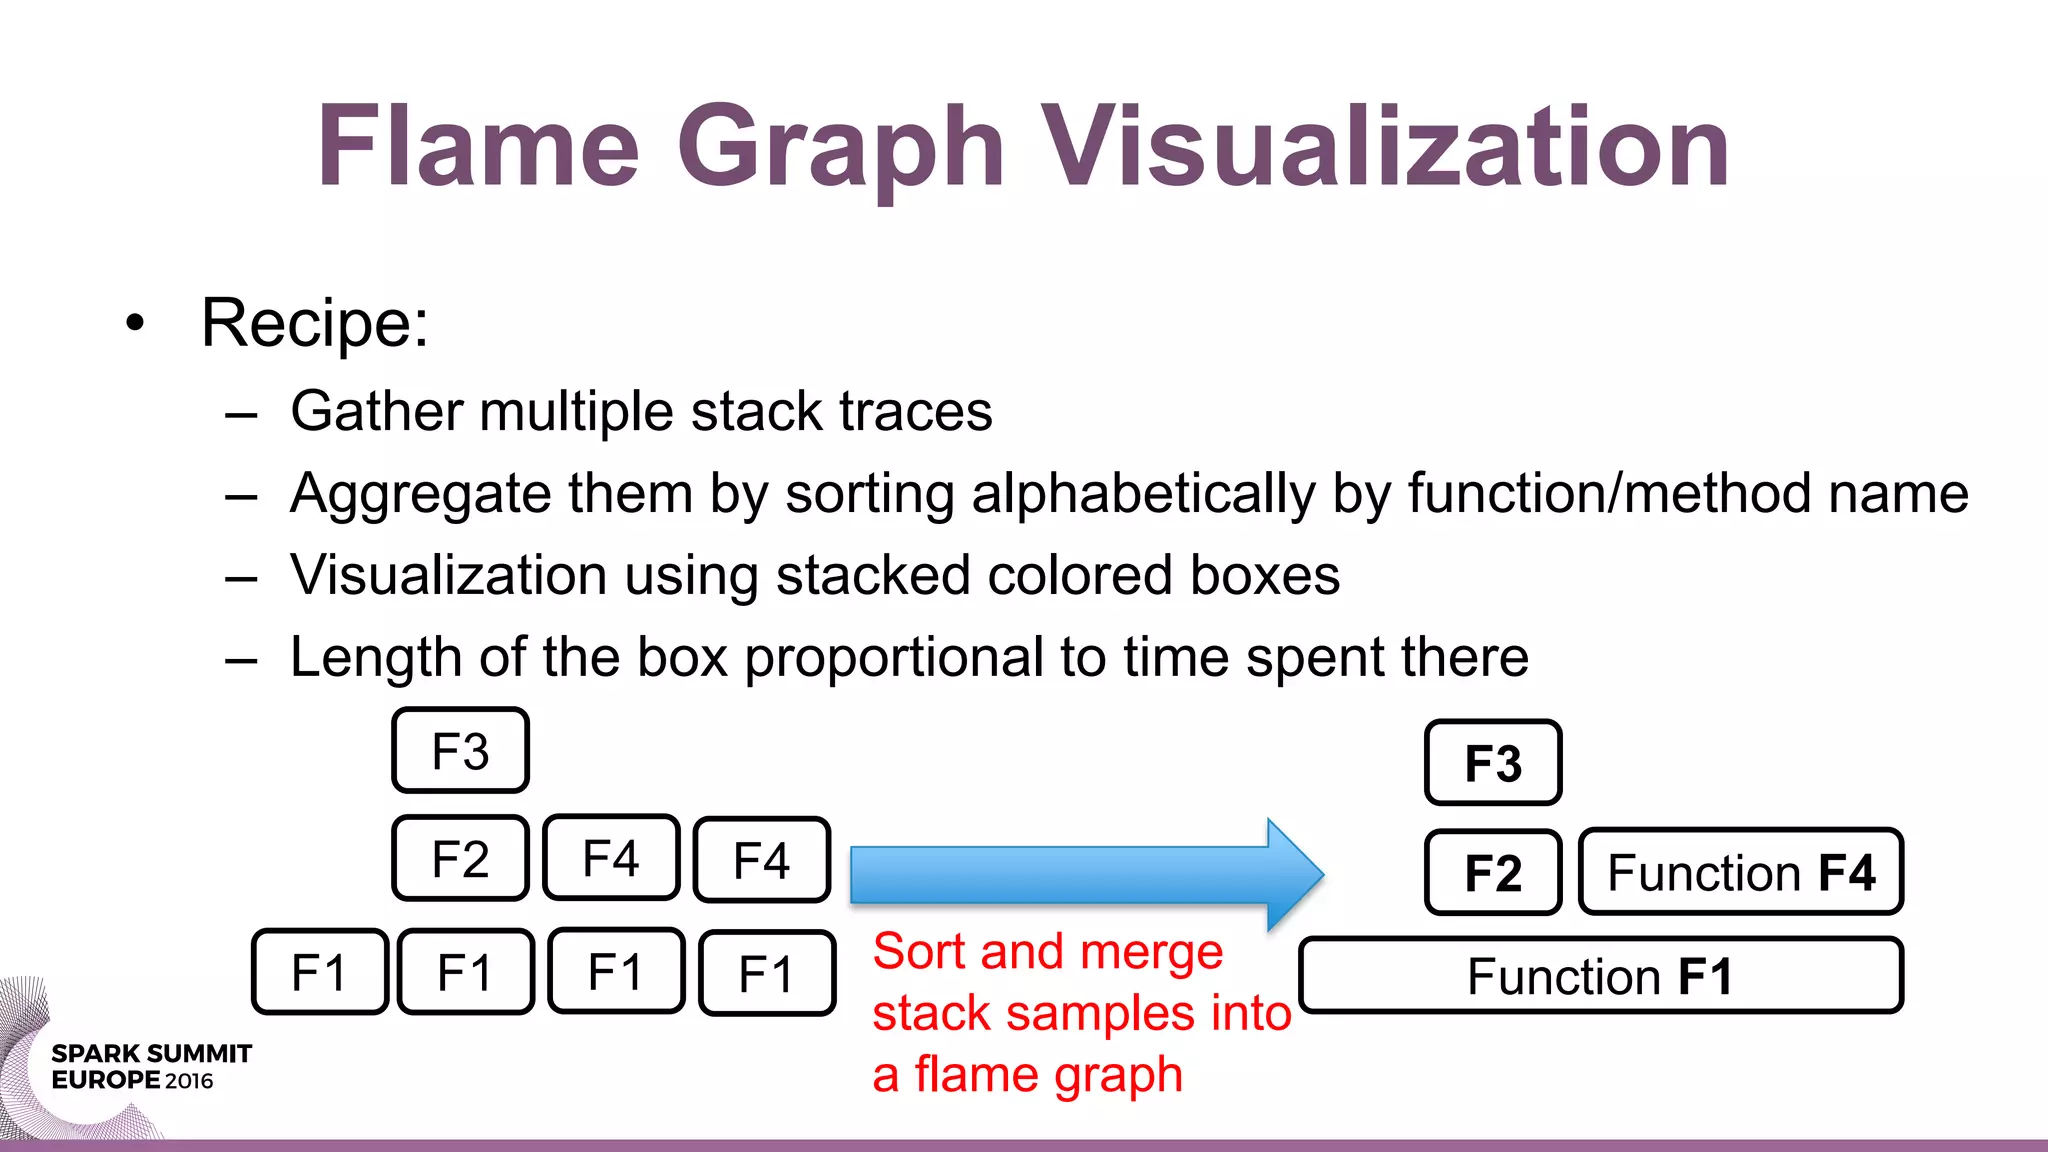
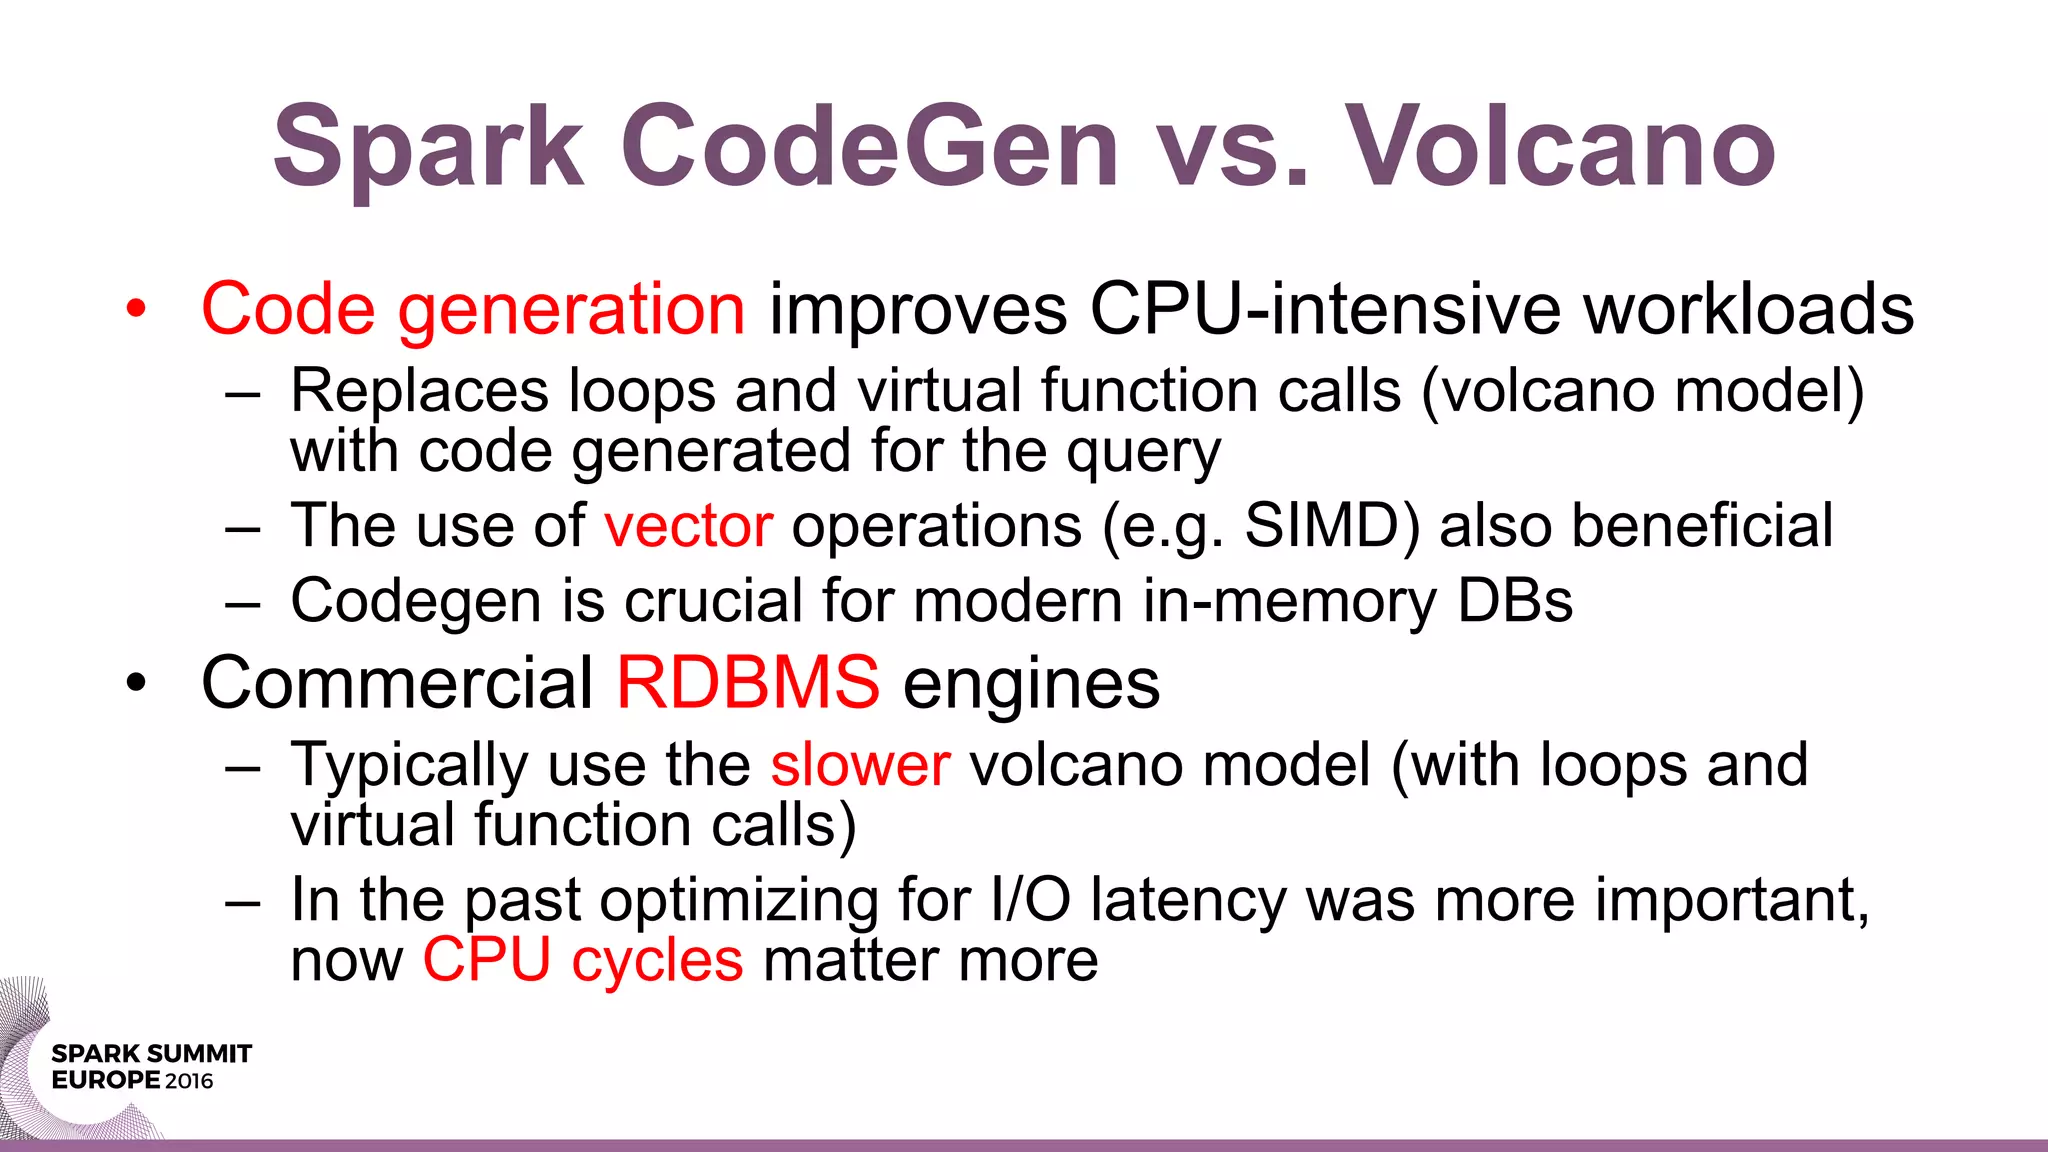
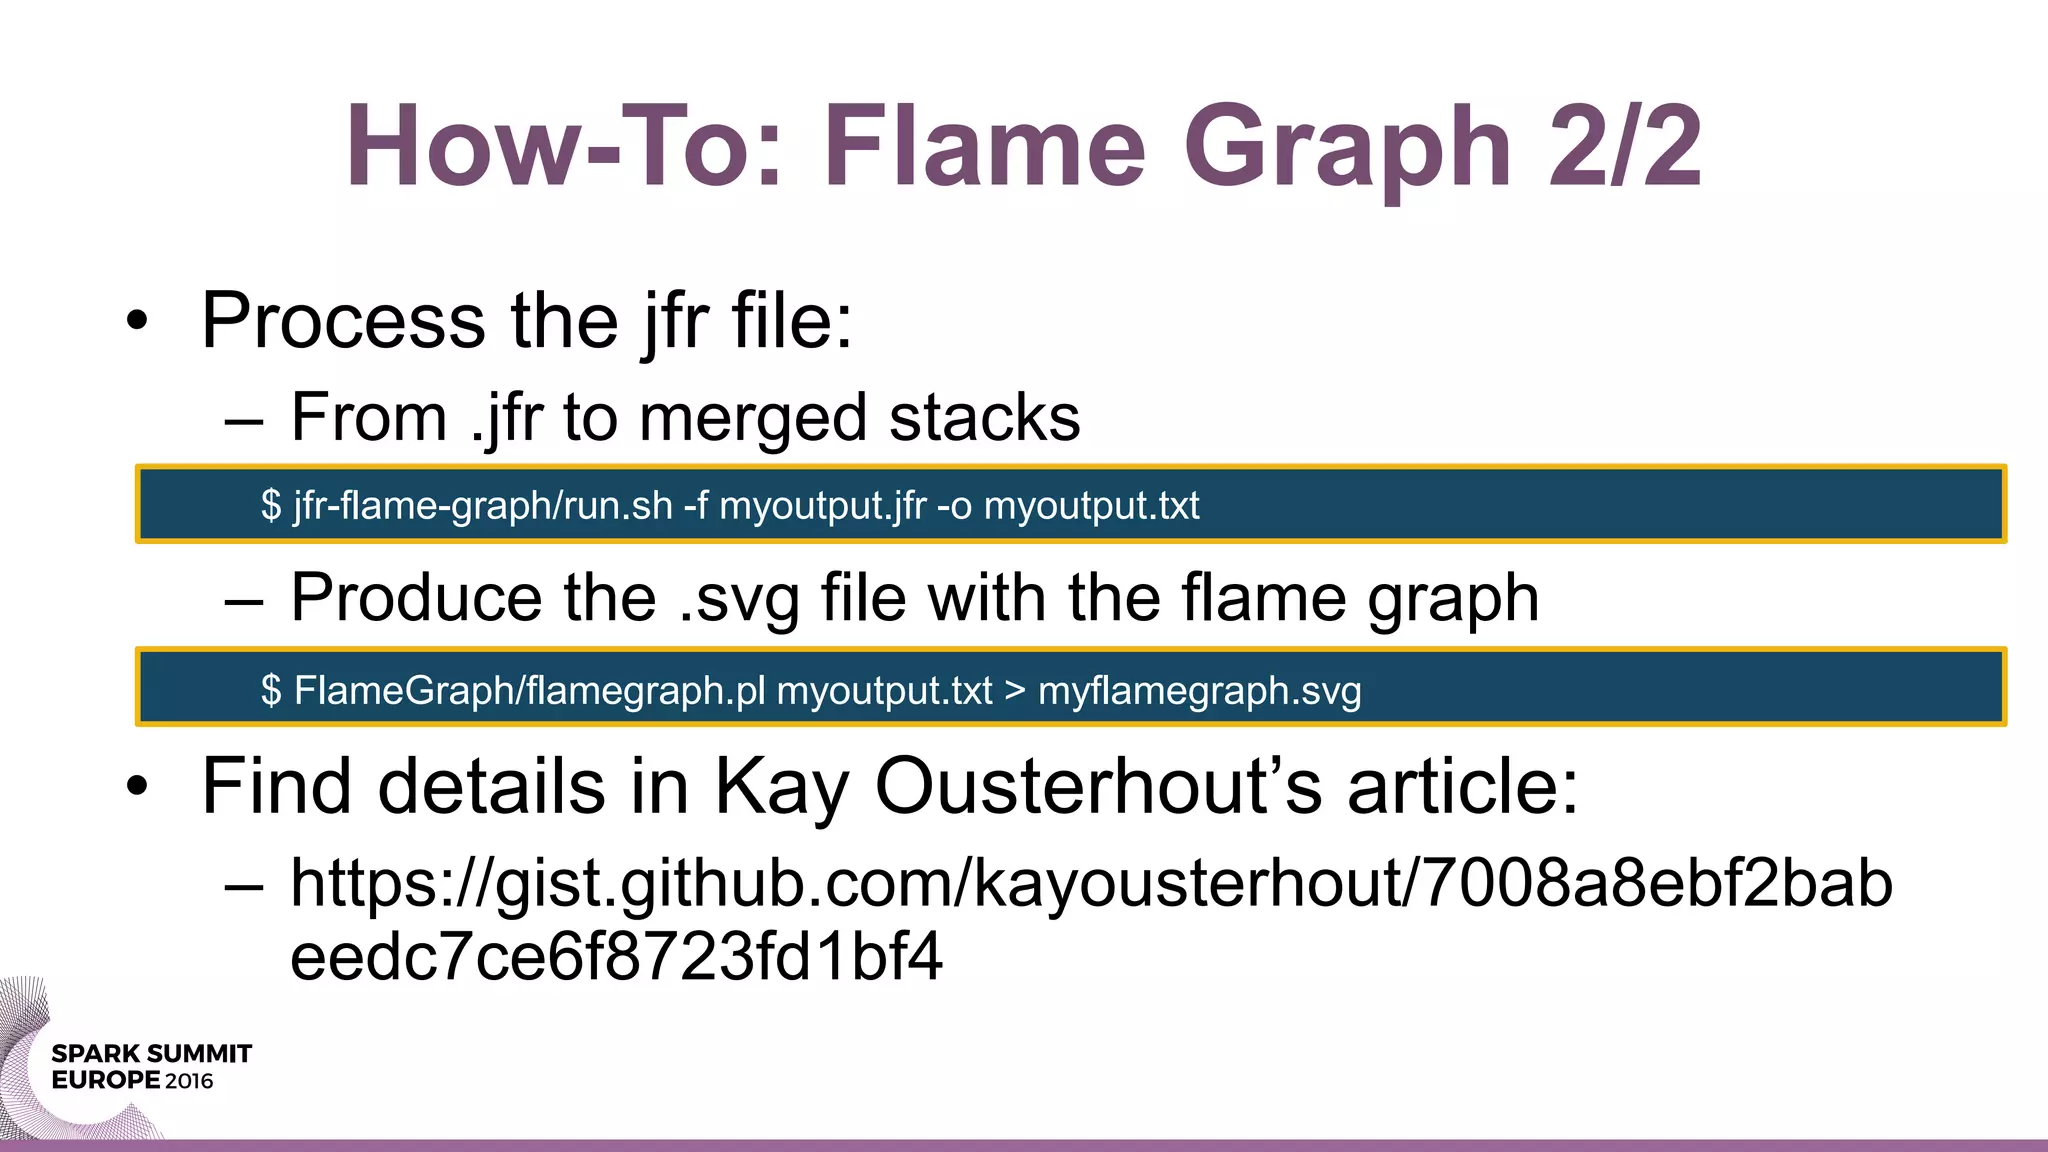
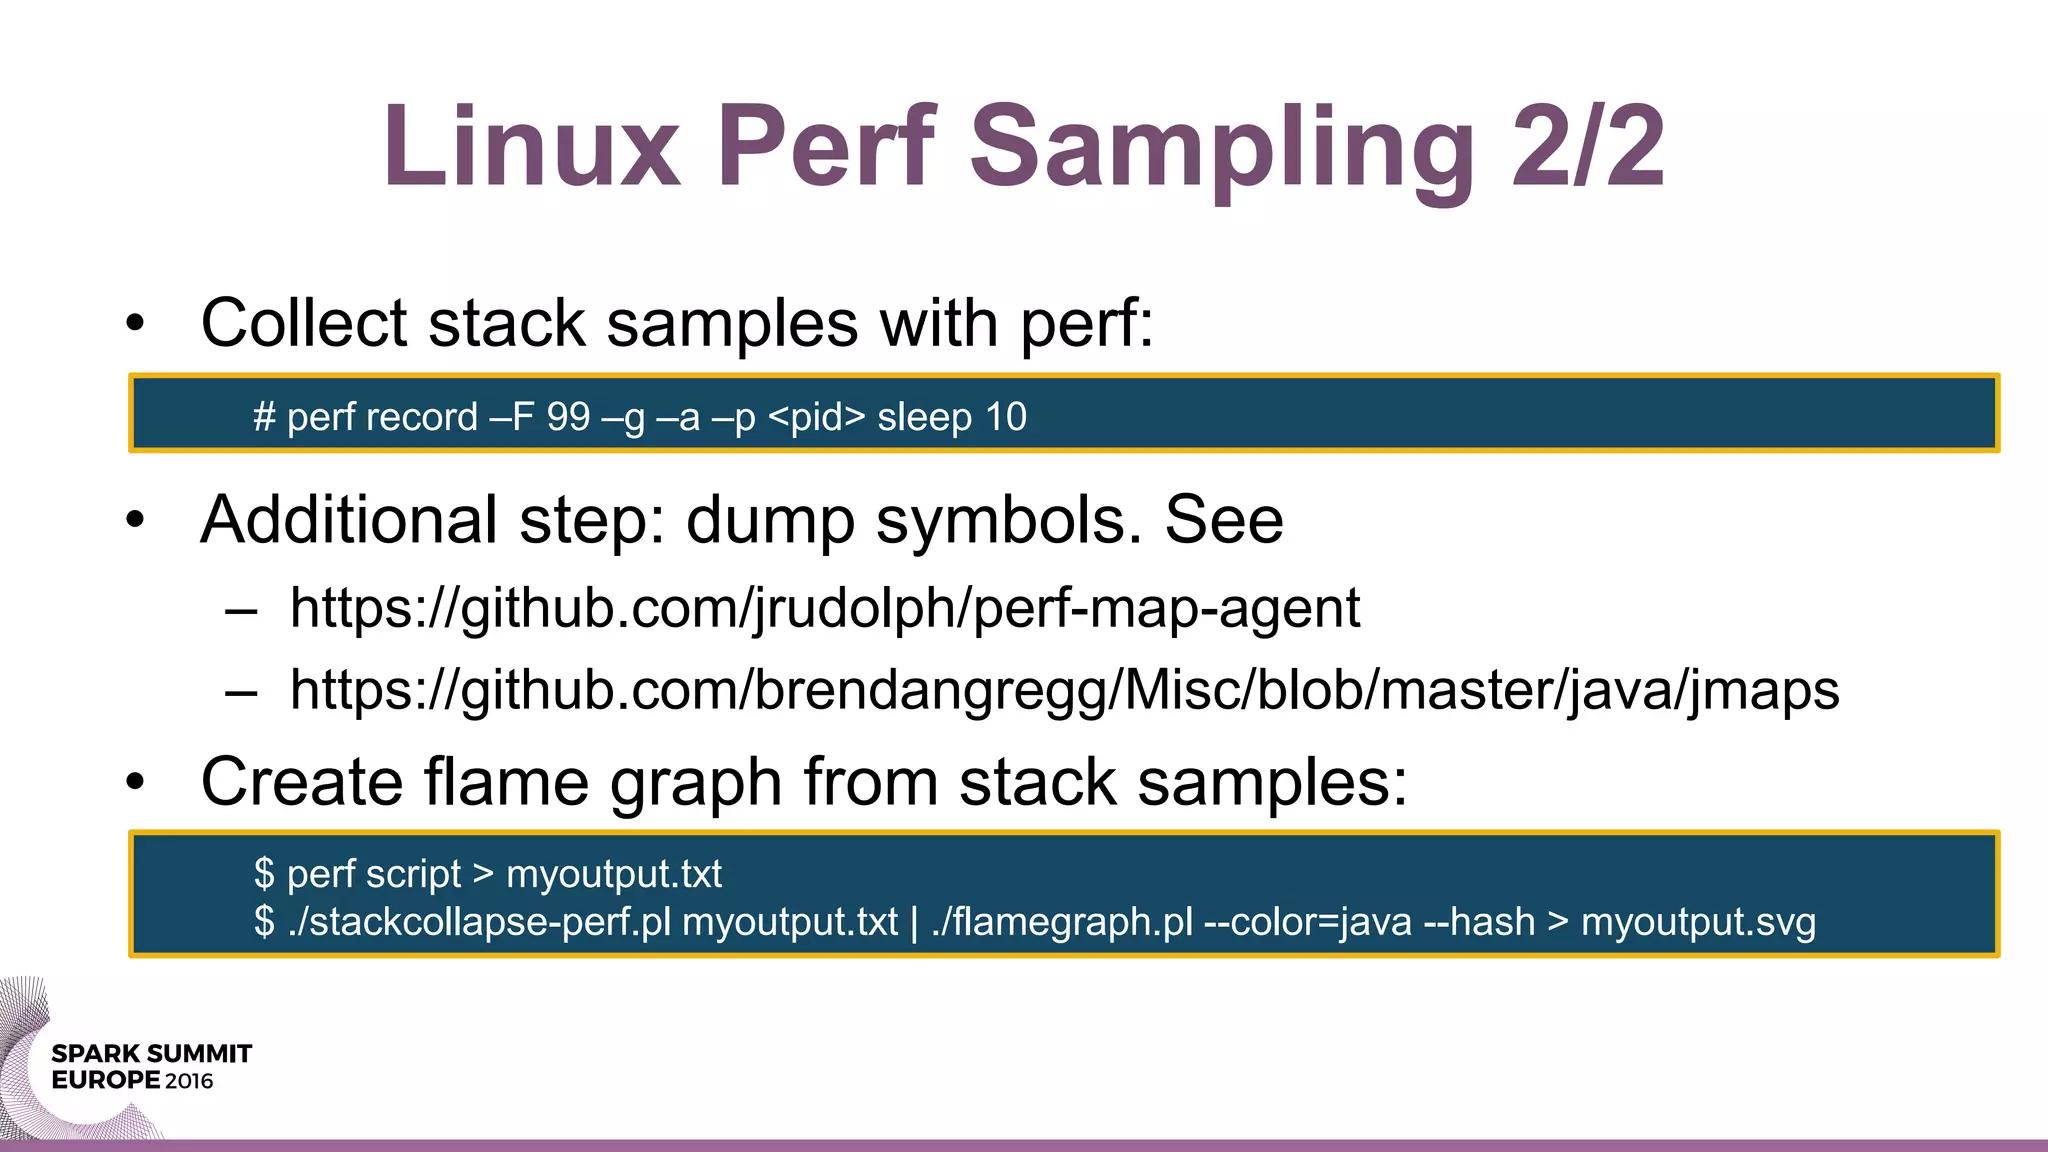
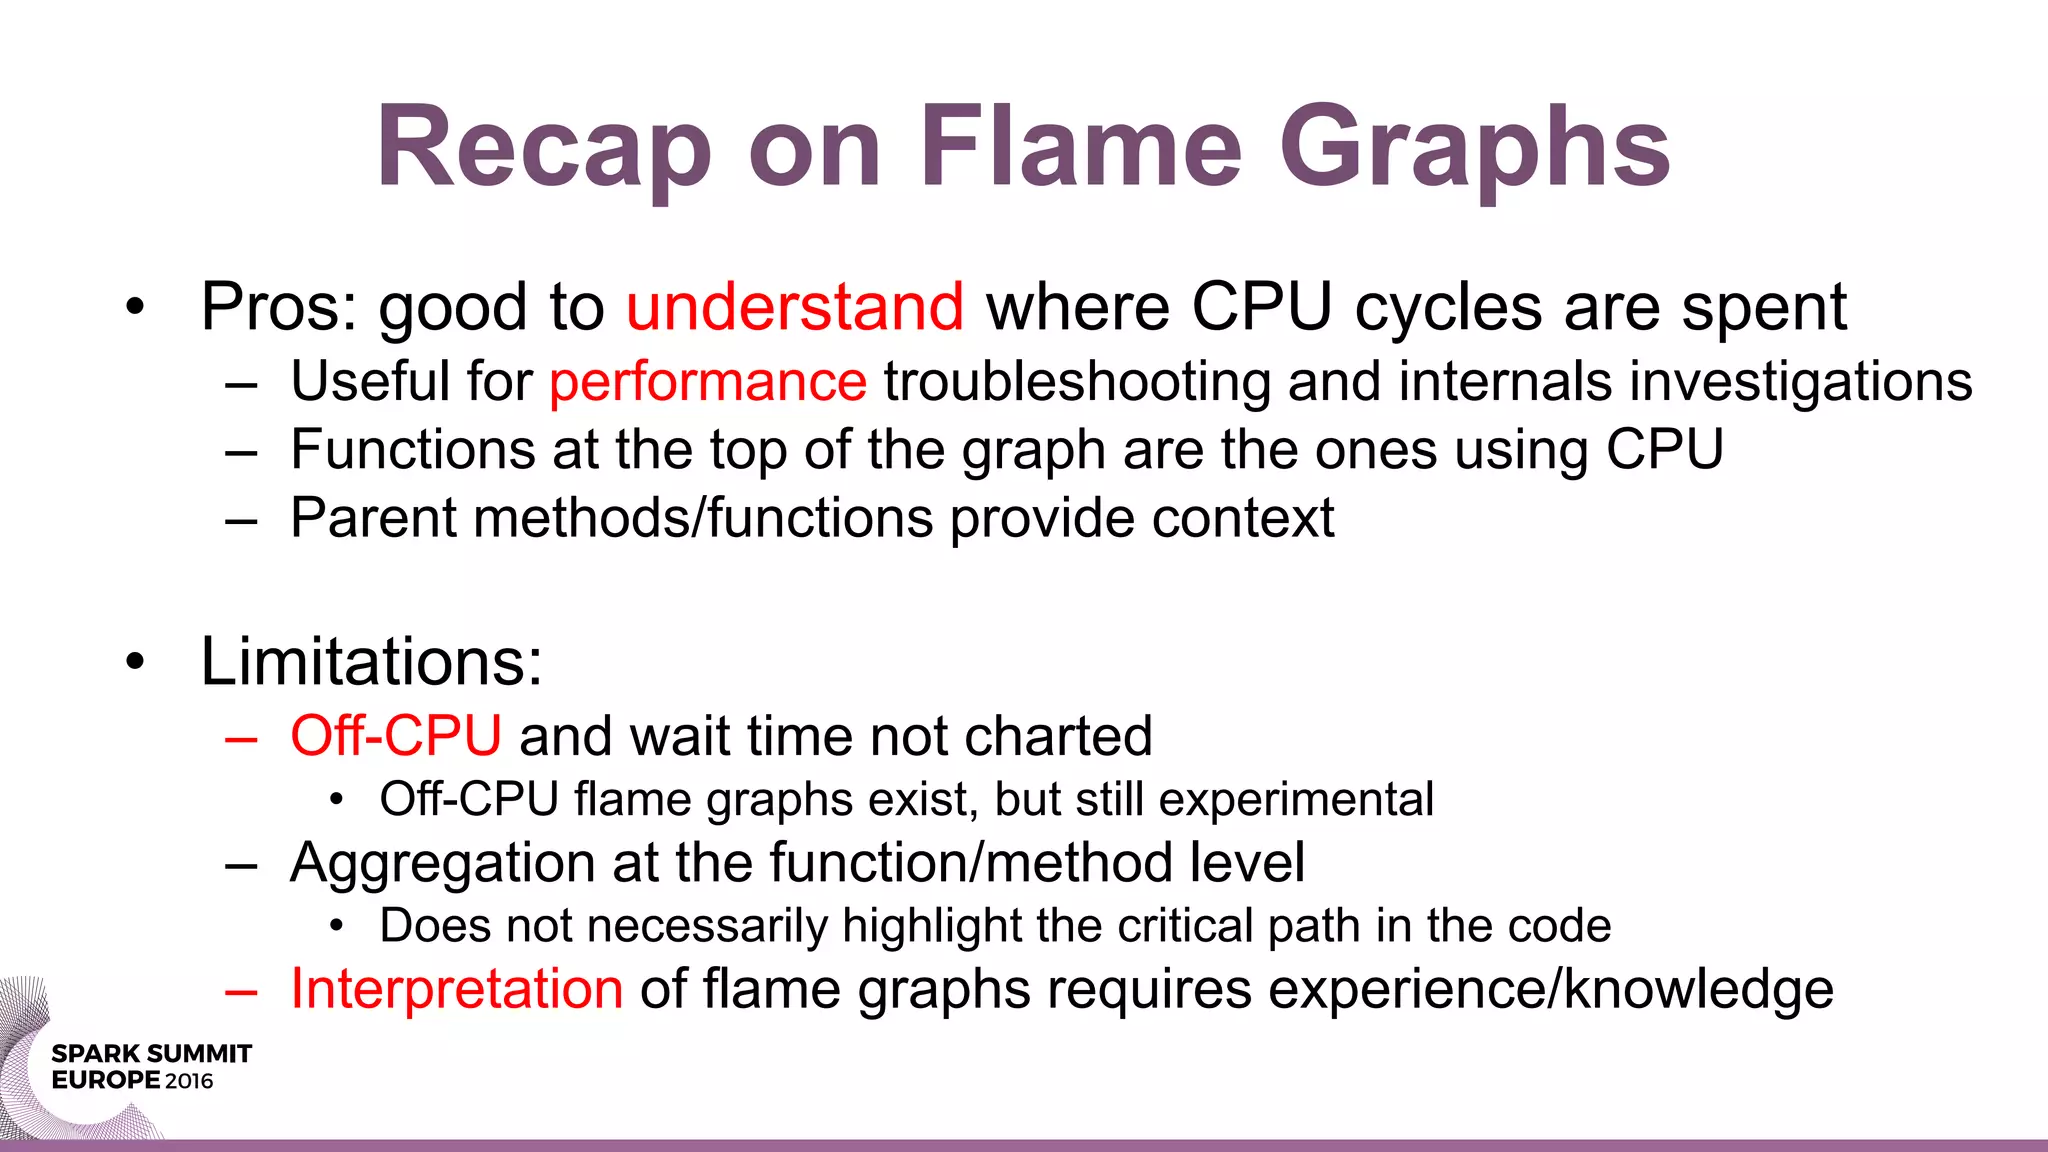
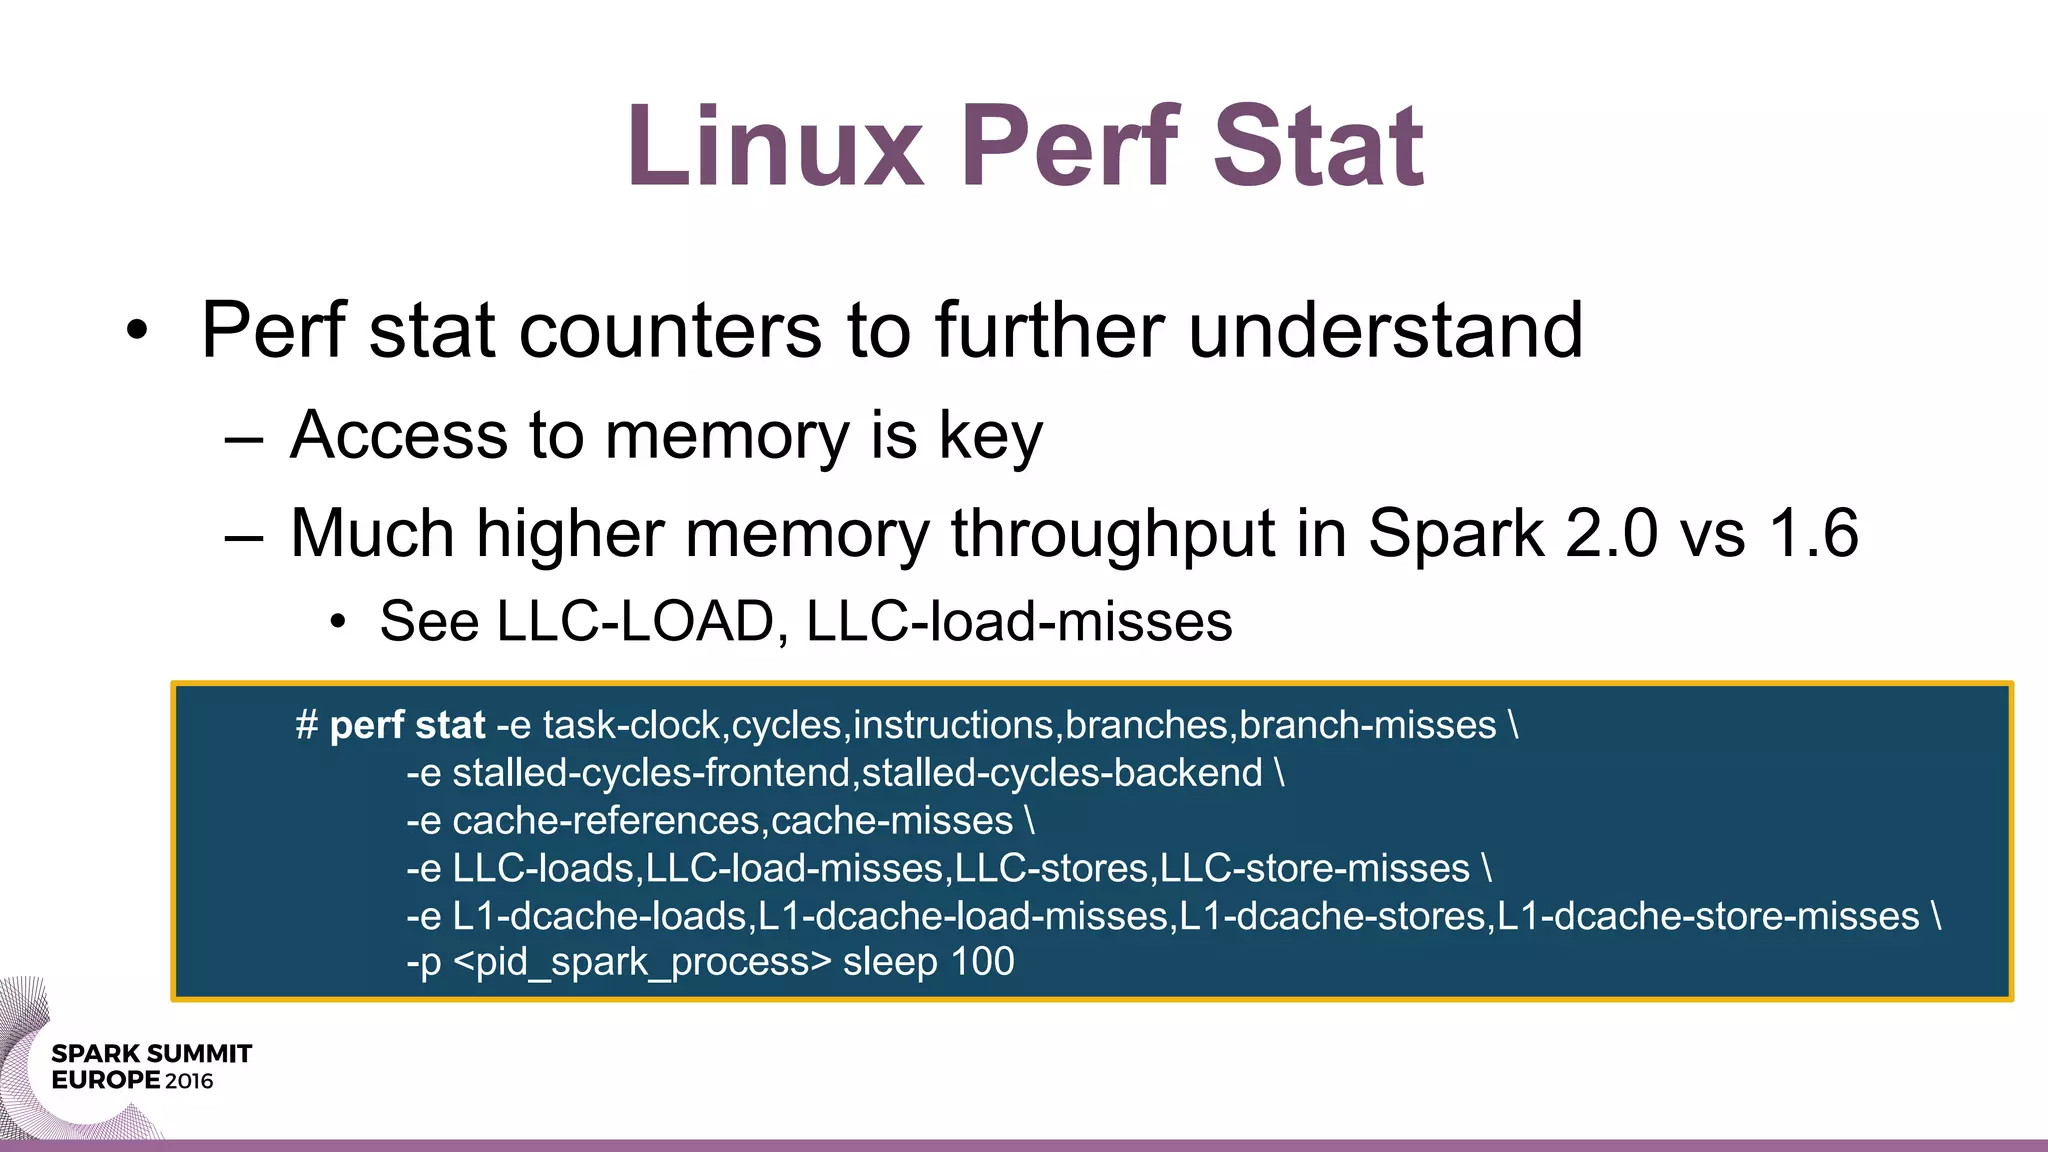
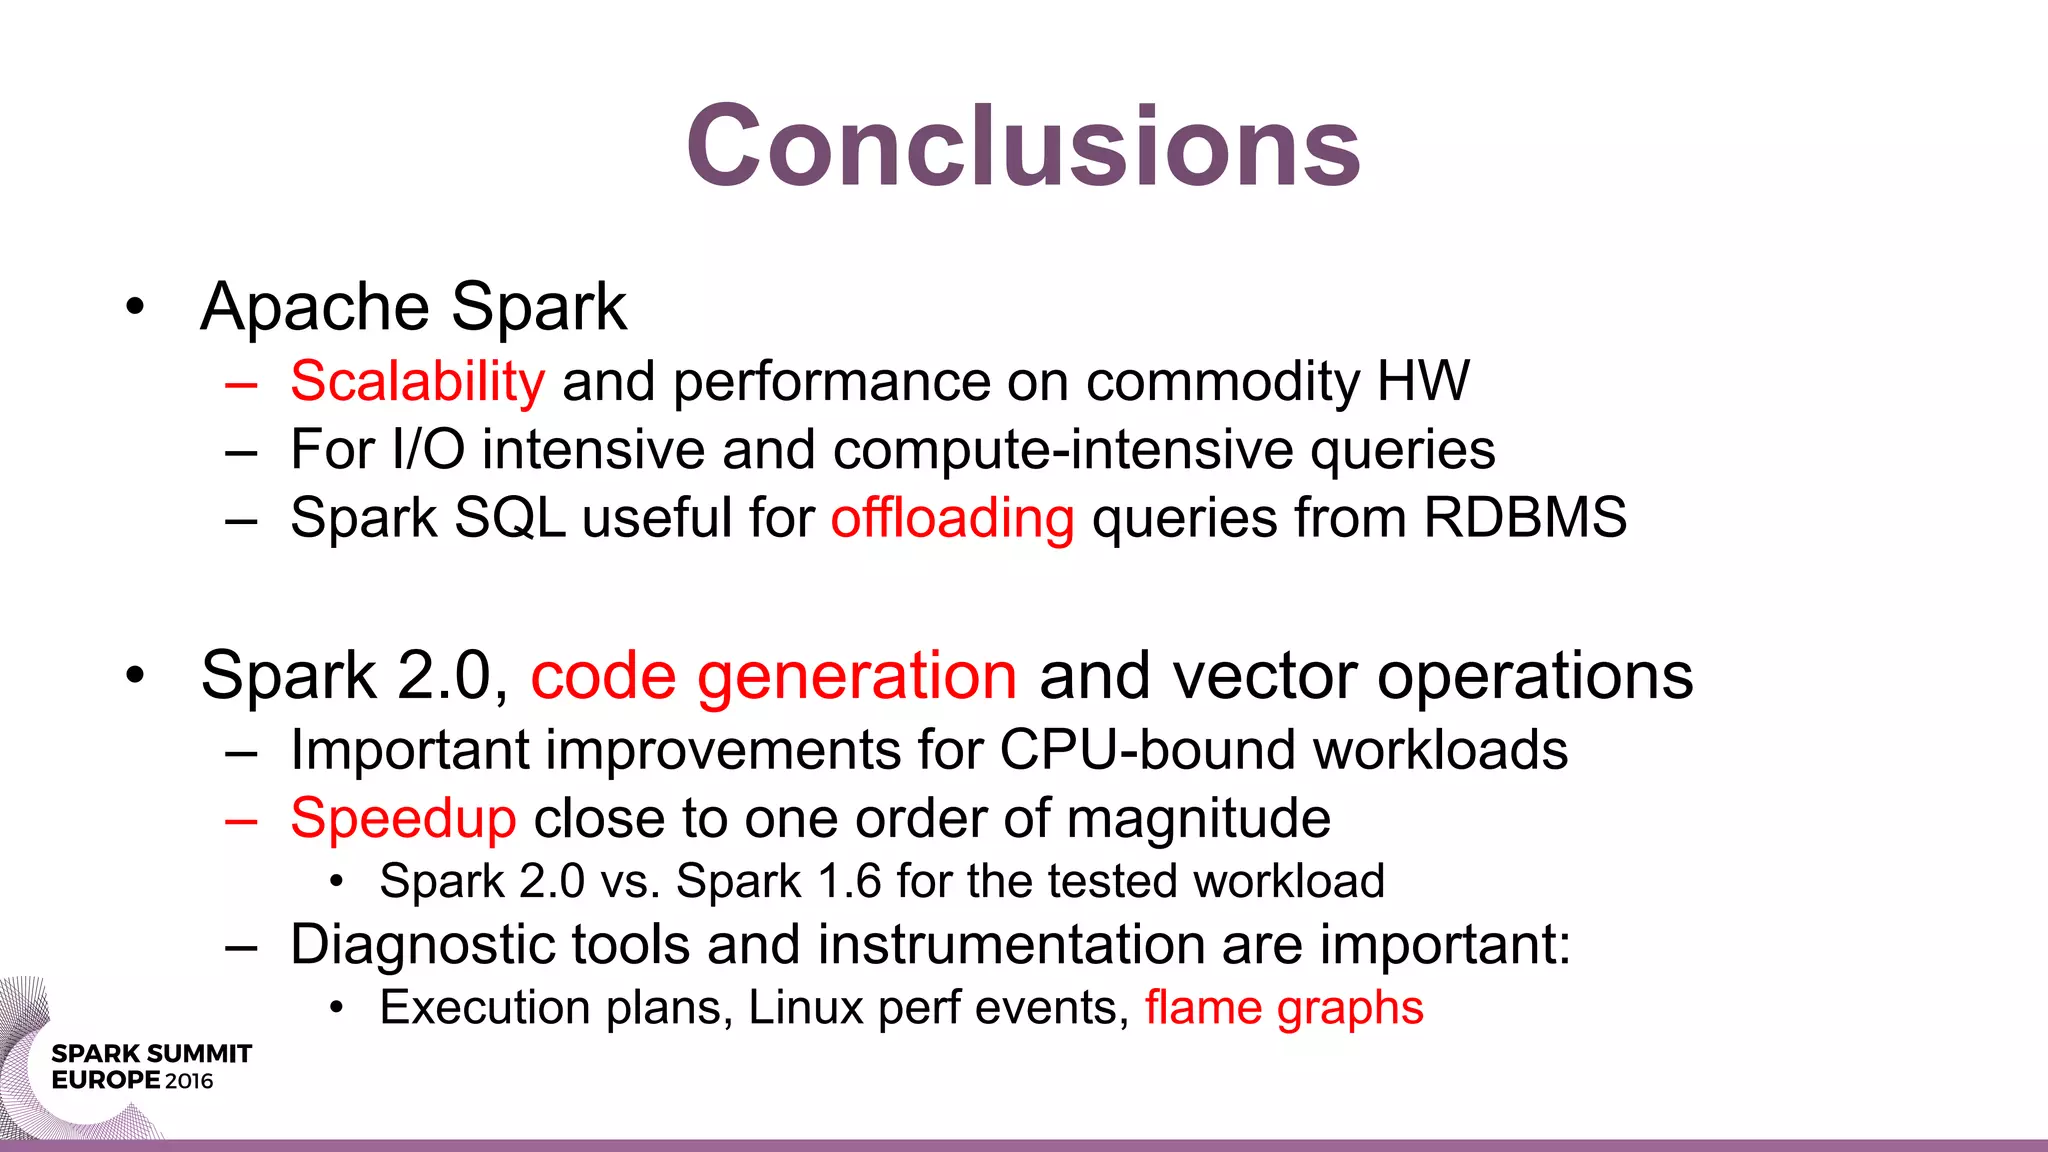
Apache Spark 2.0 Performance
Improvements Investigated With
Flame Graphs
Luca Canali
CERN, Geneva (CH)
Speaker Intro
• Database engineer and team lead at CERN IT
– Hadoop and Spark service
– Database services
• Joined CERN in 2005
• 16 years of experience with database services
– Performance, instrumentation, tools, Linux
• @LucaCanaliDB – http://cern.ch/canali
CERN
• CERN - European Laboratory for
Particle Physics
• Founded in 1954 by 12 countries for
fundamental research in physics
• Today 22 member states + world-wide
collaborations
• About ~1000 MCHF yearly budget
• 2’300 CERN personnel, 10’000 users
from 110 countries
Large Hadron Collider
• Largest and most powerful particle accelerator
LHC Physics and Data
• LHC physics is data- and compute- intensive
– Oct 2016: ~160 PB archive on tape at CERN
• Current rate of data acquisition: ~ 50 PB/year
– Distributed computing effort (WLCG)
• Computing: utilize ~ 300K cores
– Technology
• Custom data formats, applications and frameworks: ROOT
Apache Spark @ CERN
• Spark is a key component of the CERN Hadoop
Service
– Three production Hadoop/YARN clusters
• Aggregated capacity: ~1000 cores, 3 TB RAM, 1.2 PB used space
on HDFS
– Projects involving Spark:
• Analytics for accelerator controls and logging
• Monitoring use cases, this includes use of Spark streaming
• Analytics on aggregated logs
• Explorations on the use of Spark for physics analysis
A Case from Production
• Slow query in a relational database
– Ad-hoc report for network experts
– Query runs in >12 hours, CPU-bound, single-
threaded
• Run using Spark on a Hadoop cluster
– Data exported with Apache Sqoop to HDFS
– The now query runs in ~20 minutes, unchanged
– Throw hardware to solve the problem -> cost effective
Spark 1.6 vs. Spark 2.0
• Additional tests using Spark 2.0
– The query execution time goes down further
• One order of magnitude: from 20 min to 2 min
– How to explain this?
• Optimizations in Spark 2.0 for CPU-intensive workloads
• Whole stage code generation, vector operations
Main Takeaways
• Spark SQL
– Provides parallelism, affordable at scale
– Scale out on storage for big data volumes
– Scale out on CPU for memory-intensive queries
– Offloading reports from RDBMS becomes attractive
• Spark 2.0 optimizations
– Considerable speedup of CPU-intensive queries
Root Cause Analysis
• Active benchmarking
– Run the workload and measure it with the relevant
diagnostic tools
– Goals: understand the bottleneck(s) and find root
causes
– Limitations:
• Our tools, ability to run and understand them and time
available for analysis are limiting factors
Test Case 1/2
• Preparation of source data:
– Generate a DataFrame with 10M rows, and three columns
randomly generated
– Cache it in memory and register it as a temporary table
$ pyspark --driver-memory 2g
sqlContext.range(0, 1e7,1).registerTempTable("t0")
sqlContext.sql("select id, floor(200*rand()) bucket, floor(1000*rand())
val1, floor(10*rand()) val2 from t0").cache().registerTempTable("t1")
Test Case 2/2
• Test SQL:
– Complex and resource-intensive select statement
• With non-equijoin predicate and aggregations
sqlContext.sql("""
select a.bucket, sum(a.val2) tot
from t1 a, t1 b
where a.bucket=b.bucket
and a.val1+b.val1<1000
group by a.bucket order by a.bucket""").show()
Execution Plan
• The execution plan:
– First instrumentation point for SQL tuning
– Shows how Spark wants to execute the query
• Main players:
– Catalyst, the optimizer
– Tungsten the execution engine
Execution Plan in Spark 1.6
• Note: Sort Merge Join and In Memory Scan
Execution Plan in Spark 2.0
• Note: steps marked with (*) -> Code generation
Web UI: plan
comparison
Note in Spark 2.0
steps with “Whole
Stage CodeGen”
Additional Checks at OS Level
• Observation: the test workload is CPU-bound
– OS tools confirm this
– Spark used in local mode
• One multi-threaded java process
• Takes all available CPU resources in the machine
• Specs of the machine for testing:
– 16 cores (2 x E5-2650) and 128 GB of RAM (virtual
memory allocated ~ 16 GB)
Profiling CPU-Bound Workloads
• Flame graph visualization of stack profiles
– Brain child of Brendan Gregg (Dec 2011)
– Code: https://github.com/brendangregg/FlameGraph
– Now very popular, available for many languages, also
for JVM
• Shows which parts of the code are hot
– Very useful to understand where CPU cycles are spent
JVM and Stack Profiling
• Jstack <pid>
– Prints java stack for all threads
– What you want is a series of stack traces
• Java Flight Recorder
– Part of the HotSpot JVM (requires license for prod)
• Linux Perf
– Stack sampling of Java and OS
Flame Graph Visualization
• Recipe:
– Gather multiple stack traces
– Aggregate them by sorting alphabetically by function/method name
– Visualization using stacked colored boxes
– Length of the box proportional to time spent there
F1 F1 F1 F1
F2 F4 F4
F3
Function F1
Function F4F2
F3
Sort and merge
stack samples into
a flame graph
Flame Graph Spark 1.6
Spark CodeGen vs. Volcano
• Code generation improves CPU-intensive workloads
– Replaces loops and virtual function calls (volcano model)
with code generated for the query
– The use of vector operations (e.g. SIMD) also beneficial
– Codegen is crucial for modern in-memory DBs
• Commercial RDBMS engines
– Typically use the slower volcano model (with loops and
virtual function calls)
– In the past optimizing for I/O latency was more important,
now CPU cycles matter more
Flame Graph Spark 2.0
How-To: Flame Graph 1/2
• Enable Java Flight Recorder
– Extra options in spark-defaults.conf or CLI. Example:
• Collect data with jcmd.
• Example, sampling for 10 sec:
$ pyspark --conf "spark.driver.extraJavaOptions"="-XX:+UnlockCommercialFeatures -
XX:+FlightRecorder" --conf "spark.executor.extraJavaOptions"="-XX:+UnlockCommercialFeatures
-XX:+FlightRecorder"
$ jcmd <pid> JFR.start duration=10s filename=$PWD/myoutput.jfr
How-To: Flame Graph 2/2
• Process the jfr file:
– From .jfr to merged stacks
– Produce the .svg file with the flame graph
• Find details in Kay Ousterhout’s article:
– https://gist.github.com/kayousterhout/7008a8ebf2bab
eedc7ce6f8723fd1bf4
$ jfr-flame-graph/run.sh -f myoutput.jfr -o myoutput.txt
$ FlameGraph/flamegraph.pl myoutput.txt > myflamegraph.svg
Linux Perf Sampling 1/2
• Java mixed-mode flame graphs with Linux Perf_events
– Profiles CPU cycles spent on JVM and outside (e.g. Kernel)
• Additional complexity to work around Java-specific dtails
– Additional options for JVM are needed
• Issue with preserving frame pointers
• Fixed in Java8 update 60 build 19 or higher
• Another issue is with inlined functions:
– fixed adding option: -XX:MaxInlineSize=0
$ pyspark --conf "spark.driver.extraJavaOptions"="-XX:+PreserveFramePointer” --conf
"spark.executor.extraJavaOptions"= "="-XX:+PreserveFramePointer”
Linux Perf Sampling 2/2
• Collect stack samples with perf:
• Additional step: dump symbols. See
– https://github.com/jrudolph/perf-map-agent
– https://github.com/brendangregg/Misc/blob/master/java/jmaps
• Create flame graph from stack samples:
# perf record –F 99 –g –a –p <pid> sleep 10
$ perf script > myoutput.txt
$ ./stackcollapse-perf.pl myoutput.txt | ./flamegraph.pl --color=java --hash > myoutput.svg
HProfiler
• Hprofiler is a home-built tool
– Automates collection and aggregation of stack traces into flame
graphs for distributed applications
– Integrates with YARN to identify the processes to trace across
the cluster
– Based on Linux perf_events stack sampling
• Experimental tool
– Author Joeri Hermans @ CERN
– https://github.com/cerndb/Hadoop-Profiler
– https://db-blog.web.cern.ch/blog/joeri-hermans/2016-04-hadoop-
performance-troubleshooting-stack-tracing-introduction
Recap on Flame Graphs
• Pros: good to understand where CPU cycles are spent
– Useful for performance troubleshooting and internals investigations
– Functions at the top of the graph are the ones using CPU
– Parent methods/functions provide context
• Limitations:
– Off-CPU and wait time not charted
• Off-CPU flame graphs exist, but still experimental
– Aggregation at the function/method level
• Does not necessarily highlight the critical path in the code
– Interpretation of flame graphs requires experience/knowledge
Further Drill Down, the Source Code
• Further drill down on the source code
– Search on Github for the method names as found in
the flame graph
– Examples:
• "org.apache.sql.execution.WholeStageCodegenExec“
• "org.apache.spark.sql.executio.aggregate.VectorizedHashM
apGenerator.scala"
Linux Perf Stat
• Perf stat counters to further understand
– Access to memory is key
– Much higher memory throughput in Spark 2.0 vs 1.6
• See LLC-LOAD, LLC-load-misses
# perf stat -e task-clock,cycles,instructions,branches,branch-misses 
-e stalled-cycles-frontend,stalled-cycles-backend 
-e cache-references,cache-misses 
-e LLC-loads,LLC-load-misses,LLC-stores,LLC-store-misses 
-e L1-dcache-loads,L1-dcache-load-misses,L1-dcache-stores,L1-dcache-store-misses 
-p <pid_spark_process> sleep 100
Conclusions
• Apache Spark
– Scalability and performance on commodity HW
– For I/O intensive and compute-intensive queries
– Spark SQL useful for offloading queries from RDBMS
• Spark 2.0, code generation and vector operations
– Important improvements for CPU-bound workloads
– Speedup close to one order of magnitude
• Spark 2.0 vs. Spark 1.6 for the tested workload
– Diagnostic tools and instrumentation are important:
• Execution plans, Linux perf events, flame graphs
Acknowledgements and Links
• This work has been made possible thanks to the
colleagues at CERN IT and Hadoop service
– In particular Zbigniew Baranowski and Joeri Hermans
– See also blog - http://db-blog.web.cern.ch/
• Brendan Gregg – Resources on flame graphs:
– http://www.brendangregg.com/flamegraphs.html
THANK YOU.
Contact: Luca.Canali@cern.ch

Spark Summit EU talk by Luca Canali

  • 1.
    Apache Spark 2.0Performance Improvements Investigated With Flame Graphs Luca Canali CERN, Geneva (CH)
  • 2.
    Speaker Intro • Databaseengineer and team lead at CERN IT – Hadoop and Spark service – Database services • Joined CERN in 2005 • 16 years of experience with database services – Performance, instrumentation, tools, Linux • @LucaCanaliDB – http://cern.ch/canali
  • 3.
    CERN • CERN -European Laboratory for Particle Physics • Founded in 1954 by 12 countries for fundamental research in physics • Today 22 member states + world-wide collaborations • About ~1000 MCHF yearly budget • 2’300 CERN personnel, 10’000 users from 110 countries
  • 4.
    Large Hadron Collider •Largest and most powerful particle accelerator
  • 5.
    LHC Physics andData • LHC physics is data- and compute- intensive – Oct 2016: ~160 PB archive on tape at CERN • Current rate of data acquisition: ~ 50 PB/year – Distributed computing effort (WLCG) • Computing: utilize ~ 300K cores – Technology • Custom data formats, applications and frameworks: ROOT
  • 6.
    Apache Spark @CERN • Spark is a key component of the CERN Hadoop Service – Three production Hadoop/YARN clusters • Aggregated capacity: ~1000 cores, 3 TB RAM, 1.2 PB used space on HDFS – Projects involving Spark: • Analytics for accelerator controls and logging • Monitoring use cases, this includes use of Spark streaming • Analytics on aggregated logs • Explorations on the use of Spark for physics analysis
  • 7.
    A Case fromProduction • Slow query in a relational database – Ad-hoc report for network experts – Query runs in >12 hours, CPU-bound, single- threaded • Run using Spark on a Hadoop cluster – Data exported with Apache Sqoop to HDFS – The now query runs in ~20 minutes, unchanged – Throw hardware to solve the problem -> cost effective
  • 8.
    Spark 1.6 vs.Spark 2.0 • Additional tests using Spark 2.0 – The query execution time goes down further • One order of magnitude: from 20 min to 2 min – How to explain this? • Optimizations in Spark 2.0 for CPU-intensive workloads • Whole stage code generation, vector operations
  • 9.
    Main Takeaways • SparkSQL – Provides parallelism, affordable at scale – Scale out on storage for big data volumes – Scale out on CPU for memory-intensive queries – Offloading reports from RDBMS becomes attractive • Spark 2.0 optimizations – Considerable speedup of CPU-intensive queries
  • 10.
    Root Cause Analysis •Active benchmarking – Run the workload and measure it with the relevant diagnostic tools – Goals: understand the bottleneck(s) and find root causes – Limitations: • Our tools, ability to run and understand them and time available for analysis are limiting factors
  • 11.
    Test Case 1/2 •Preparation of source data: – Generate a DataFrame with 10M rows, and three columns randomly generated – Cache it in memory and register it as a temporary table $ pyspark --driver-memory 2g sqlContext.range(0, 1e7,1).registerTempTable("t0") sqlContext.sql("select id, floor(200*rand()) bucket, floor(1000*rand()) val1, floor(10*rand()) val2 from t0").cache().registerTempTable("t1")
  • 12.
    Test Case 2/2 •Test SQL: – Complex and resource-intensive select statement • With non-equijoin predicate and aggregations sqlContext.sql(""" select a.bucket, sum(a.val2) tot from t1 a, t1 b where a.bucket=b.bucket and a.val1+b.val1<1000 group by a.bucket order by a.bucket""").show()
  • 13.
    Execution Plan • Theexecution plan: – First instrumentation point for SQL tuning – Shows how Spark wants to execute the query • Main players: – Catalyst, the optimizer – Tungsten the execution engine
  • 14.
    Execution Plan inSpark 1.6 • Note: Sort Merge Join and In Memory Scan
  • 15.
    Execution Plan inSpark 2.0 • Note: steps marked with (*) -> Code generation
  • 16.
    Web UI: plan comparison Notein Spark 2.0 steps with “Whole Stage CodeGen”
  • 17.
    Additional Checks atOS Level • Observation: the test workload is CPU-bound – OS tools confirm this – Spark used in local mode • One multi-threaded java process • Takes all available CPU resources in the machine • Specs of the machine for testing: – 16 cores (2 x E5-2650) and 128 GB of RAM (virtual memory allocated ~ 16 GB)
  • 18.
    Profiling CPU-Bound Workloads •Flame graph visualization of stack profiles – Brain child of Brendan Gregg (Dec 2011) – Code: https://github.com/brendangregg/FlameGraph – Now very popular, available for many languages, also for JVM • Shows which parts of the code are hot – Very useful to understand where CPU cycles are spent
  • 19.
    JVM and StackProfiling • Jstack <pid> – Prints java stack for all threads – What you want is a series of stack traces • Java Flight Recorder – Part of the HotSpot JVM (requires license for prod) • Linux Perf – Stack sampling of Java and OS
  • 20.
    Flame Graph Visualization •Recipe: – Gather multiple stack traces – Aggregate them by sorting alphabetically by function/method name – Visualization using stacked colored boxes – Length of the box proportional to time spent there F1 F1 F1 F1 F2 F4 F4 F3 Function F1 Function F4F2 F3 Sort and merge stack samples into a flame graph
  • 21.
  • 22.
    Spark CodeGen vs.Volcano • Code generation improves CPU-intensive workloads – Replaces loops and virtual function calls (volcano model) with code generated for the query – The use of vector operations (e.g. SIMD) also beneficial – Codegen is crucial for modern in-memory DBs • Commercial RDBMS engines – Typically use the slower volcano model (with loops and virtual function calls) – In the past optimizing for I/O latency was more important, now CPU cycles matter more
  • 23.
  • 24.
    How-To: Flame Graph1/2 • Enable Java Flight Recorder – Extra options in spark-defaults.conf or CLI. Example: • Collect data with jcmd. • Example, sampling for 10 sec: $ pyspark --conf "spark.driver.extraJavaOptions"="-XX:+UnlockCommercialFeatures - XX:+FlightRecorder" --conf "spark.executor.extraJavaOptions"="-XX:+UnlockCommercialFeatures -XX:+FlightRecorder" $ jcmd <pid> JFR.start duration=10s filename=$PWD/myoutput.jfr
  • 25.
    How-To: Flame Graph2/2 • Process the jfr file: – From .jfr to merged stacks – Produce the .svg file with the flame graph • Find details in Kay Ousterhout’s article: – https://gist.github.com/kayousterhout/7008a8ebf2bab eedc7ce6f8723fd1bf4 $ jfr-flame-graph/run.sh -f myoutput.jfr -o myoutput.txt $ FlameGraph/flamegraph.pl myoutput.txt > myflamegraph.svg
  • 26.
    Linux Perf Sampling1/2 • Java mixed-mode flame graphs with Linux Perf_events – Profiles CPU cycles spent on JVM and outside (e.g. Kernel) • Additional complexity to work around Java-specific dtails – Additional options for JVM are needed • Issue with preserving frame pointers • Fixed in Java8 update 60 build 19 or higher • Another issue is with inlined functions: – fixed adding option: -XX:MaxInlineSize=0 $ pyspark --conf "spark.driver.extraJavaOptions"="-XX:+PreserveFramePointer” --conf "spark.executor.extraJavaOptions"= "="-XX:+PreserveFramePointer”
  • 27.
    Linux Perf Sampling2/2 • Collect stack samples with perf: • Additional step: dump symbols. See – https://github.com/jrudolph/perf-map-agent – https://github.com/brendangregg/Misc/blob/master/java/jmaps • Create flame graph from stack samples: # perf record –F 99 –g –a –p <pid> sleep 10 $ perf script > myoutput.txt $ ./stackcollapse-perf.pl myoutput.txt | ./flamegraph.pl --color=java --hash > myoutput.svg
  • 28.
    HProfiler • Hprofiler isa home-built tool – Automates collection and aggregation of stack traces into flame graphs for distributed applications – Integrates with YARN to identify the processes to trace across the cluster – Based on Linux perf_events stack sampling • Experimental tool – Author Joeri Hermans @ CERN – https://github.com/cerndb/Hadoop-Profiler – https://db-blog.web.cern.ch/blog/joeri-hermans/2016-04-hadoop- performance-troubleshooting-stack-tracing-introduction
  • 29.
    Recap on FlameGraphs • Pros: good to understand where CPU cycles are spent – Useful for performance troubleshooting and internals investigations – Functions at the top of the graph are the ones using CPU – Parent methods/functions provide context • Limitations: – Off-CPU and wait time not charted • Off-CPU flame graphs exist, but still experimental – Aggregation at the function/method level • Does not necessarily highlight the critical path in the code – Interpretation of flame graphs requires experience/knowledge
  • 30.
    Further Drill Down,the Source Code • Further drill down on the source code – Search on Github for the method names as found in the flame graph – Examples: • "org.apache.sql.execution.WholeStageCodegenExec“ • "org.apache.spark.sql.executio.aggregate.VectorizedHashM apGenerator.scala"
  • 31.
    Linux Perf Stat •Perf stat counters to further understand – Access to memory is key – Much higher memory throughput in Spark 2.0 vs 1.6 • See LLC-LOAD, LLC-load-misses # perf stat -e task-clock,cycles,instructions,branches,branch-misses -e stalled-cycles-frontend,stalled-cycles-backend -e cache-references,cache-misses -e LLC-loads,LLC-load-misses,LLC-stores,LLC-store-misses -e L1-dcache-loads,L1-dcache-load-misses,L1-dcache-stores,L1-dcache-store-misses -p <pid_spark_process> sleep 100
  • 32.
    Conclusions • Apache Spark –Scalability and performance on commodity HW – For I/O intensive and compute-intensive queries – Spark SQL useful for offloading queries from RDBMS • Spark 2.0, code generation and vector operations – Important improvements for CPU-bound workloads – Speedup close to one order of magnitude • Spark 2.0 vs. Spark 1.6 for the tested workload – Diagnostic tools and instrumentation are important: • Execution plans, Linux perf events, flame graphs
  • 33.
    Acknowledgements and Links •This work has been made possible thanks to the colleagues at CERN IT and Hadoop service – In particular Zbigniew Baranowski and Joeri Hermans – See also blog - http://db-blog.web.cern.ch/ • Brendan Gregg – Resources on flame graphs: – http://www.brendangregg.com/flamegraphs.html
  • 34.