Downloaded 1,260 times

![Fig 8: Plastic limit distribution curve for Fly ash
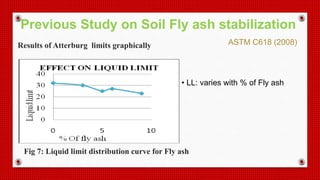
Results of Atterburg limits graphically
Previous Study on Soil Fly ash stabilization
[ASTM C618 (2008)]
•PL: varies with % of Fly ash](https://image.slidesharecdn.com/presentation-file-151106084804-lva1-app6891/85/SOIL-STABILIZATION-USING-LIME-AND-CEMENT-22-320.jpg)


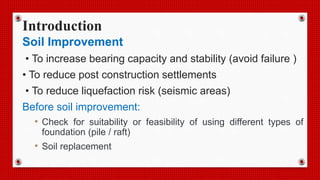
![Present Study on Soil Stabilization
Soil types: Two types of soil used in this study which are
Soil A[Dhaka Clay, Silty Clay] and Soil B[River Sand,
Sandy Sand]
Location: Soil A is collected from Green Road Dhaka and
Soil B is collected from Kanchpur River
Additives:
• Portland Cement
• Hydrated Lime [Ca(OH)2]](https://image.slidesharecdn.com/presentation-file-151106084804-lva1-app6891/85/SOIL-STABILIZATION-USING-LIME-AND-CEMENT-30-320.jpg)
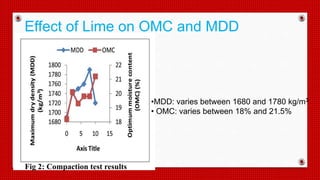
![0
10
20
30
40
50
60
1 10 100
WaterContent,W%
No. of blows, N
Liquid Limit Chart
LL= 35%
Fig 11: Flow Curve of Soil A Series I (No Additives)
Liquid Limit of Soil A [Dhaka Clay]](https://image.slidesharecdn.com/presentation-file-151106084804-lva1-app6891/85/SOIL-STABILIZATION-USING-LIME-AND-CEMENT-33-320.jpg)
![0
10
20
30
40
50
60
1 10 100
WaterContent,W%
No. of blows, N
Liquid Limit Chart
LL = 39%
Fig 12: Flow Curve of Soil A Series II-A
Liquid Limit of Soil A [Dhaka Clay]](https://image.slidesharecdn.com/presentation-file-151106084804-lva1-app6891/85/SOIL-STABILIZATION-USING-LIME-AND-CEMENT-34-320.jpg)
![0
10
20
30
40
50
60
1 10 100
Watercontent,W%
No. of blows, N
Liquid Limit Chart
LL= 40%
Fig 13: Flow Curve of Soil A Series II-B
Liquid Limit of Soil A [Dhaka Clay]](https://image.slidesharecdn.com/presentation-file-151106084804-lva1-app6891/85/SOIL-STABILIZATION-USING-LIME-AND-CEMENT-35-320.jpg)
![0
10
20
30
40
50
60
1 10 100
WaterContent,W%
No. of blows, N
Liquid Limit Chart
LL= 40%
Fig 14: Flow Curve of Soil A Series II-C
Liquid Limit of Soil A [Dhaka Clay]](https://image.slidesharecdn.com/presentation-file-151106084804-lva1-app6891/85/SOIL-STABILIZATION-USING-LIME-AND-CEMENT-36-320.jpg)
![0
5
10
15
20
25
30
1 10 100
WaterContent,W%
No of Blows , N
Liquid Limit Chart
LL = 21%
Fig 15: Flow Curve of Soil A Series III-A
Liquid Limit of Soil A [Dhaka Clay]](https://image.slidesharecdn.com/presentation-file-151106084804-lva1-app6891/85/SOIL-STABILIZATION-USING-LIME-AND-CEMENT-37-320.jpg)
![0
5
10
15
20
25
30
35
1 10 100
WaterContent,W%
No of Blows , N
Liquid Limit Chart
LL = 19%
Fig 16: Flow Curve of Soil A Series III-B
Liquid Limit of Soil A [Dhaka Clay]](https://image.slidesharecdn.com/presentation-file-151106084804-lva1-app6891/85/SOIL-STABILIZATION-USING-LIME-AND-CEMENT-38-320.jpg)
![0
2
4
6
8
10
12
14
16
1 10 100
WaterContent,W%
No of Blows, N
Liquid Limit Chart
LL = 9%
Fig 17: Flow Curve of Soil A Series III-C
Liquid Limit of Soil A [Dhaka Clay]](https://image.slidesharecdn.com/presentation-file-151106084804-lva1-app6891/85/SOIL-STABILIZATION-USING-LIME-AND-CEMENT-39-320.jpg)
![0
2
4
6
8
10
12
14
16
18
20
1 10 100
WaterContent,W%
No of Blows, N
Liquid Limit Chart
LL = 12%
Fig 18: Flow Curve of Soil-B Series V-A
Liquid Limit of Soil B[River Sand]](https://image.slidesharecdn.com/presentation-file-151106084804-lva1-app6891/85/SOIL-STABILIZATION-USING-LIME-AND-CEMENT-40-320.jpg)
![0
5
10
15
20
25
1 10 100
WaterContent,W%
No of Blows, N
Liquid Limit Chart
LL = 7%
Fig 19: Flow Curve of Soil-B Series V-B
Liquid Limit of Soil B[River Sand]](https://image.slidesharecdn.com/presentation-file-151106084804-lva1-app6891/85/SOIL-STABILIZATION-USING-LIME-AND-CEMENT-41-320.jpg)
![0
2
4
6
8
10
12
14
16
1 10 100
WaterContent,W%
No of Blows, N
Liquid Limit Chart
LL = 6%
Fig 20: Flow Curve of Soil-B Series V-C
Liquid Limit of Soil B[River Sand]](https://image.slidesharecdn.com/presentation-file-151106084804-lva1-app6891/85/SOIL-STABILIZATION-USING-LIME-AND-CEMENT-42-320.jpg)
![0
2
4
6
8
10
12
14
16
18
1 10 100
WaterContent,W%
No of Blows, N
Liquid Limit Chart
LL = 9%
Fig 21: Flow Curve of Soil-B Series V-D
Liquid Limit of Soil B[River Sand]](https://image.slidesharecdn.com/presentation-file-151106084804-lva1-app6891/85/SOIL-STABILIZATION-USING-LIME-AND-CEMENT-43-320.jpg)


![1560.00
1580.00
1600.00
1620.00
1640.00
1660.00
1680.00
1700.00
1720.00
0.00 5.00 10.00 15.00 20.00 25.00
MaximumDryDensitykg/m3
Water Content (%)
Fig 22: Compaction Curve for Soil A Series-II-A
Compaction Curve for Soil A [Dhaka Clay]](https://image.slidesharecdn.com/presentation-file-151106084804-lva1-app6891/85/SOIL-STABILIZATION-USING-LIME-AND-CEMENT-48-320.jpg)
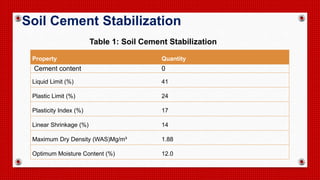
![1580.00
1590.00
1600.00
1610.00
1620.00
1630.00
1640.00
1650.00
1660.00
1670.00
1680.00
1690.00
0.00 5.00 10.00 15.00 20.00 25.00 30.00
MaximumDryDensitykg/m3
Water Content (%)
Fig 23: Compaction Curve for Soil A Series-II-B
Compaction Curve for Soil A [Dhaka Clay]](https://image.slidesharecdn.com/presentation-file-151106084804-lva1-app6891/85/SOIL-STABILIZATION-USING-LIME-AND-CEMENT-49-320.jpg)
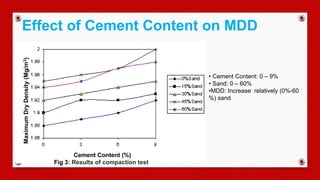
![1625.00
1630.00
1635.00
1640.00
1645.00
1650.00
1655.00
1660.00
1665.00
1670.00
1675.00
0.00 5.00 10.00 15.00 20.00 25.00
MaximumDryDensitykg/m3
Water Content (%)
Fig 24: Compaction Curve for Soil A Series-II-C
Compaction Curve for Soil A [Dhaka Clay]](https://image.slidesharecdn.com/presentation-file-151106084804-lva1-app6891/85/SOIL-STABILIZATION-USING-LIME-AND-CEMENT-50-320.jpg)
![1480.00
1500.00
1520.00
1540.00
1560.00
1580.00
1600.00
1620.00
1640.00
1660.00
1680.00
0.00 5.00 10.00 15.00 20.00 25.00 30.00 35.00
MaximumDryDensitykg/m3
Water Content (%)
Fig 25: Compaction Curve for Soil A [Series-II-D]
Compaction Curve for Soil A [Dhaka Clay]](https://image.slidesharecdn.com/presentation-file-151106084804-lva1-app6891/85/SOIL-STABILIZATION-USING-LIME-AND-CEMENT-51-320.jpg)
![1520.00
1540.00
1560.00
1580.00
1600.00
1620.00
1640.00
1660.00
1680.00
1700.00
0.00 5.00 10.00 15.00 20.00 25.00 30.00
MaximumDryDensitykg/m3
Water Content (%)
Fig 26: Compaction Curve for Soil A Series-III-A
Compaction Curve for Soil A [Dhaka Clay]](https://image.slidesharecdn.com/presentation-file-151106084804-lva1-app6891/85/SOIL-STABILIZATION-USING-LIME-AND-CEMENT-52-320.jpg)
![1500.00
1550.00
1600.00
1650.00
1700.00
1750.00
0.00 5.00 10.00 15.00 20.00 25.00
MaximumDryDensitykg/m3
Water Content (%)
Fig 27: Compaction Curve for Soil A Series-III-B
Compaction Curve for Soil A [Dhaka Clay]](https://image.slidesharecdn.com/presentation-file-151106084804-lva1-app6891/85/SOIL-STABILIZATION-USING-LIME-AND-CEMENT-53-320.jpg)
![1600.00
1620.00
1640.00
1660.00
1680.00
1700.00
1720.00
1740.00
1760.00
1780.00
1800.00
0.00 5.00 10.00 15.00 20.00 25.00
MaximumDryDensitykg/m3
Water Content (%)
Fig 28: Compaction Curve for Soil A [Series-III-C]
Compaction Curve for Soil A [Dhaka Clay]](https://image.slidesharecdn.com/presentation-file-151106084804-lva1-app6891/85/SOIL-STABILIZATION-USING-LIME-AND-CEMENT-54-320.jpg)
![1550.00
1600.00
1650.00
1700.00
1750.00
1800.00
1850.00
0.00 5.00 10.00 15.00 20.00 25.00 30.00
MaximumDryDensitykg/m3
Water Content (%)
Fig 29: Compaction Curve for Soil A [Series-III-D]
Compaction Curve for Soil A [Dhaka Clay]](https://image.slidesharecdn.com/presentation-file-151106084804-lva1-app6891/85/SOIL-STABILIZATION-USING-LIME-AND-CEMENT-55-320.jpg)
![1480.00
1490.00
1500.00
1510.00
1520.00
1530.00
1540.00
1550.00
1560.00
1570.00
1580.00
1590.00
1600.00
1610.00
0.00 5.00 10.00 15.00 20.00 25.00 30.00
MaximumDryDensitykg/m3
Water Content (%)
Fig 30: Compaction Curve for Soil B [Series-IV]
Compaction Curve for Soil B [River Sand]](https://image.slidesharecdn.com/presentation-file-151106084804-lva1-app6891/85/SOIL-STABILIZATION-USING-LIME-AND-CEMENT-57-320.jpg)
![1585.00
1590.00
1595.00
1600.00
1605.00
1610.00
1615.00
1620.00
1625.00
1630.00
1635.00
1640.00
0.00 5.00 10.00 15.00 20.00 25.00
MaximumDryDensitykg/m3
Water content (%)
Fig 31: Compaction Curve for Soil B [Series V-A]
Compaction Curve for Soil B [River Sand]](https://image.slidesharecdn.com/presentation-file-151106084804-lva1-app6891/85/SOIL-STABILIZATION-USING-LIME-AND-CEMENT-58-320.jpg)
![1560.00
1580.00
1600.00
1620.00
1640.00
1660.00
1680.00
1700.00
1720.00
0.00 5.00 10.00 15.00 20.00 25.00
MaximumDryDensitykg/m3
Water content (%)
Fig 32: Compaction Curve for Soil B [Series-VB]
Compaction Curve for Soil B [River Sand]](https://image.slidesharecdn.com/presentation-file-151106084804-lva1-app6891/85/SOIL-STABILIZATION-USING-LIME-AND-CEMENT-59-320.jpg)
![1600.00
1620.00
1640.00
1660.00
1680.00
1700.00
1720.00
1740.00
1760.00
0.00 5.00 10.00 15.00 20.00 25.00
MaximumDryDensitykg/m3
Water content (%)
Fig 33: Compaction Curve for Soil B [Series V-C]
Compaction Curve for Soil B [River Sand]](https://image.slidesharecdn.com/presentation-file-151106084804-lva1-app6891/85/SOIL-STABILIZATION-USING-LIME-AND-CEMENT-60-320.jpg)
![1620.00
1640.00
1660.00
1680.00
1700.00
1720.00
1740.00
1760.00
1780.00
0.00 2.00 4.00 6.00 8.00 10.00 12.00 14.00 16.00 18.00
MaximumDryDensitykg/m3
Water Content (%)
Fig 34: Compaction Curve for Soil B [Series V-D]
Compaction Curve for Soil B [River Sand]](https://image.slidesharecdn.com/presentation-file-151106084804-lva1-app6891/85/SOIL-STABILIZATION-USING-LIME-AND-CEMENT-61-320.jpg)

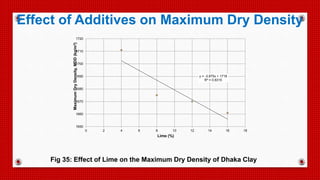
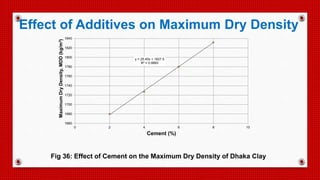
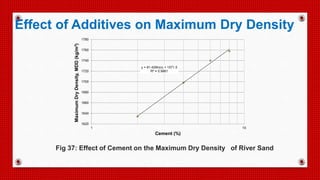
![ It was found that Liquid limit also are same for lime content but plastic limit
varied with increasing % of lime content for Dhaka clay [Soil A] but the liquid
limit change with increasing % of cement both Dhaka clay [Soil A] and River
sand [Soil B].
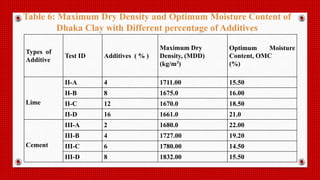
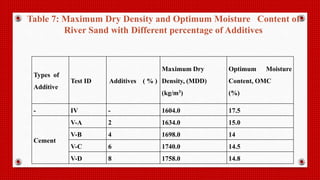
It was found that Maximum Dry Density (MDD) decreased with the
increase in % of lime content for Dhaka Clay but MDD increased with
increasing % of cement content both Dhaka Clay and River Sand
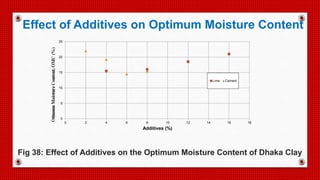
Optimum Moisture Content decreased with increasing ( 0-6) % of cement
content but it increased for 8% of cement content
CONCLUSION](https://image.slidesharecdn.com/presentation-file-151106084804-lva1-app6891/85/SOIL-STABILIZATION-USING-LIME-AND-CEMENT-68-320.jpg)


This document summarizes a study on soil stabilization using lime and cement additives. The study aimed to analyze the effect of lime and cement on soil properties such as Atterberg limits, maximum dry density, and optimum moisture content. A literature review found that lime reduces plasticity and moisture retention while cement increases strength and durability. The experimental program involved testing soils with different additive types and percentages. Results showed that lime and cement can increase maximum dry density while decreasing liquid limit and optimum moisture content. This indicates soil stabilization using lime and cement can improve engineering properties of soils.


![Geotechnical Engineering-II [Lec #11: Settlement Computation]](https://cdn.slidesharecdn.com/ss_thumbnails/11-181020124840-thumbnail.jpg?width=640&height=640&fit=bounds)


![MAJOR PRO hacker find SidJECT-CIVIL[1].pptx](https://cdn.slidesharecdn.com/ss_thumbnails/majorproject-civil1-250424053439-b9b02631-thumbnail.jpg?width=640&height=640&fit=bounds)


