Download to read offline

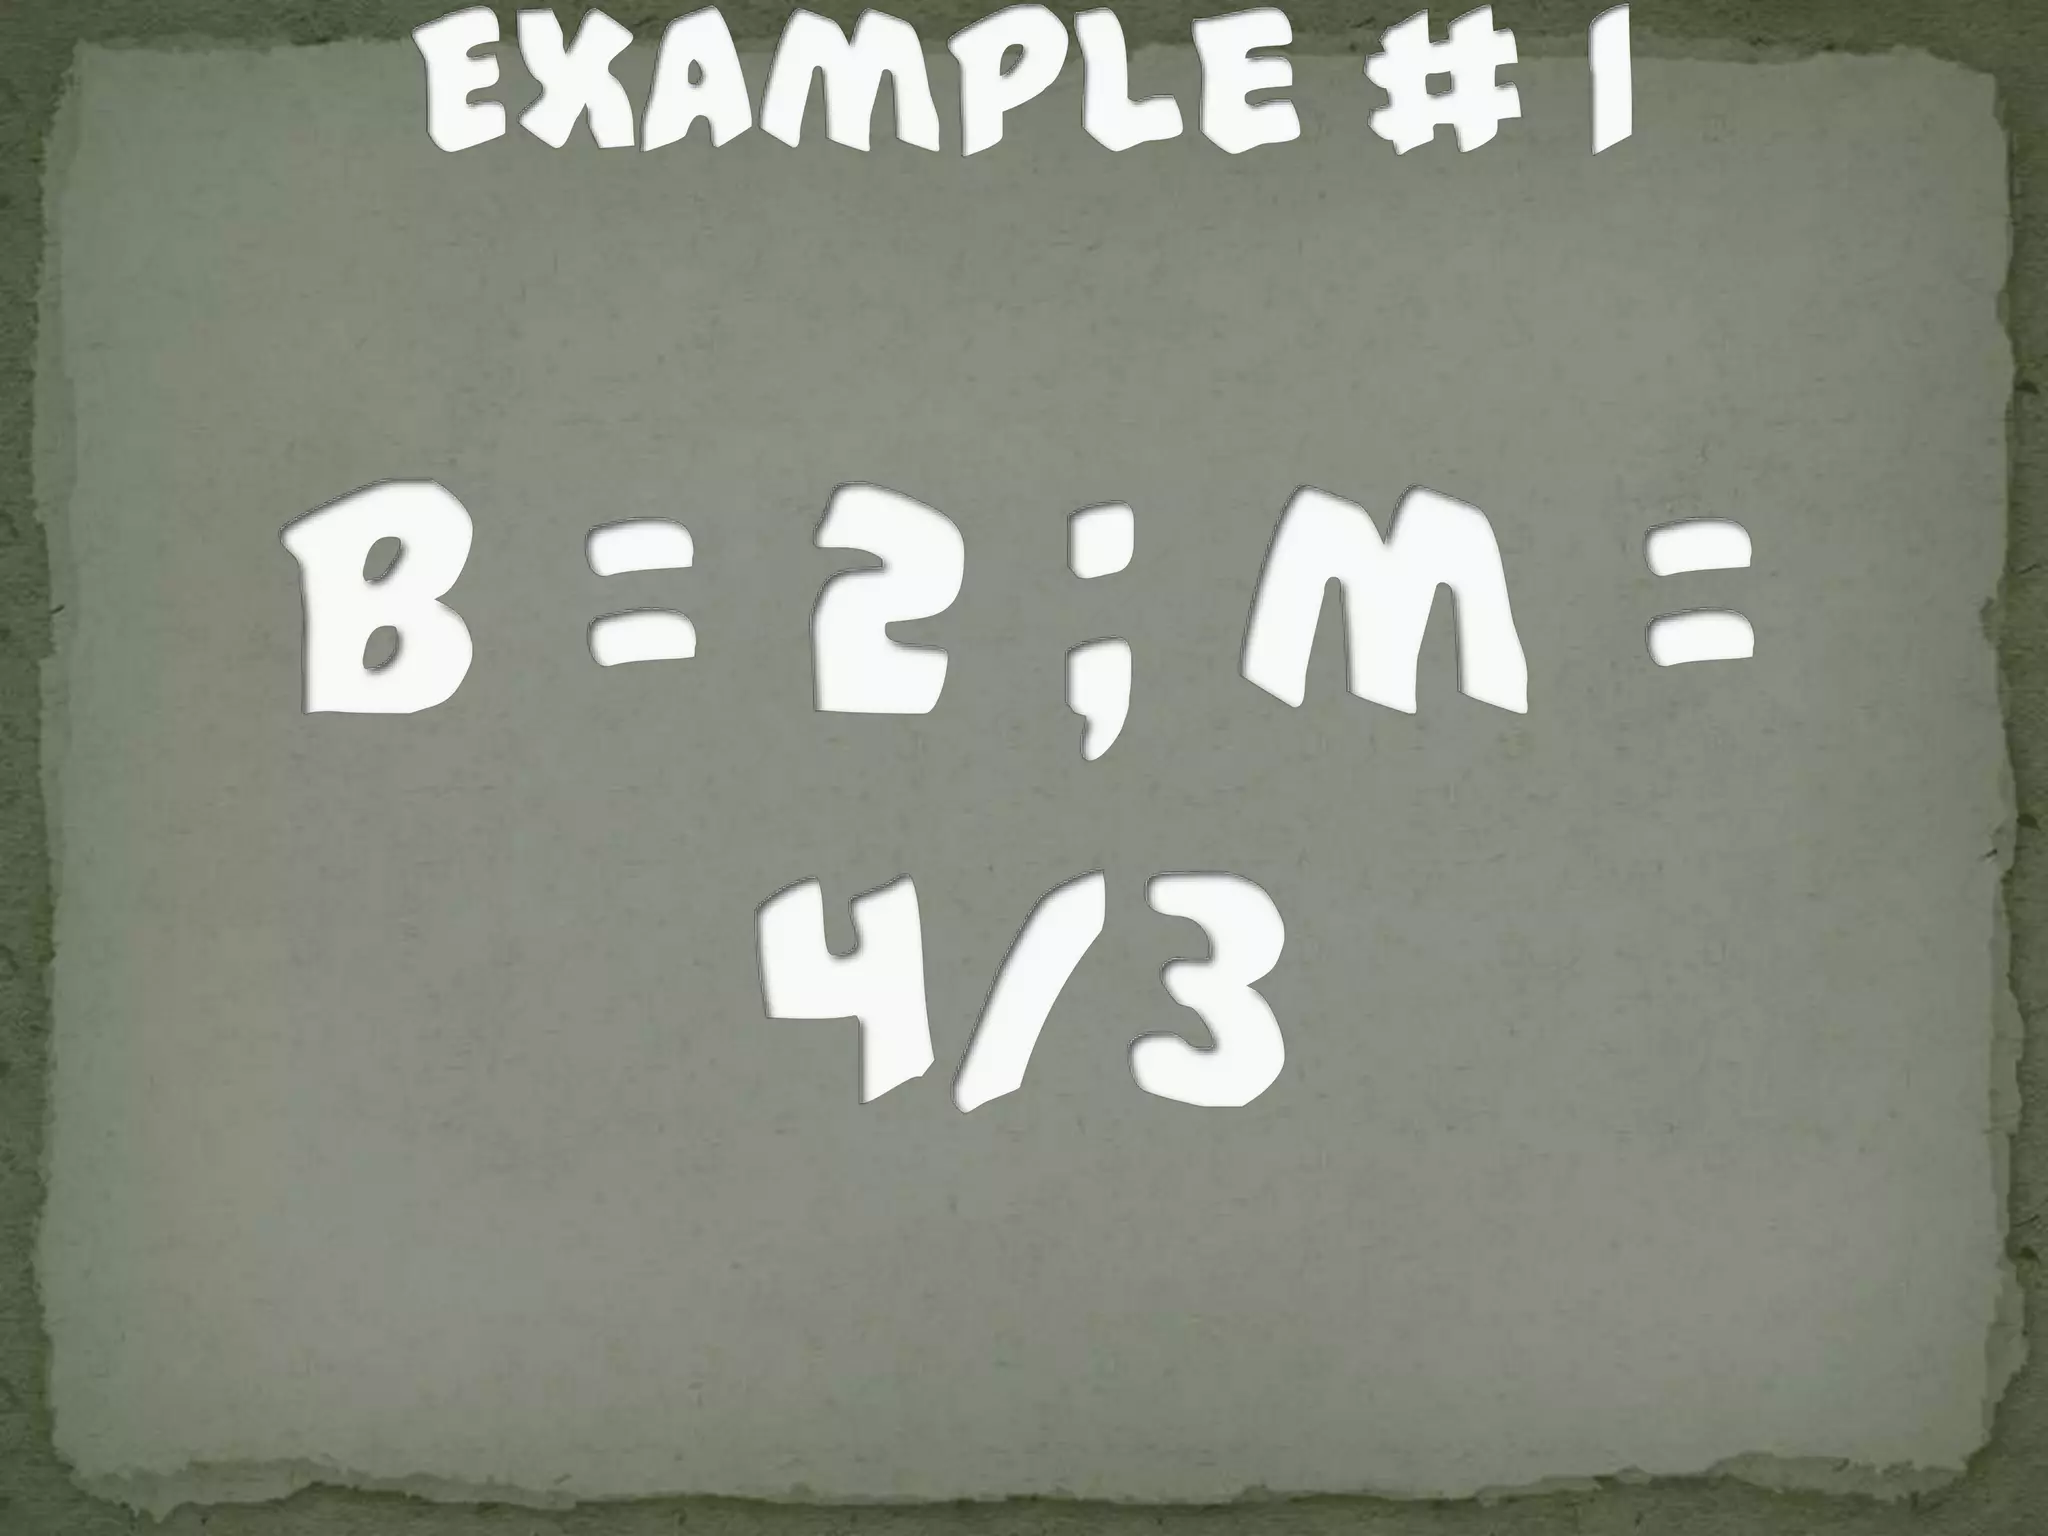
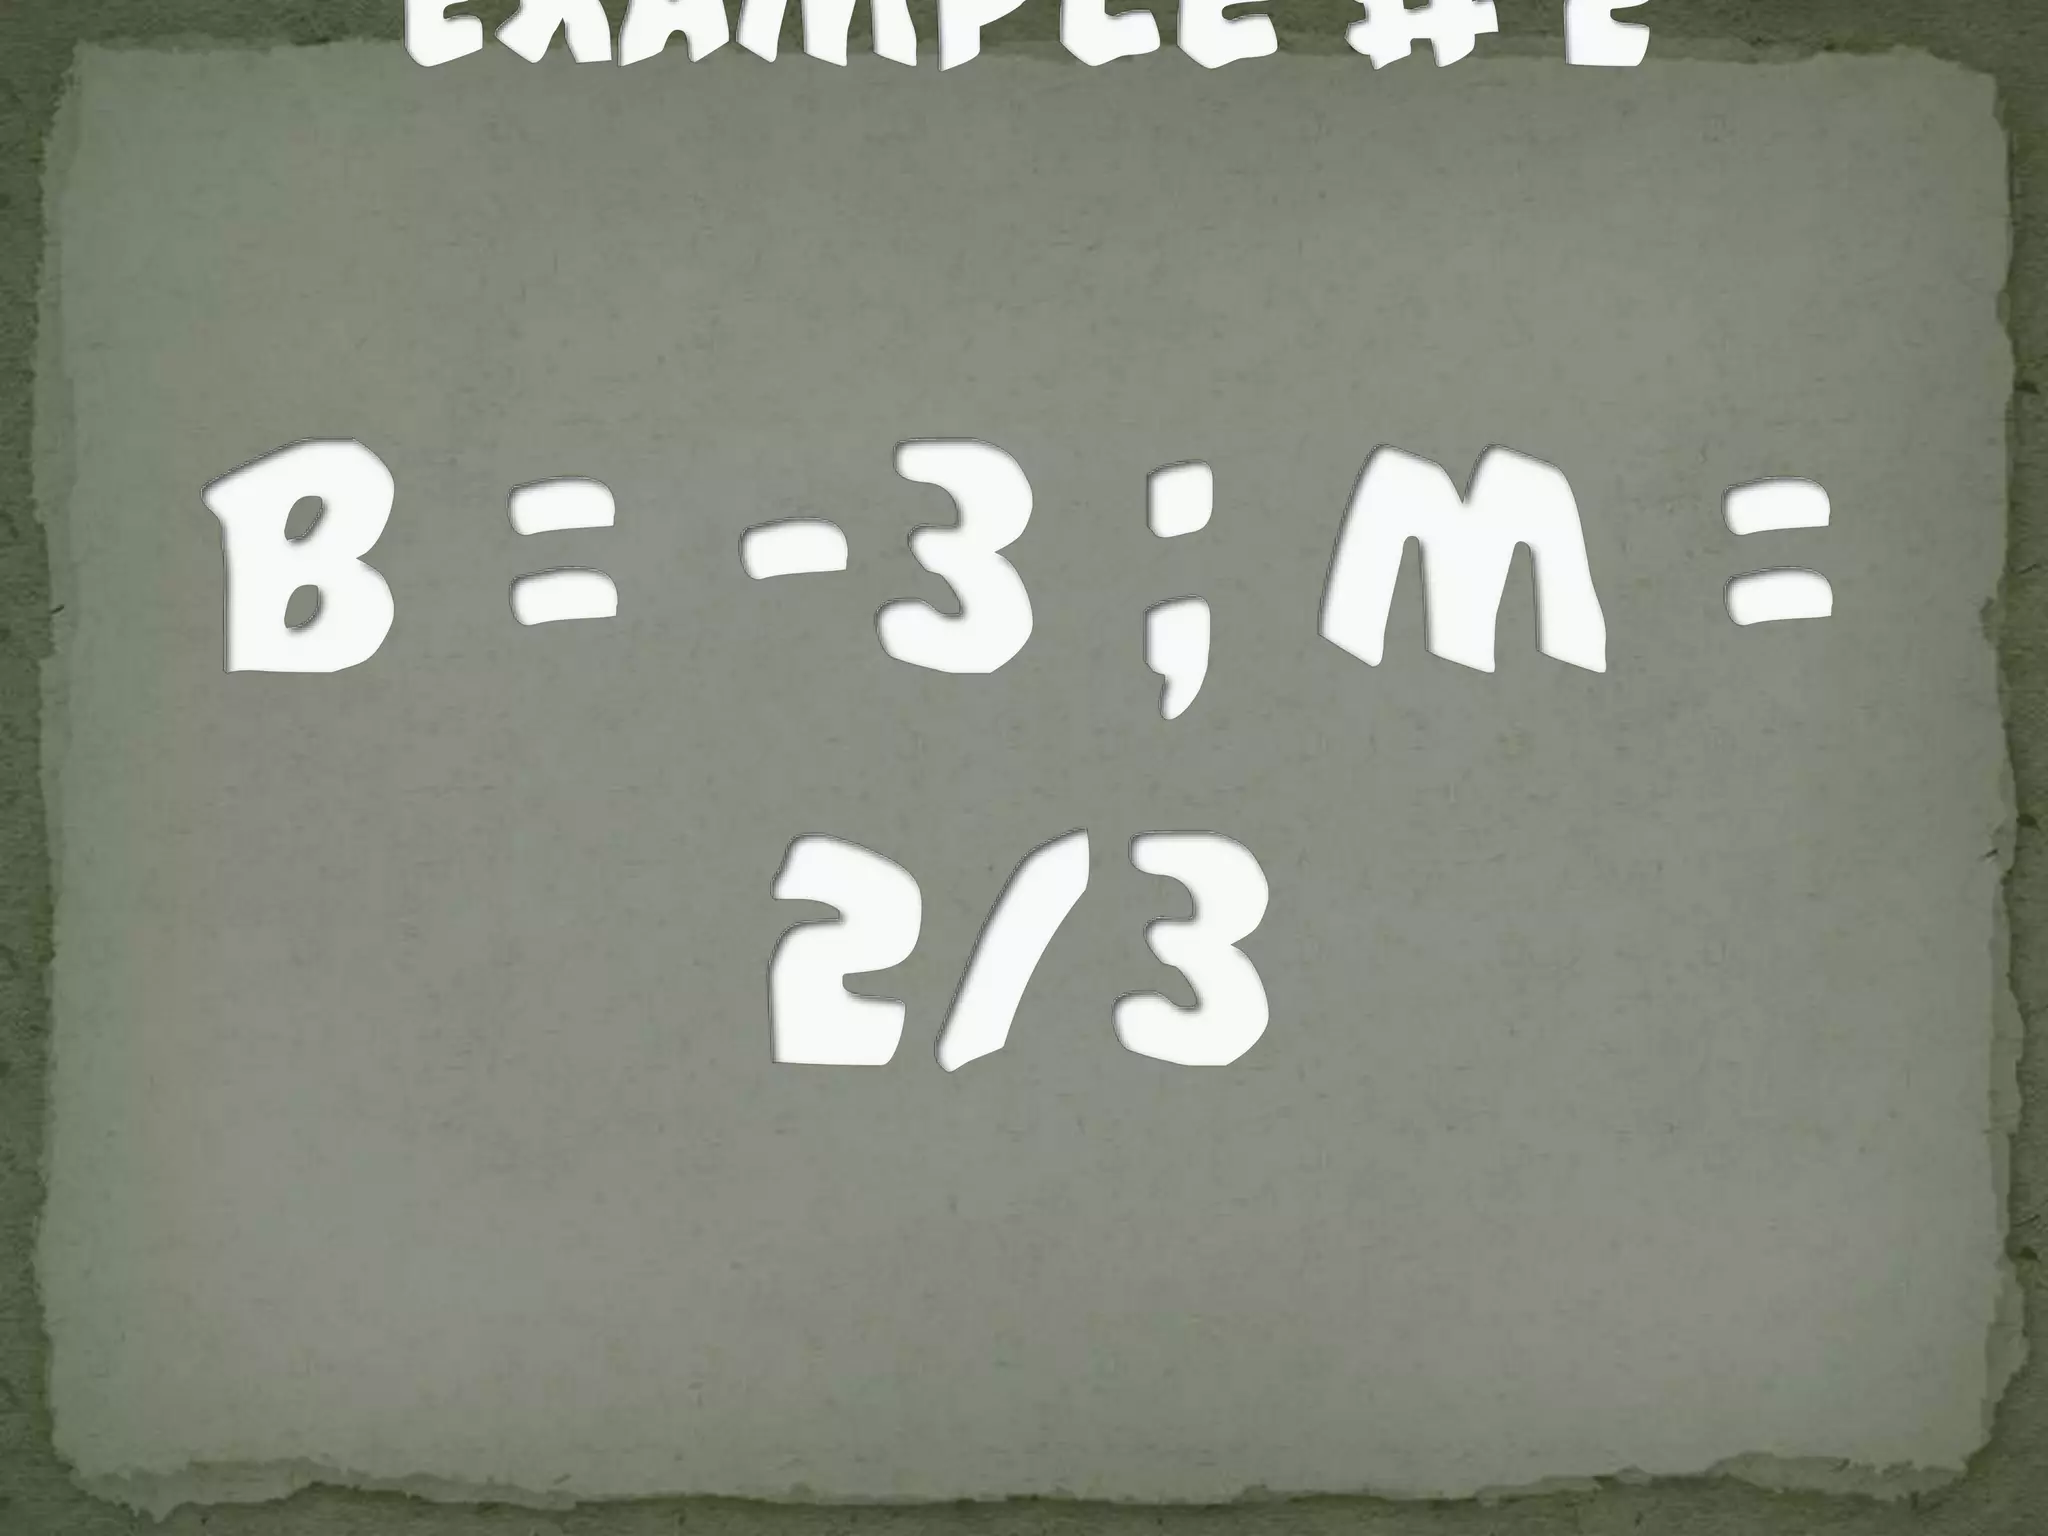
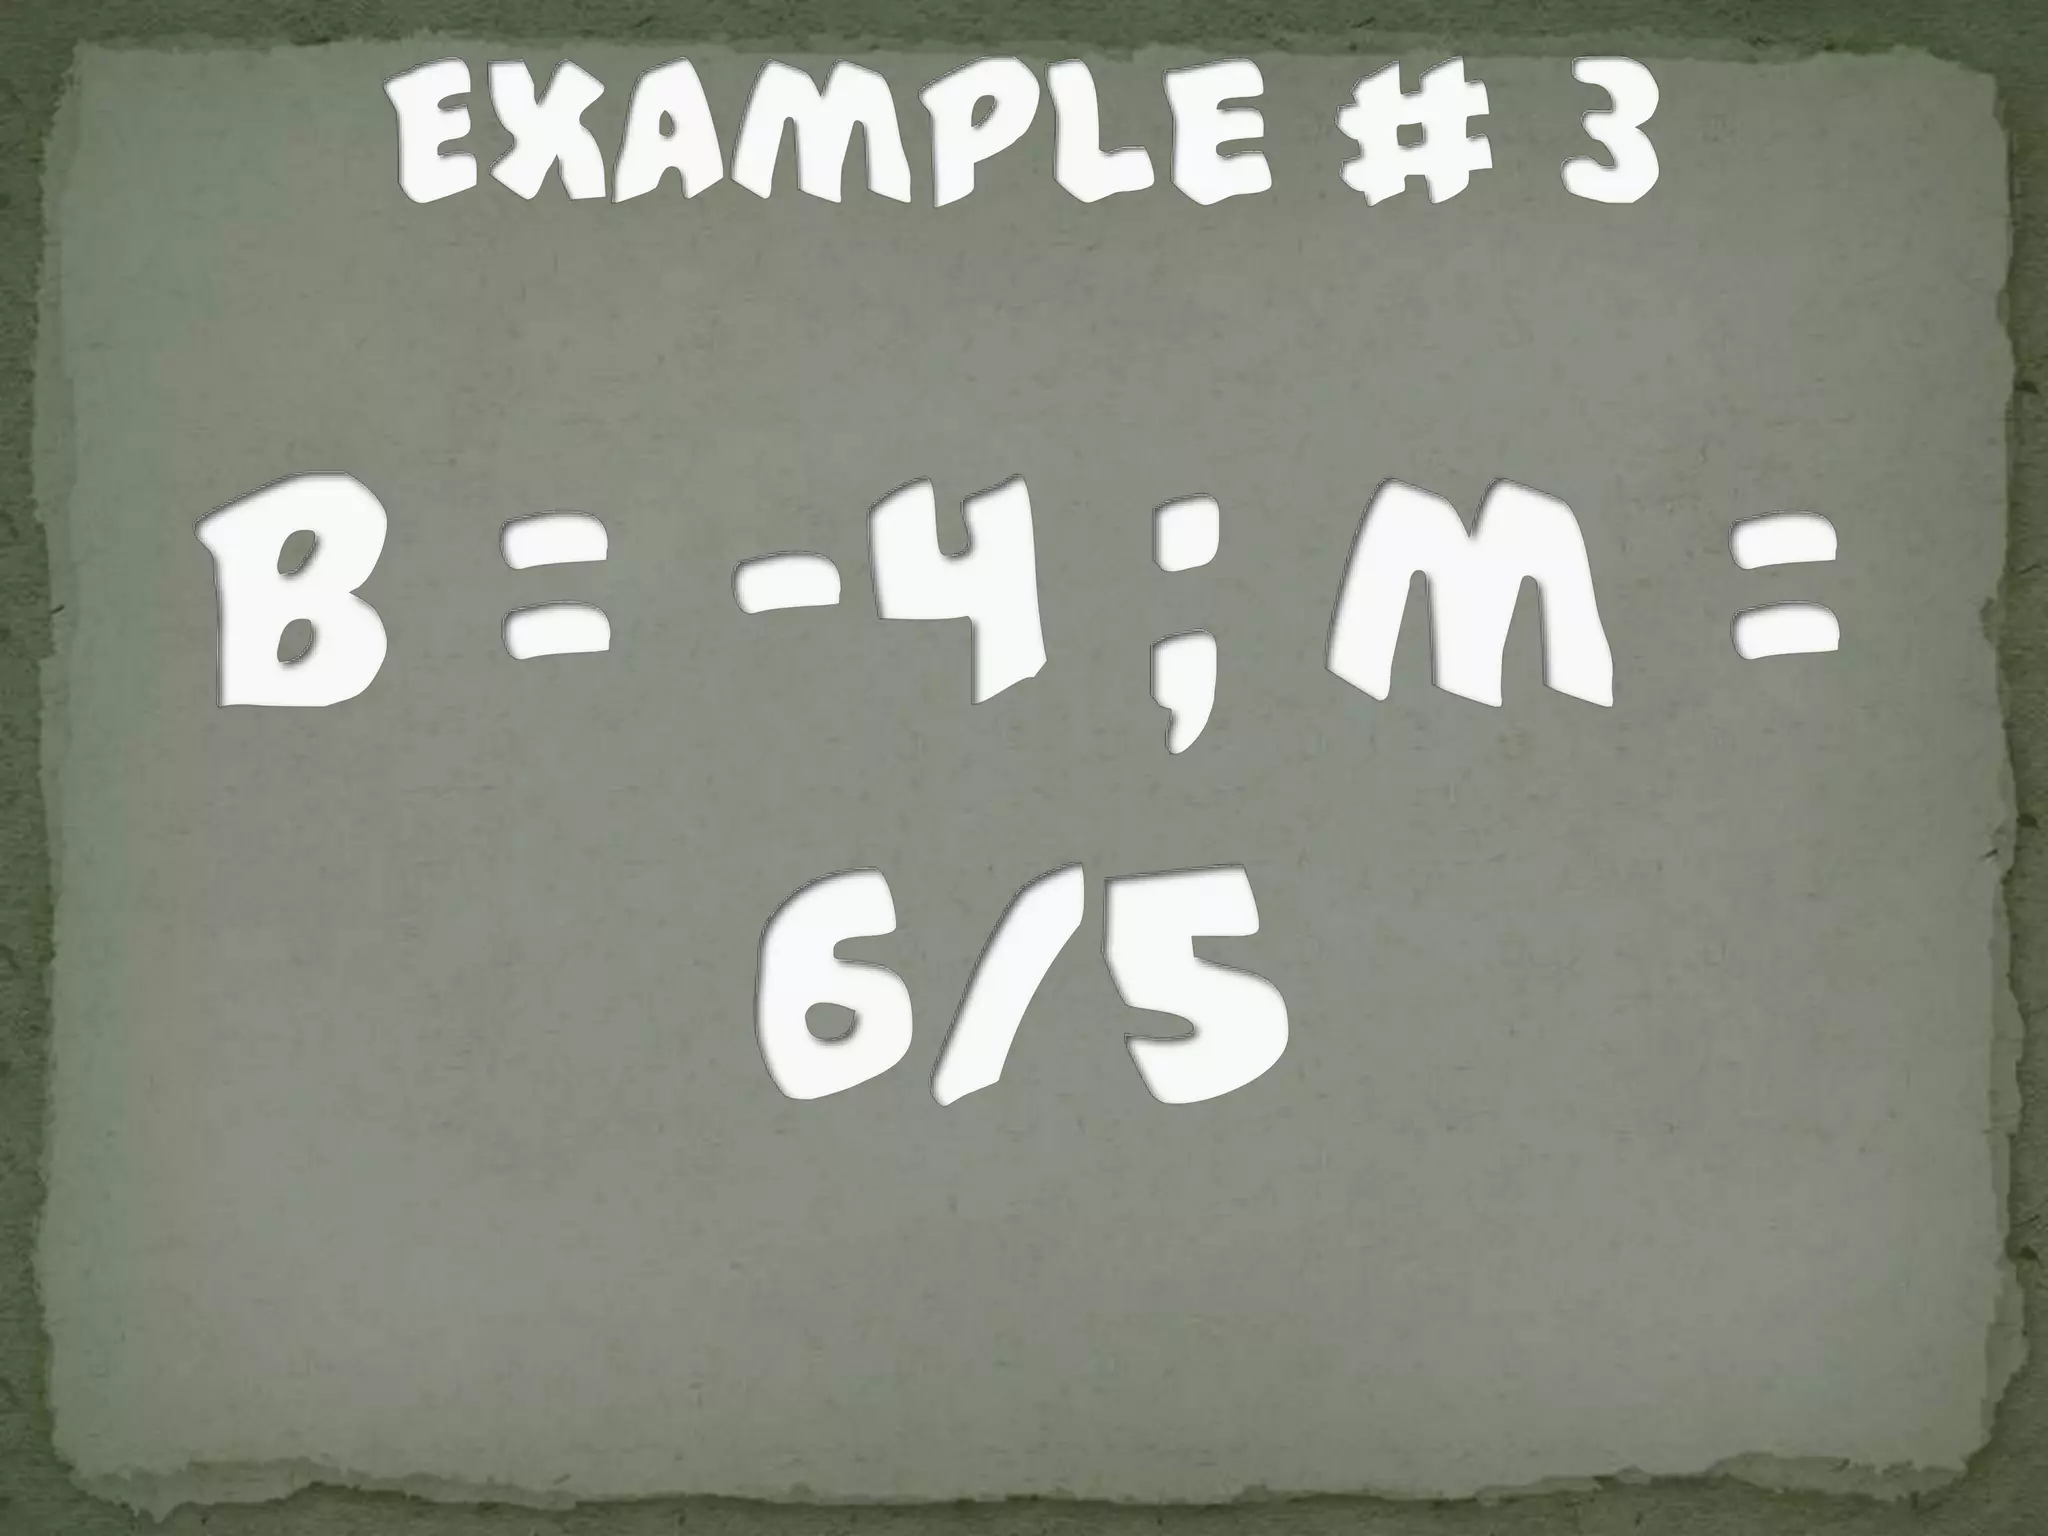
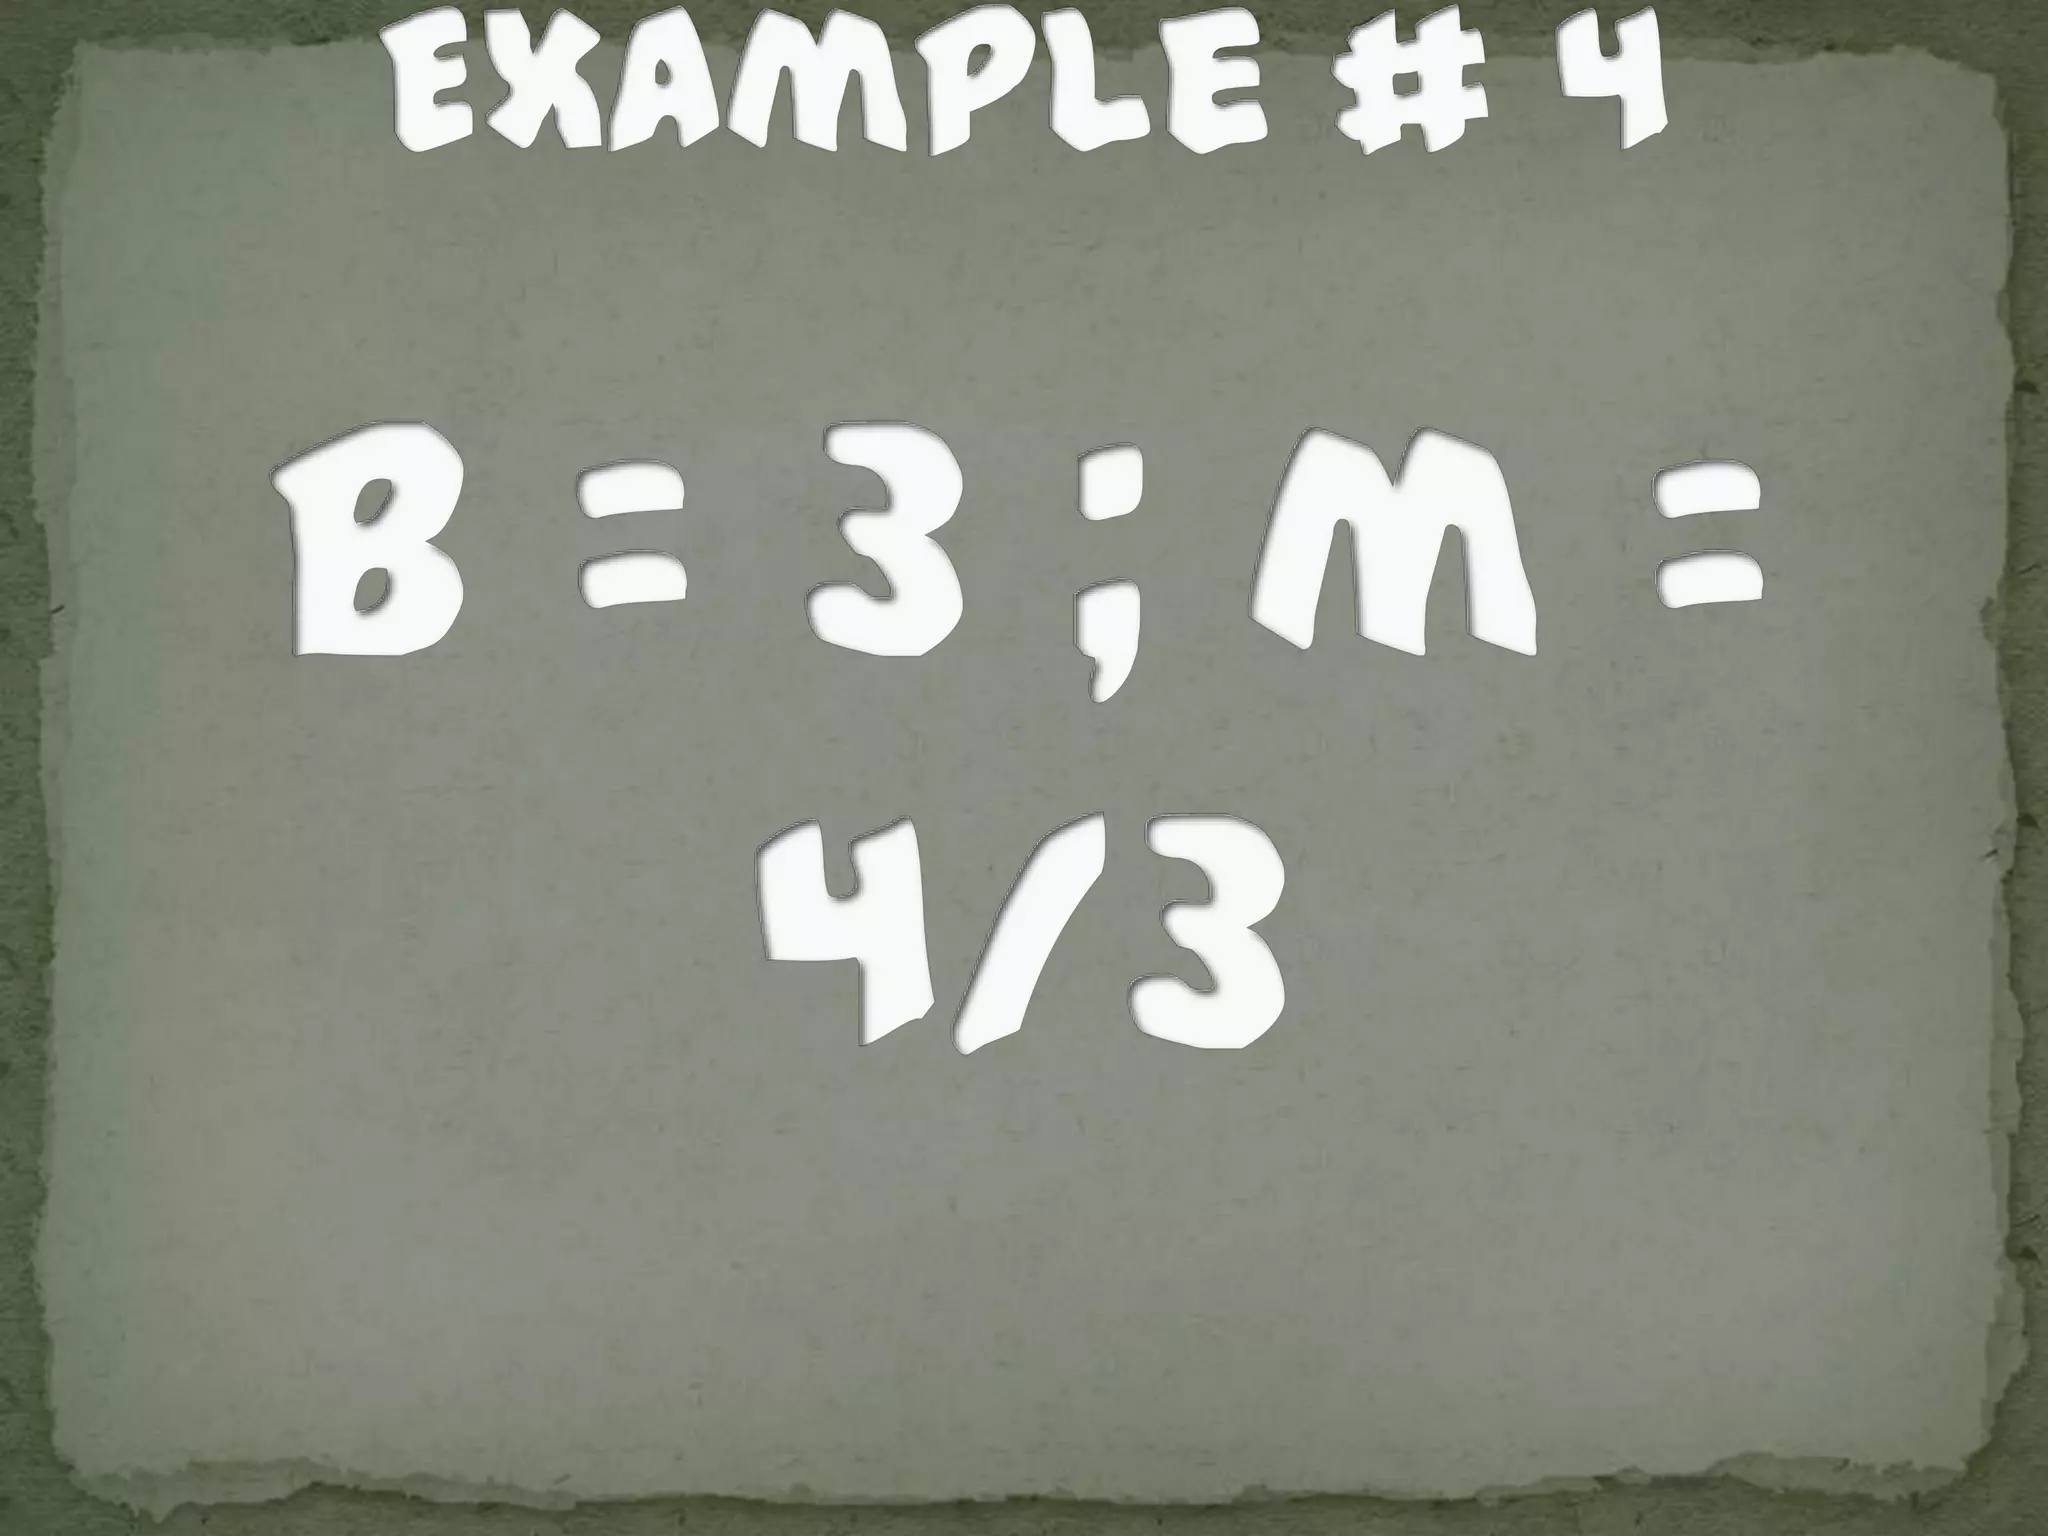
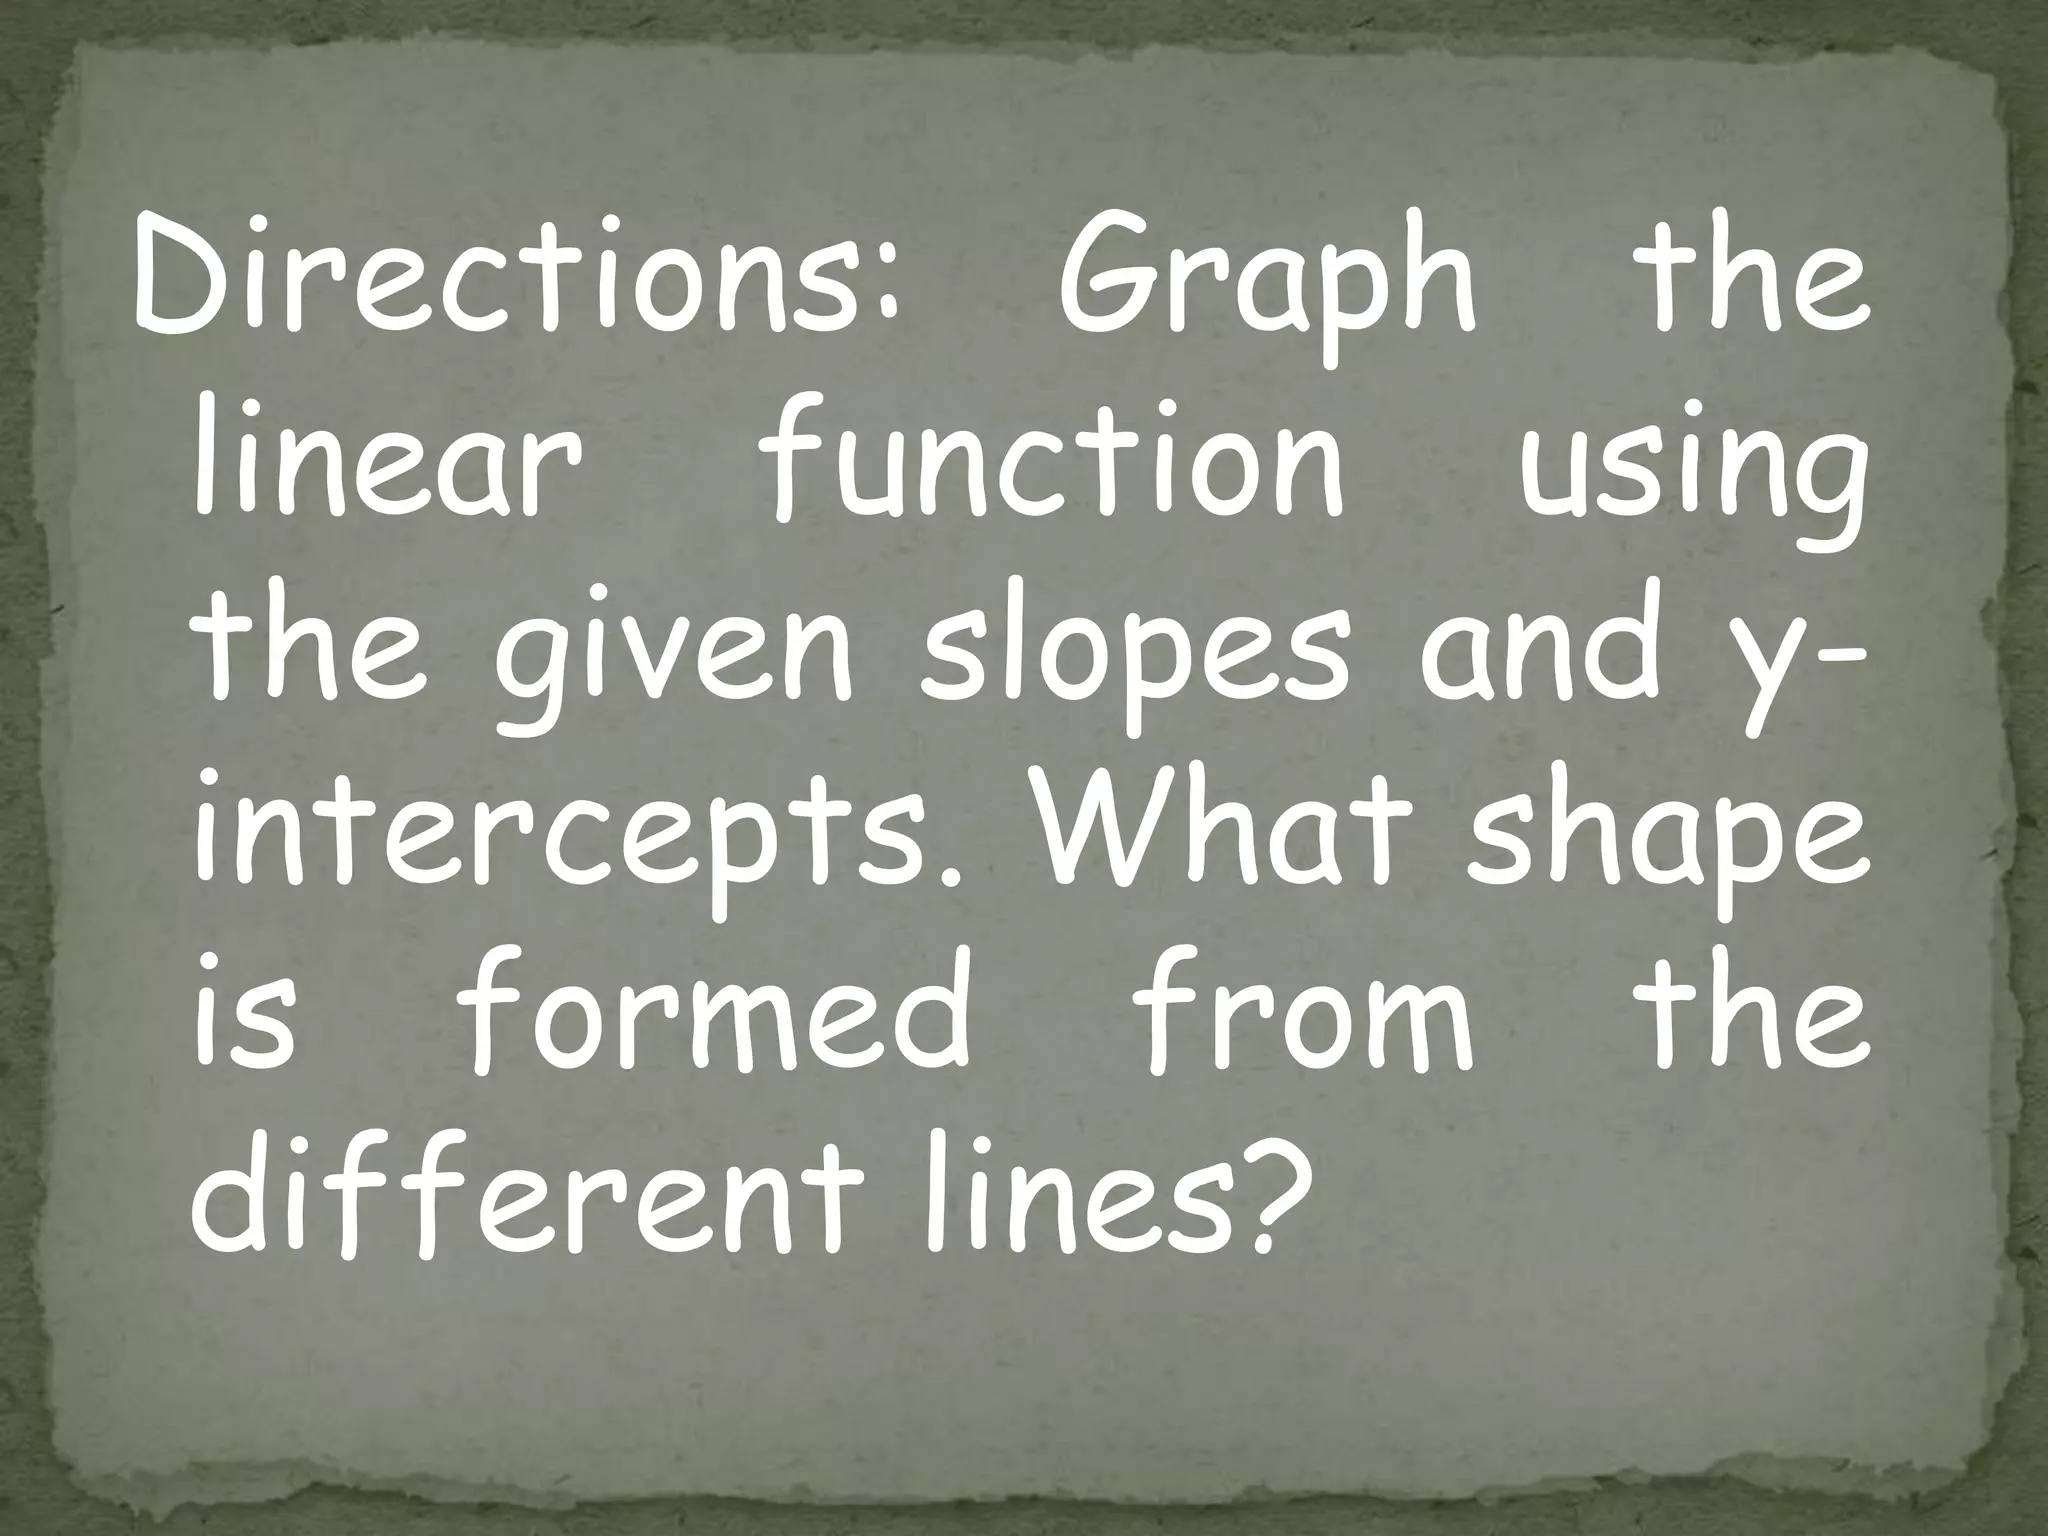

This document discusses how to graph linear functions by identifying the y-intercept and slope. It explains that the y-intercept is the point where the line crosses the y-axis, while the slope is the rise over run and written as a fraction. It provides instructions to locate the y-intercept, use the slope to find another point, and connect the points to graph the linear function. Students are then directed to graph several linear functions using given slopes and y-intercepts and write the coordinates of new points.