• Write thelinear equation in the form and vice
versa
• Graph a linear equation given (a) any two
points; (b) the and - intercepts; and (c) the
slope and a point on the line.
• Describe the graph of a linear equation in
terms of its intercepts and slope.
3.
Let’s explore different
wayswe can represent
data!
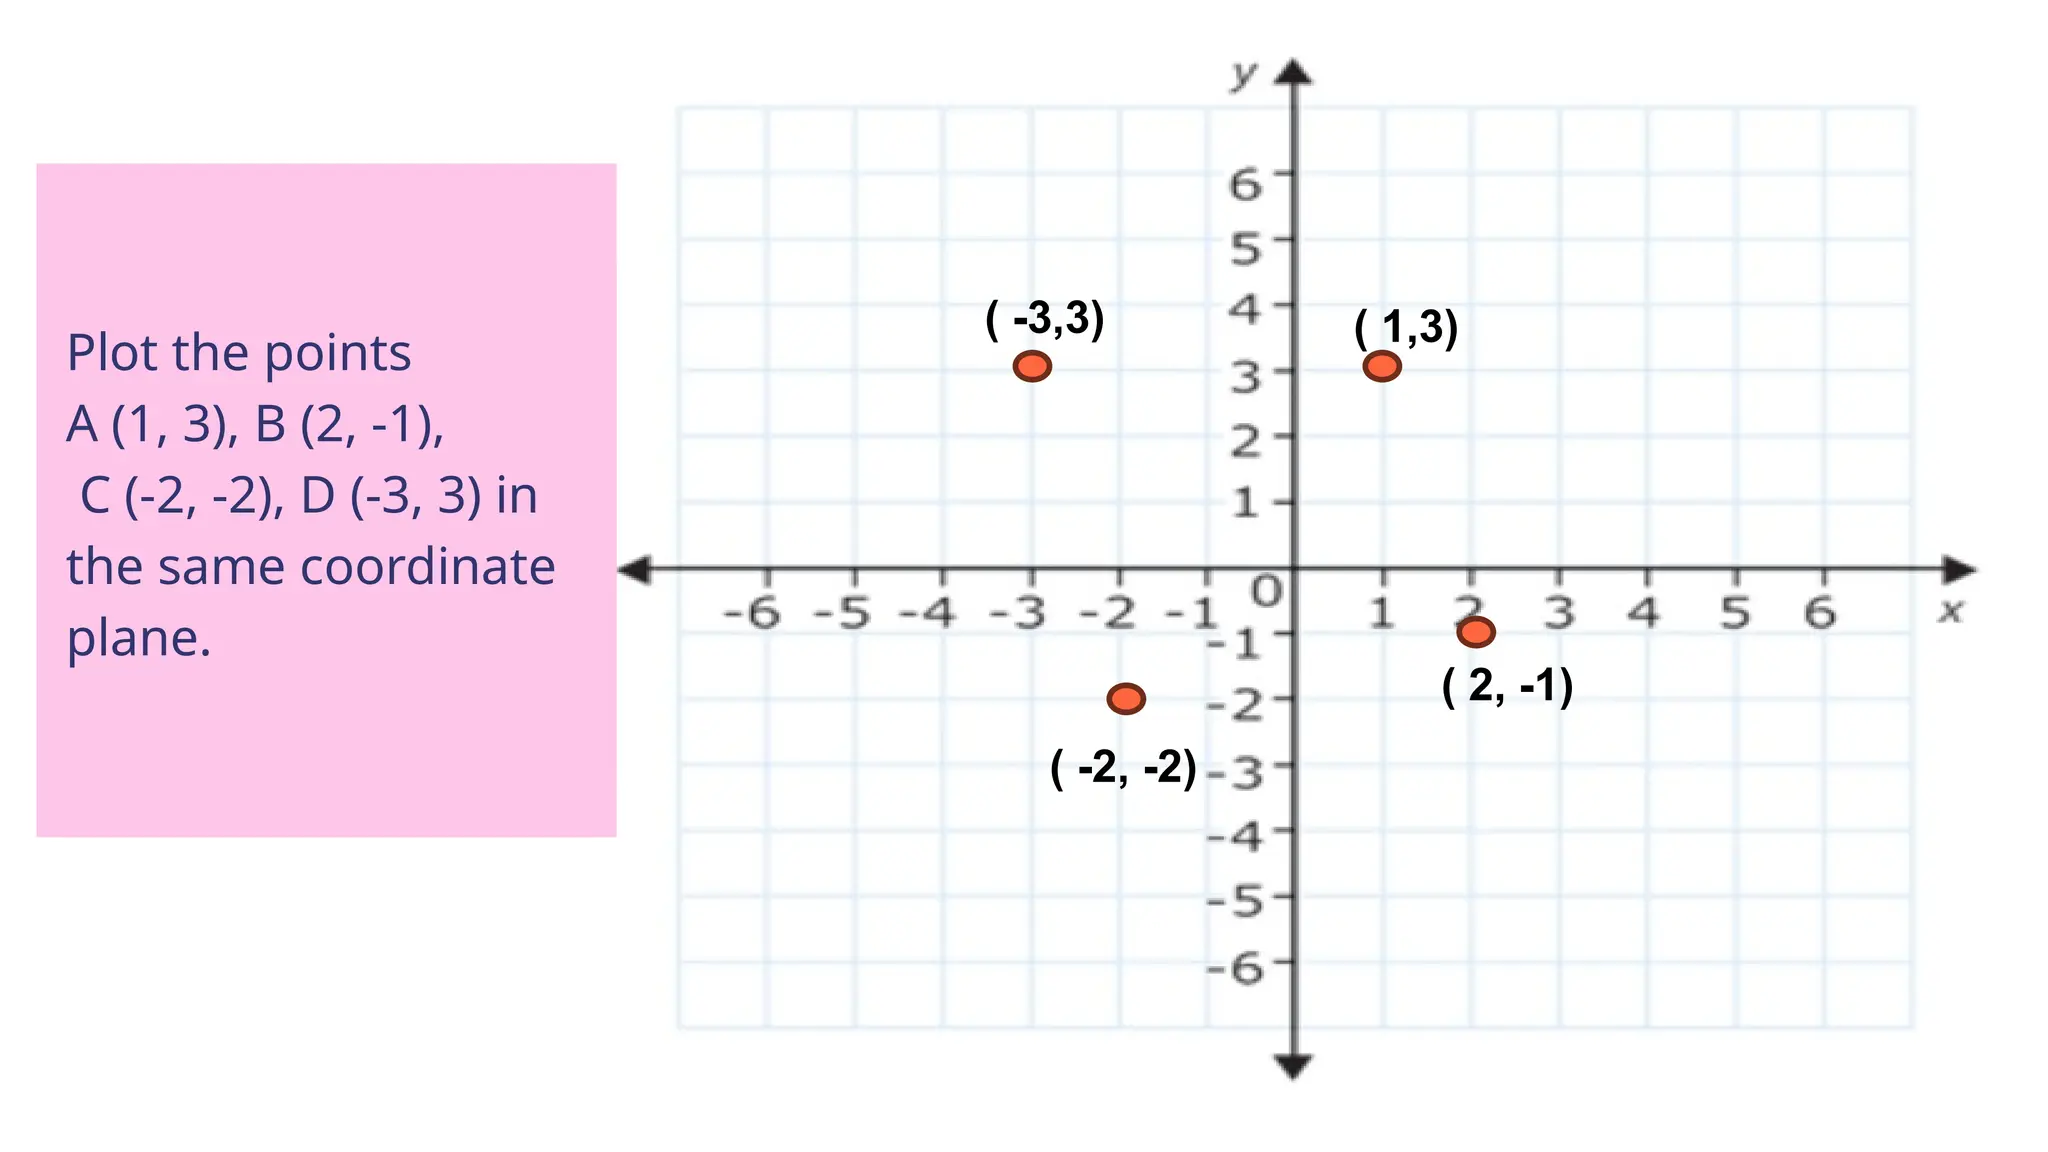
Plot the points
A (1, 3), B (2, -1),
C (-2, -2), D (-3, 3) in
the same coordinate
plane.
( 1,3)
( 2, -1)
( -2, -2)
( -3,3)
4.
A salesman makesa basic salary of 25, 000.00 a month plus a 5%
commission from the total sales for the month. The monthly salary
can be expressed as linear equation
where represents the monthly salary and x represents the total
monthly sales.
5.
Recall that anequation that can be
written in standard form as where
A, B, and C are real numbers such
that A and B are not both equal to
zero, is called a linear equation in
two variables
6.
Here are examplesof linear equations in the
variables x and y:
The equation is also linear in variables and
7.
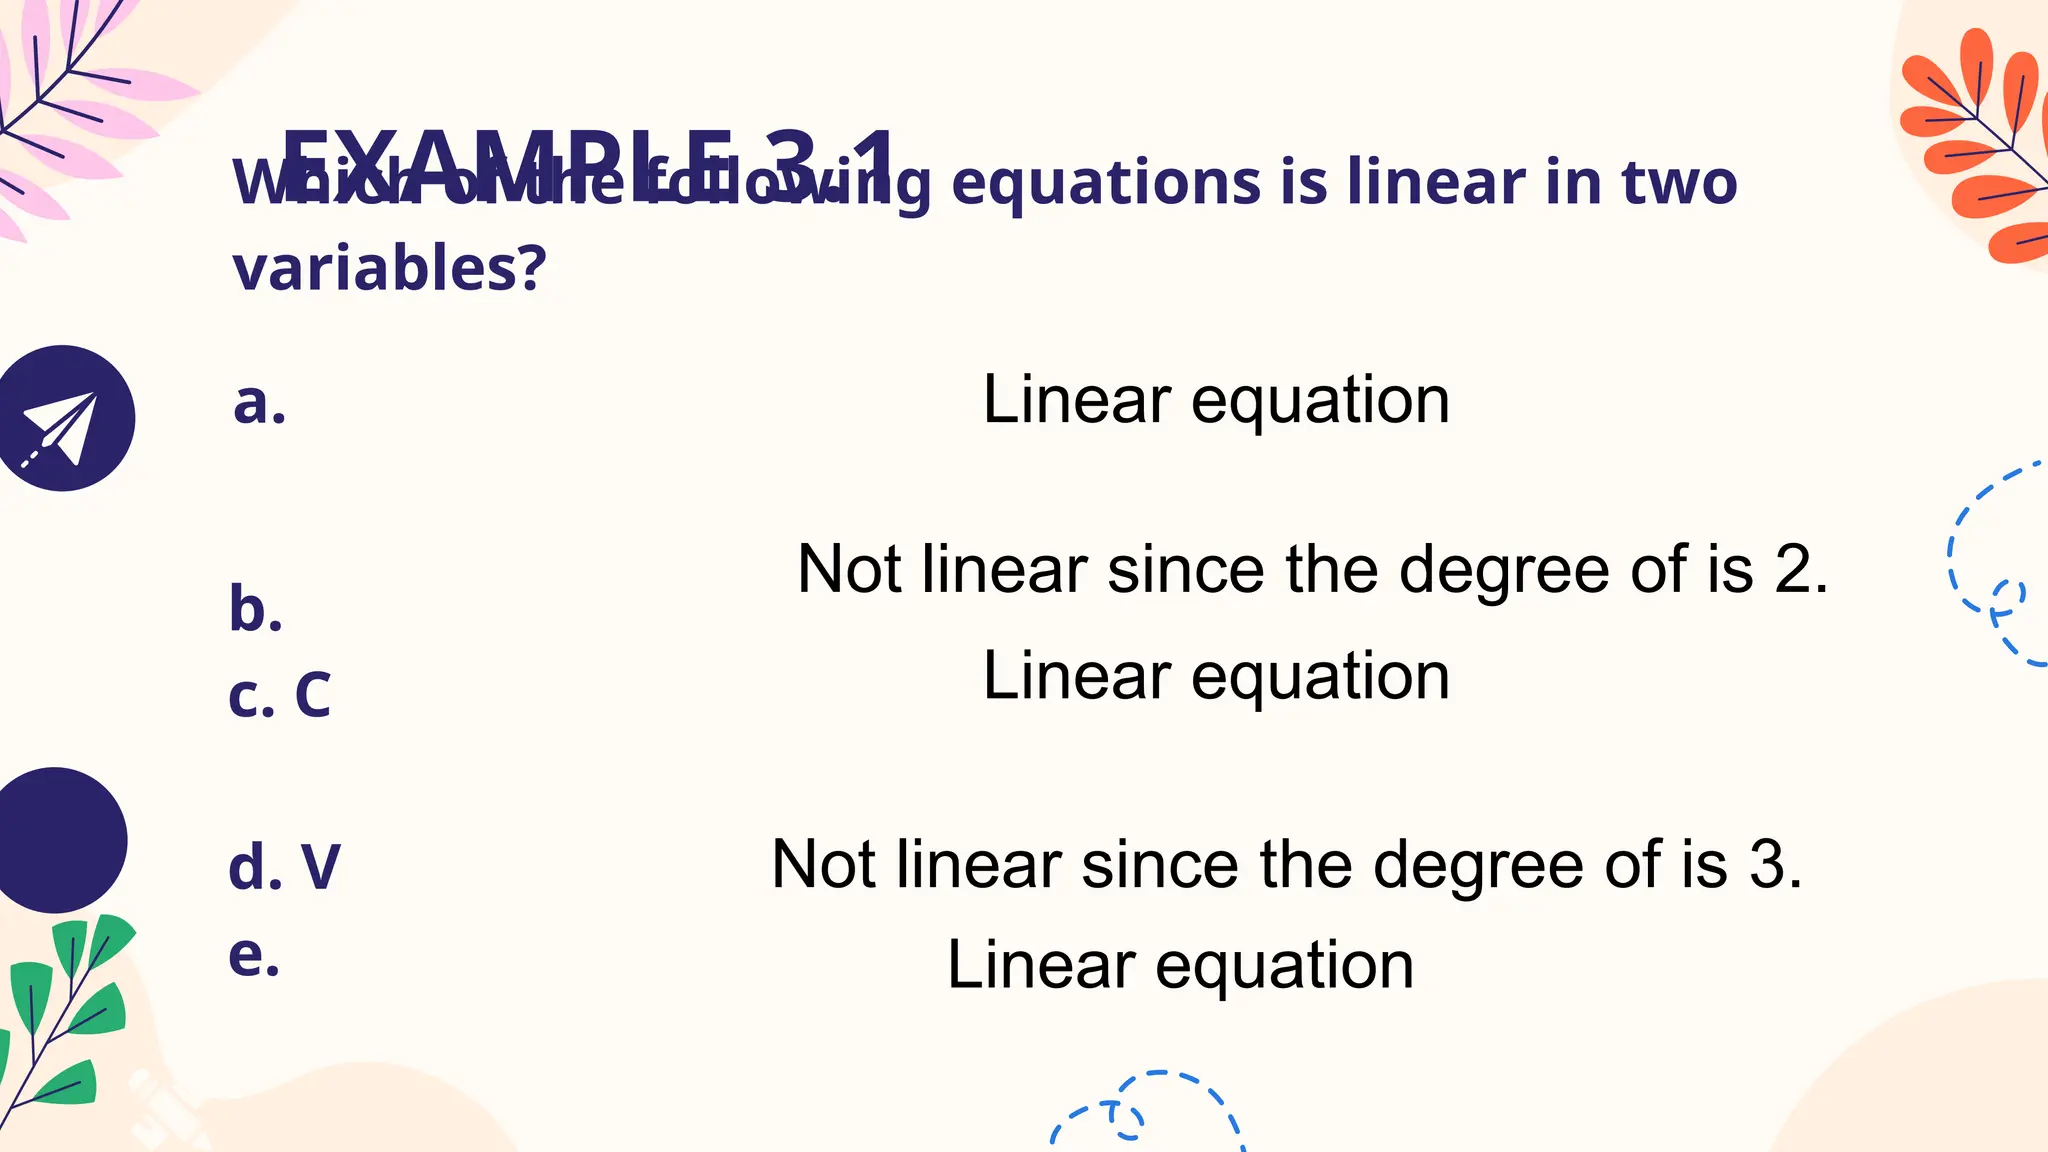
EXAMPLE 3.1
Which ofthe following equations is linear in two
variables?
a.
b.
c. C
d. V
e.
Linear equation
Linear equation
Not linear since the degree of is 2.
Not linear since the degree of is 3.
Linear equation
8.
The Equations and
Theequation is a common equation of a line. It is of
the form This equation is known as the of a line,
where is the slope, and is the intercept.
9.
The equation isanother common equation of a line; it is
in the standard form where A, B, and C are real numbers
such that A and B are not both equal to zero and, as
much as possible, we make
Let us graph the linear equation by transforming it into
10.
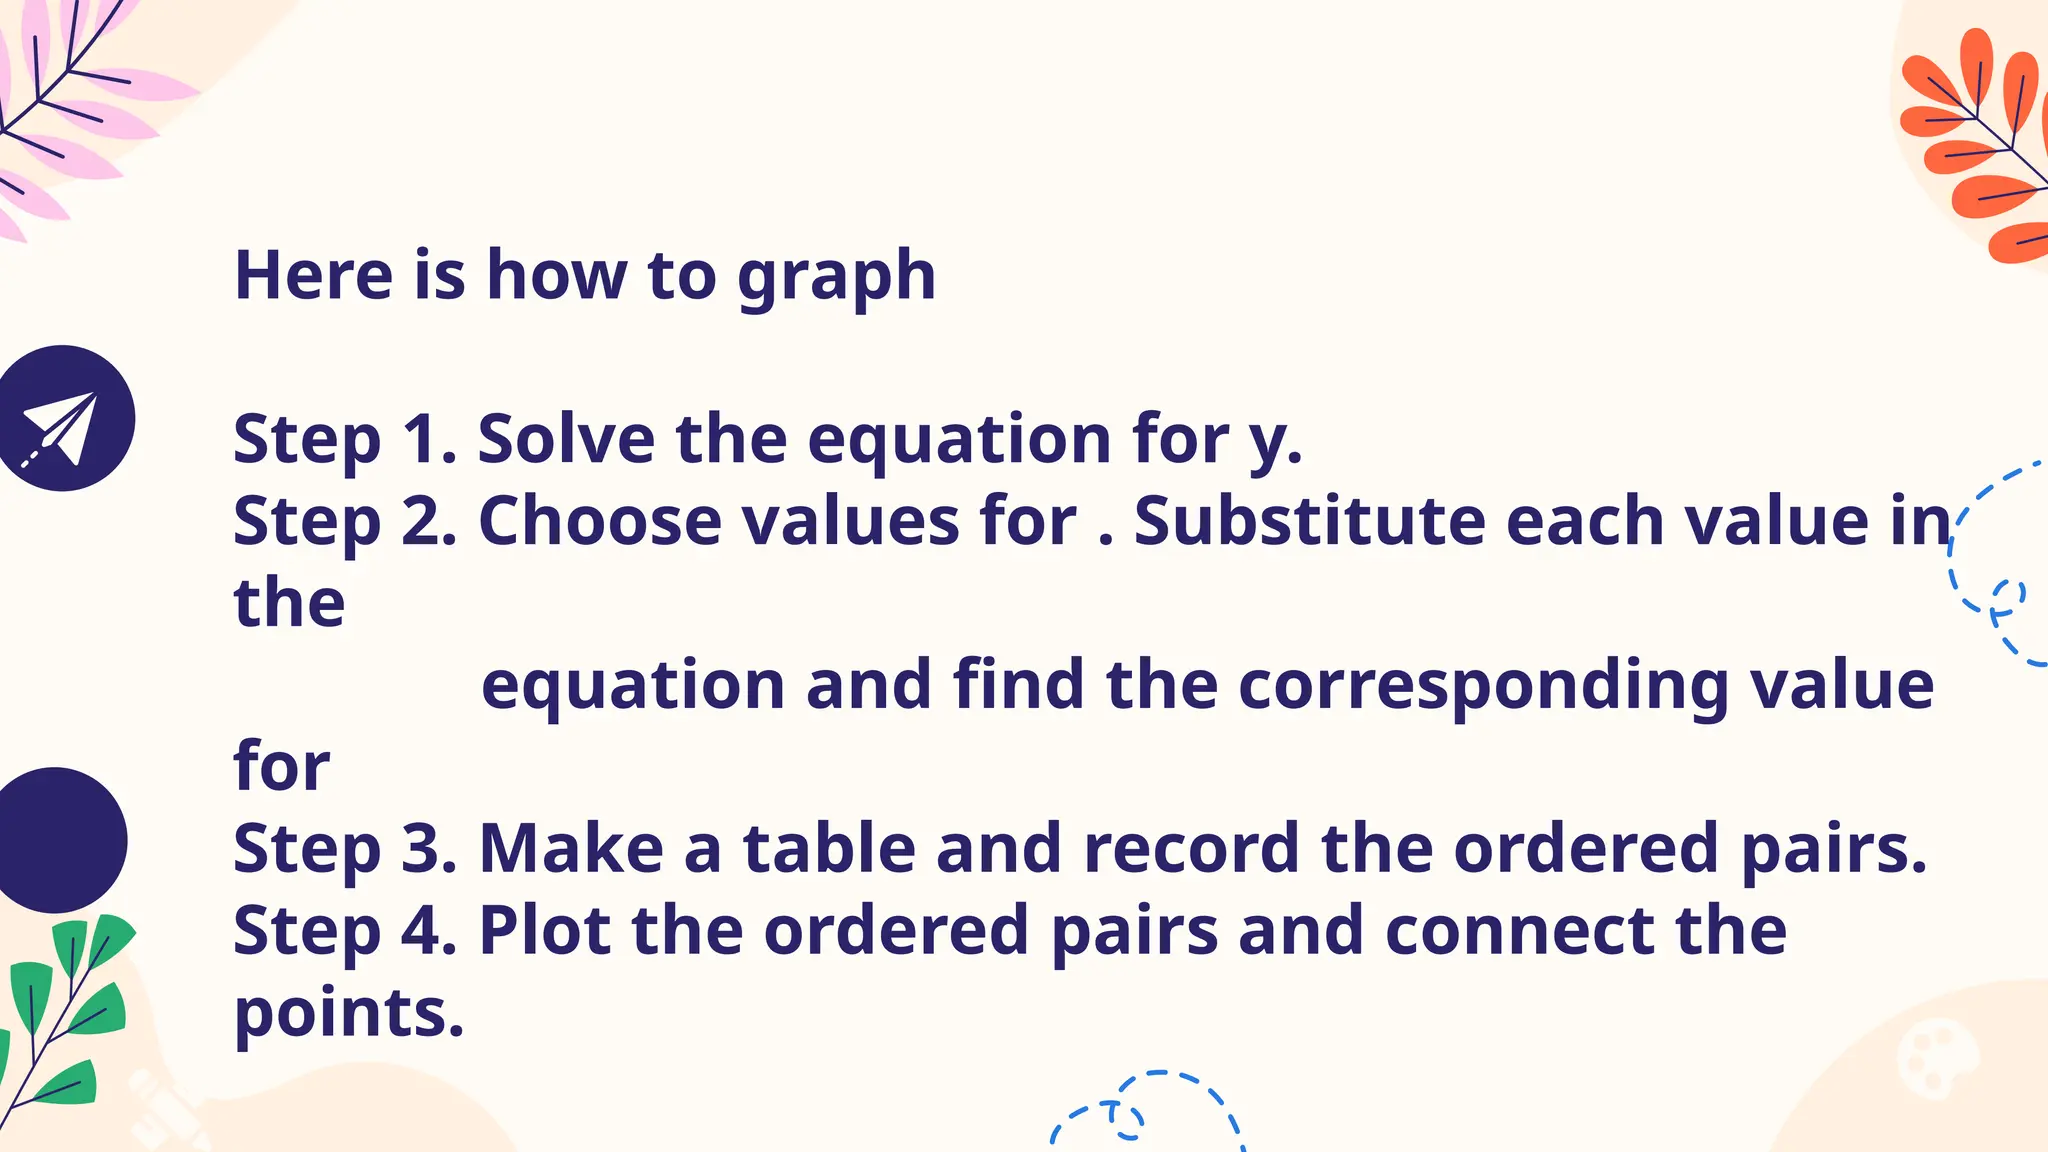
Here is howto graph
Step 1. Solve the equation for y.
Step 2. Choose values for . Substitute each value in
the
equation and find the corresponding value
for
Step 3. Make a table and record the ordered pairs.
Step 4. Plot the ordered pairs and connect the
points.
11.
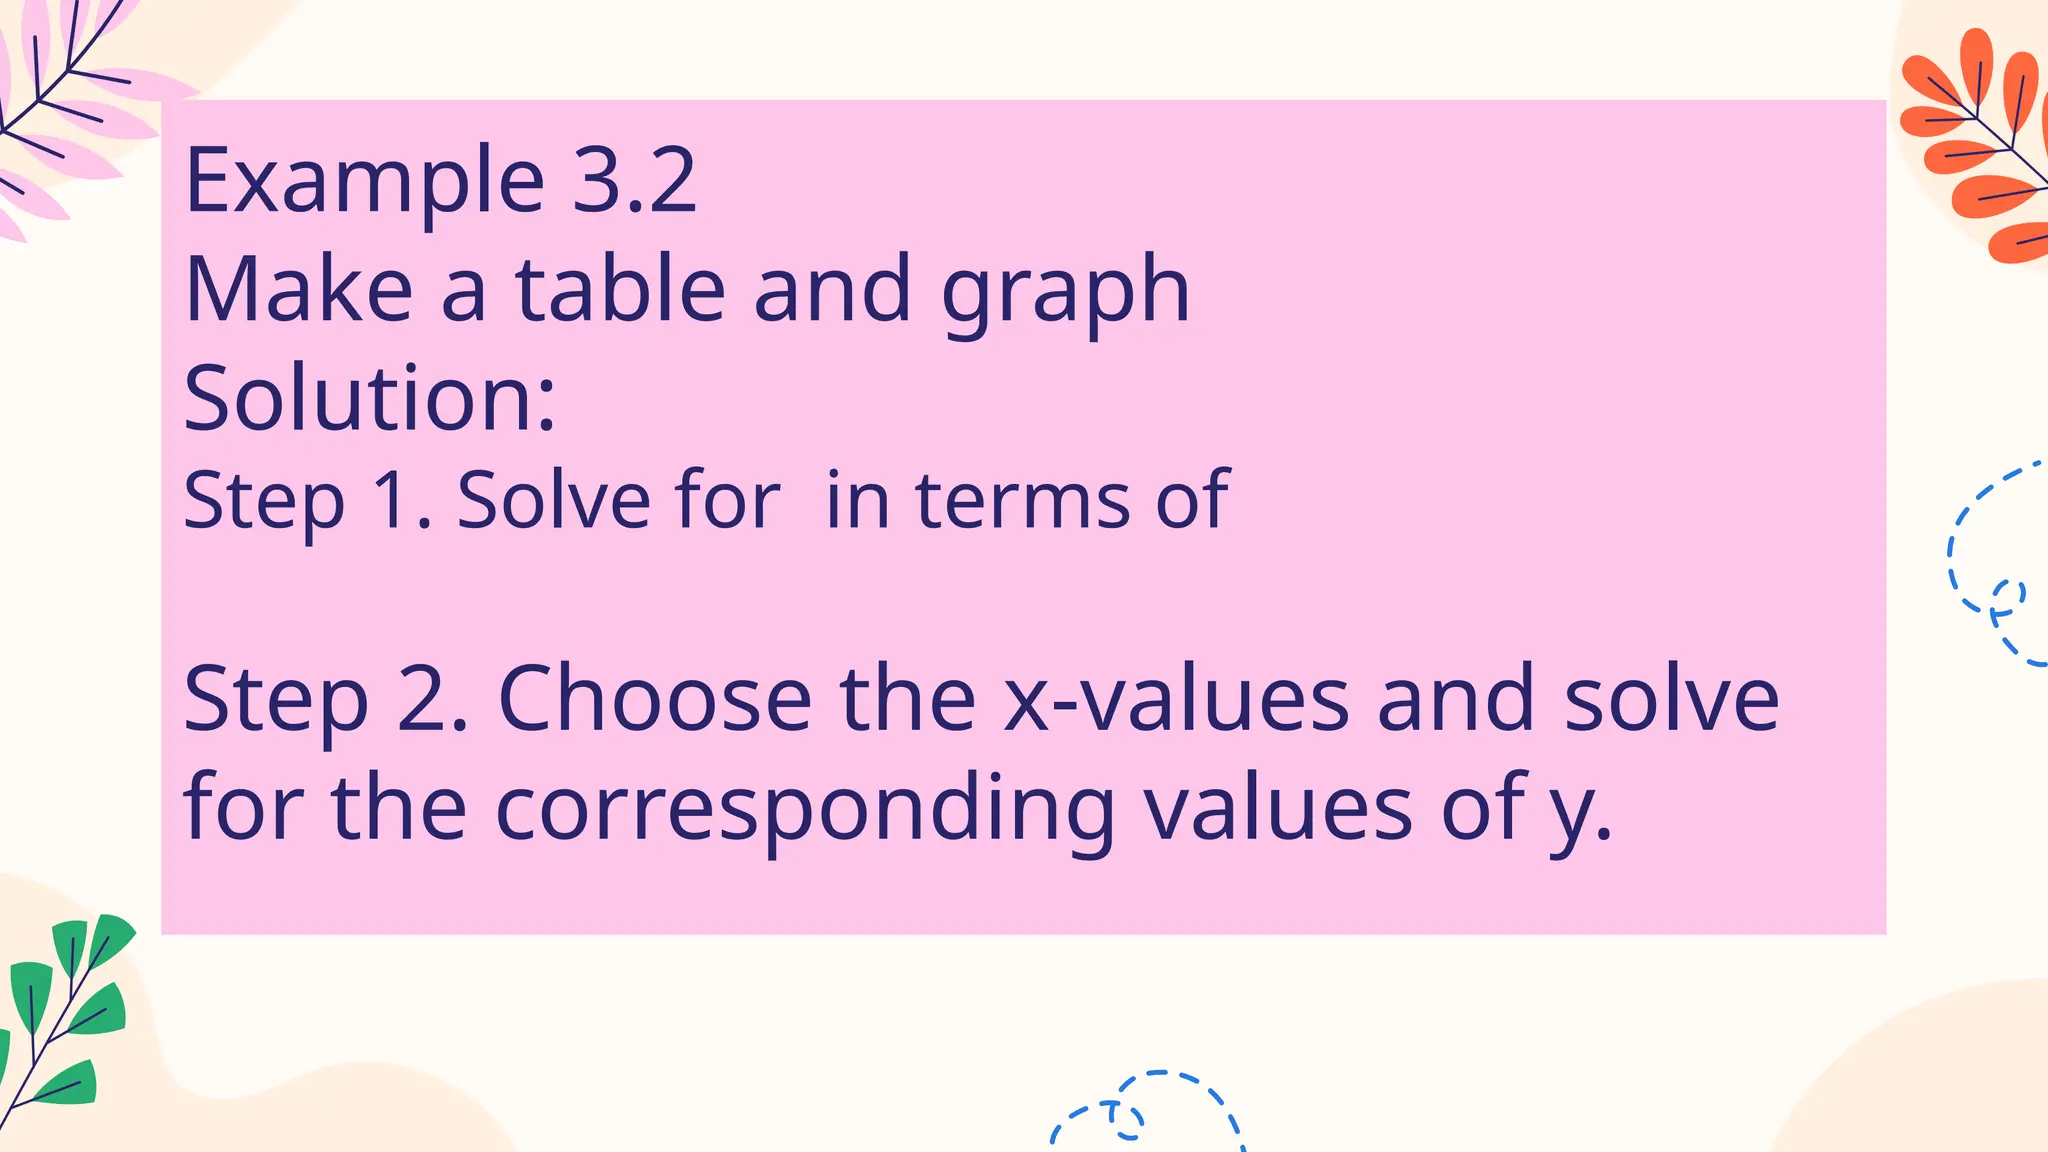
Example 3.2
Make atable and graph
Solution:
Step 1. Solve for in terms of
Step 2. Choose the x-values and solve
for the corresponding values of y.
12.
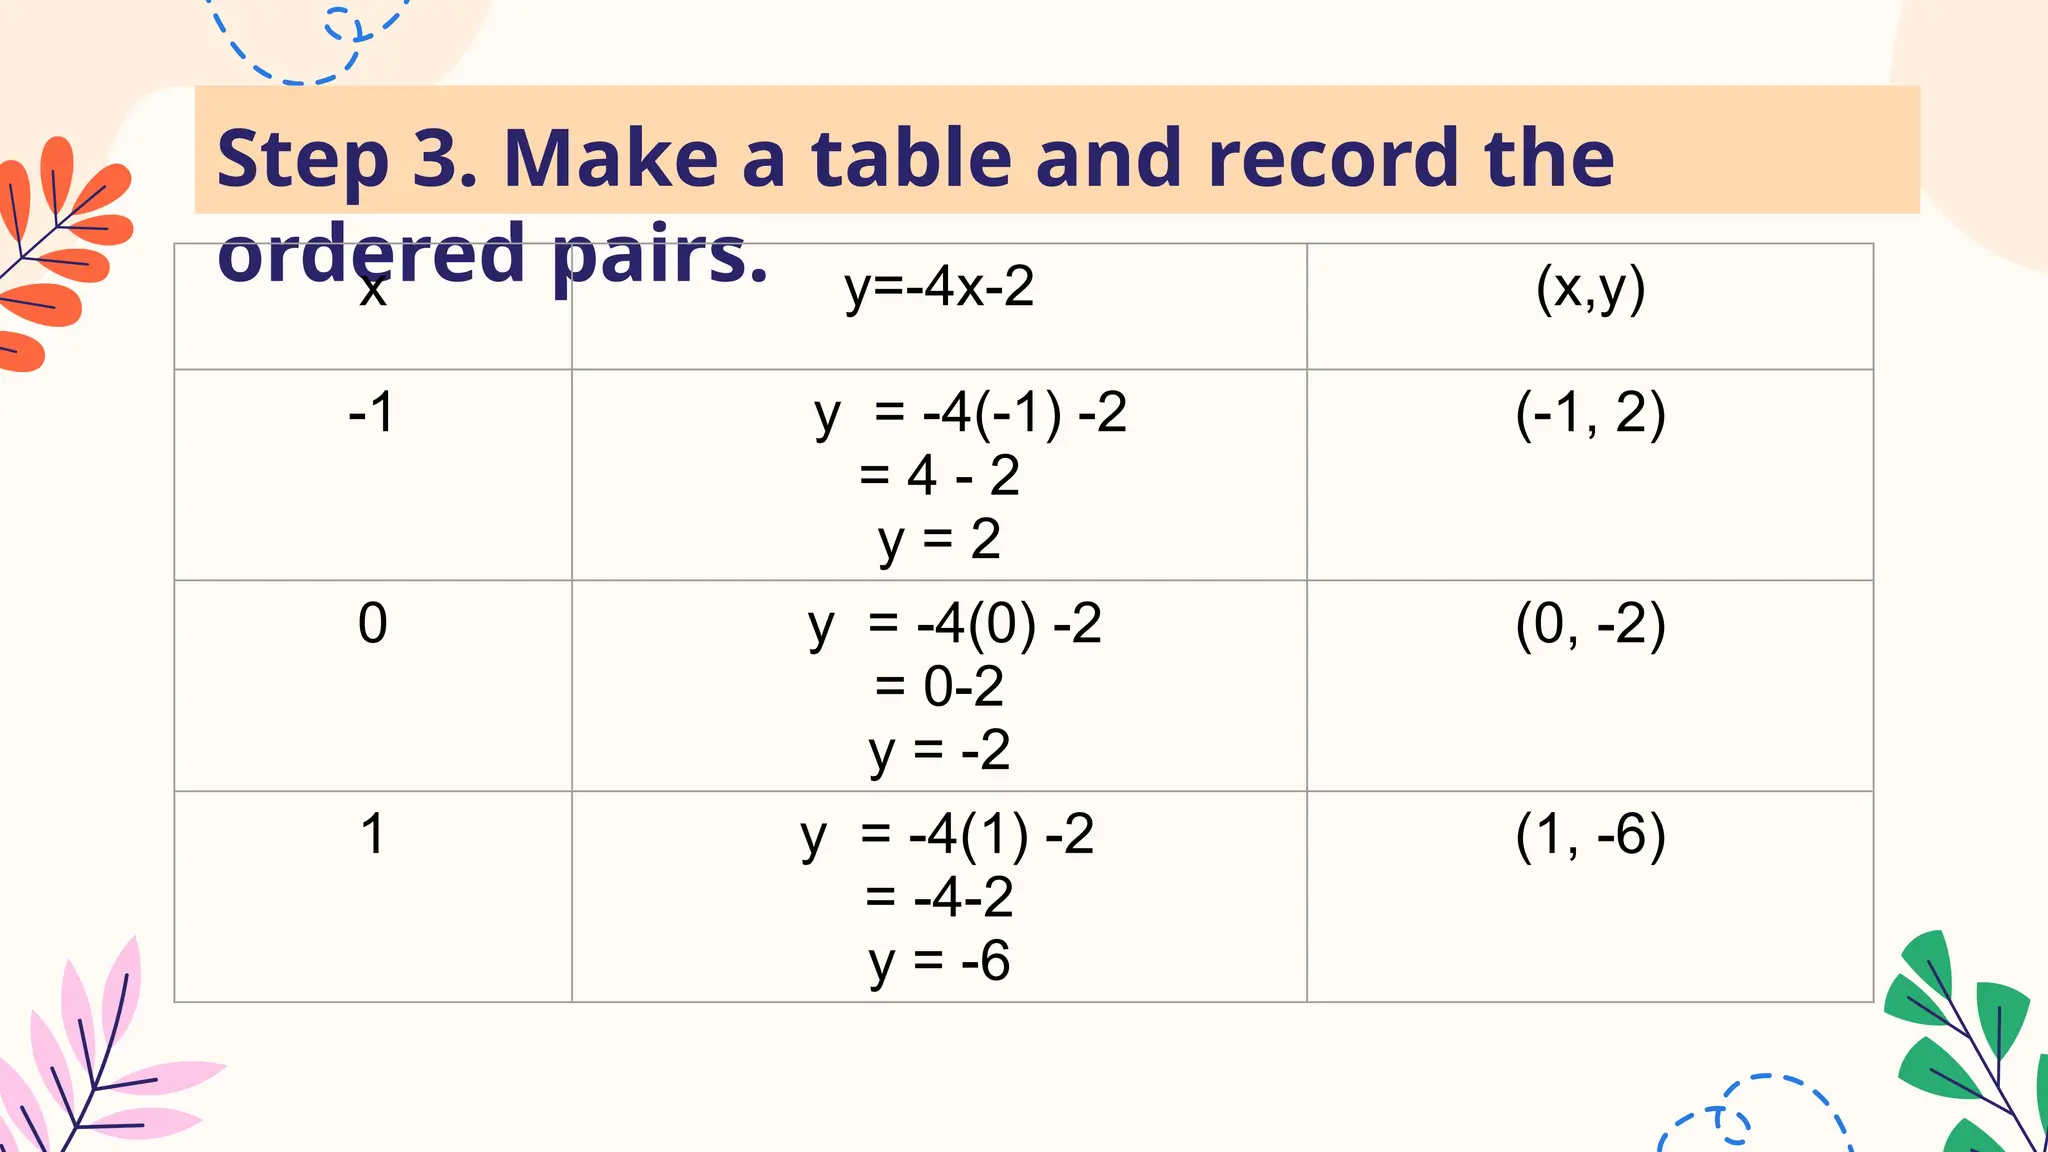
Step 3. Makea table and record the
ordered pairs.
x y=-4x-2 (x,y)
-1 y = -4(-1) -2
= 4 - 2
y = 2
(-1, 2)
0 y = -4(0) -2
= 0-2
y = -2
(0, -2)
1 y = -4(1) -2
= -4-2
y = -6
(1, -6)
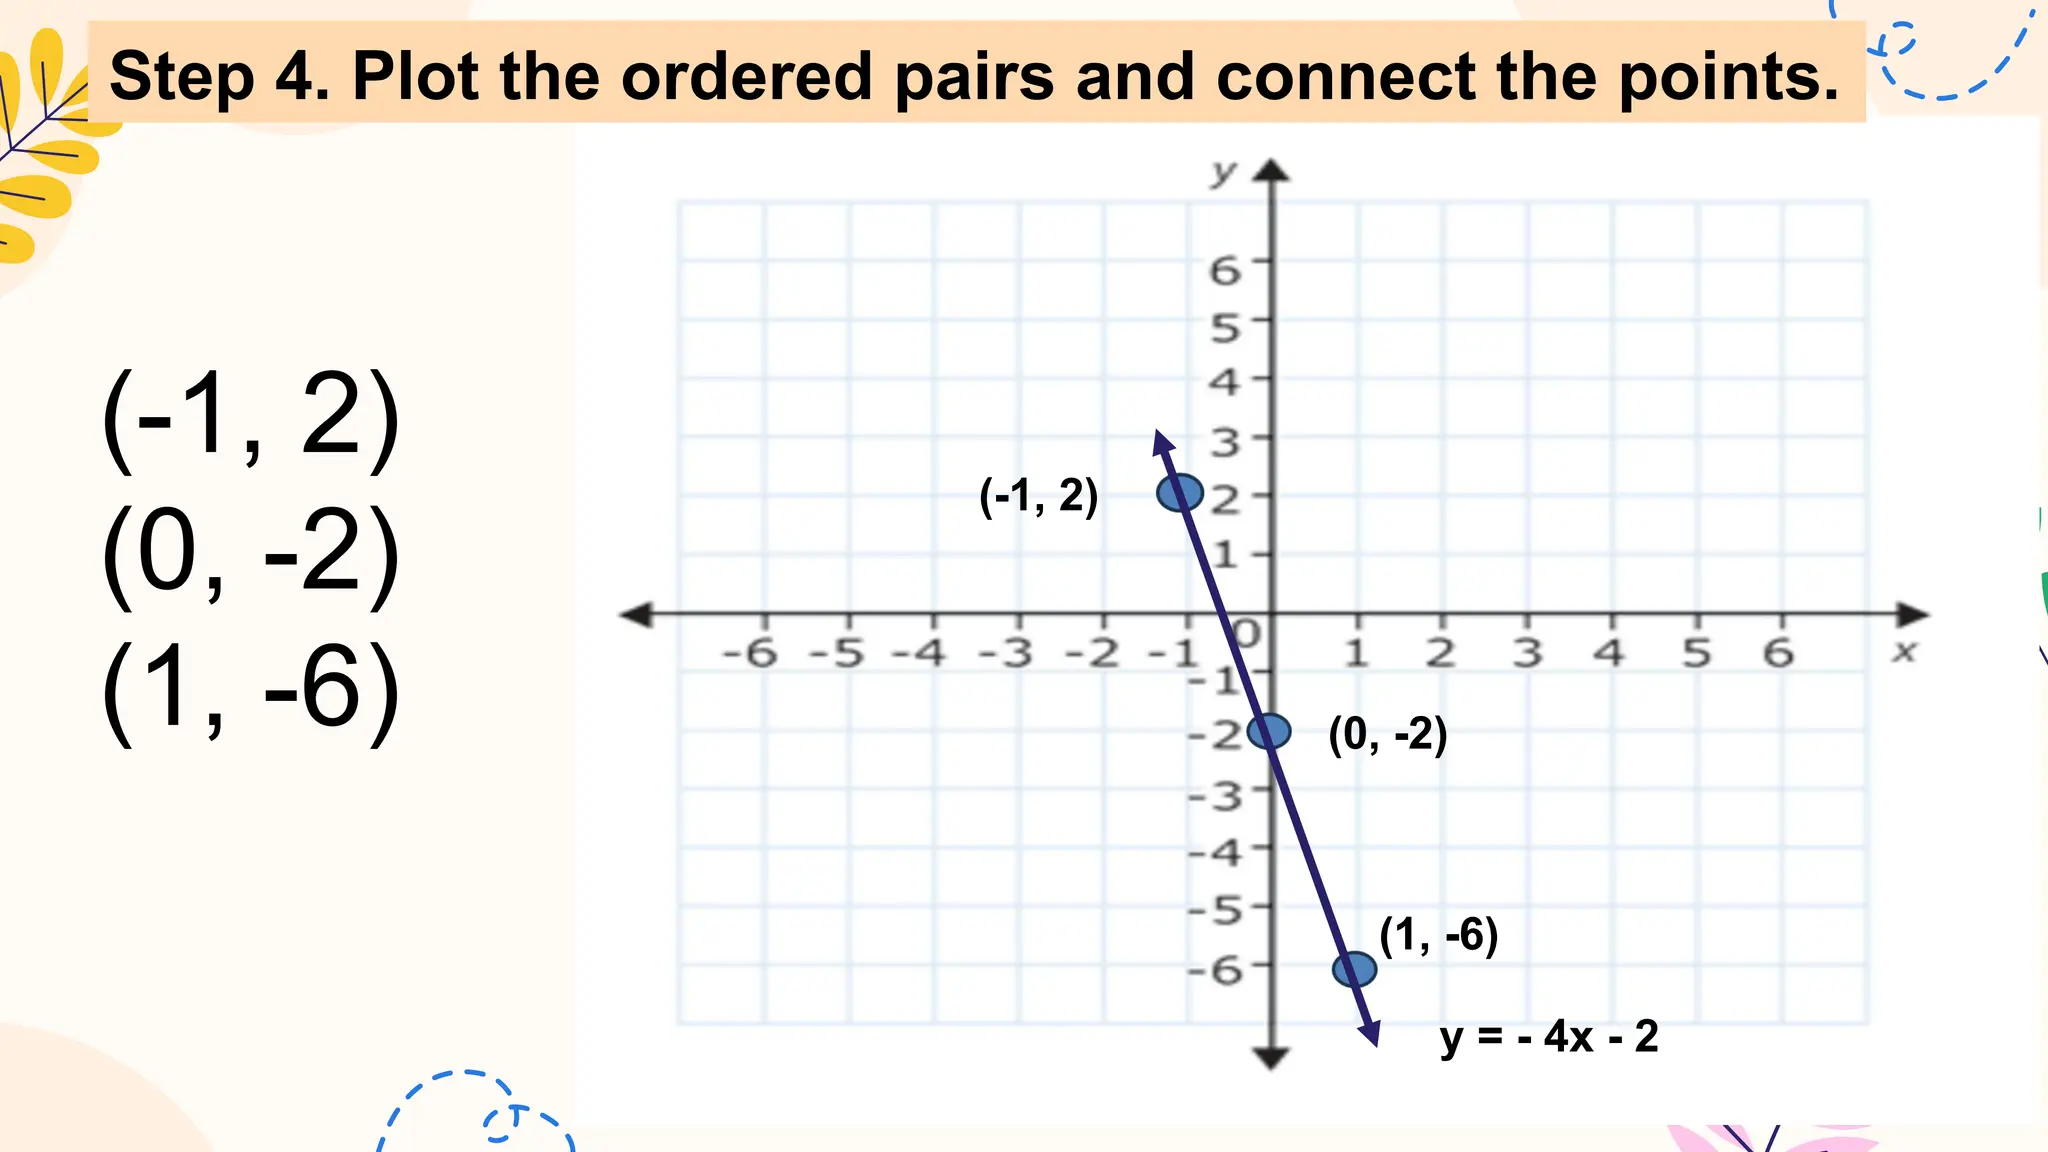
13.
(-1, 2)
(0, -2)
(1,-6)
(-1, 2)
(0, -2)
(1, -6)
y = - 4x - 2
Step 4. Plot the ordered pairs and connect the points.
14.
Example 3.3
Make atable and graph
Solution:
Step 1. Solve for in terms of
So, , and .
15.
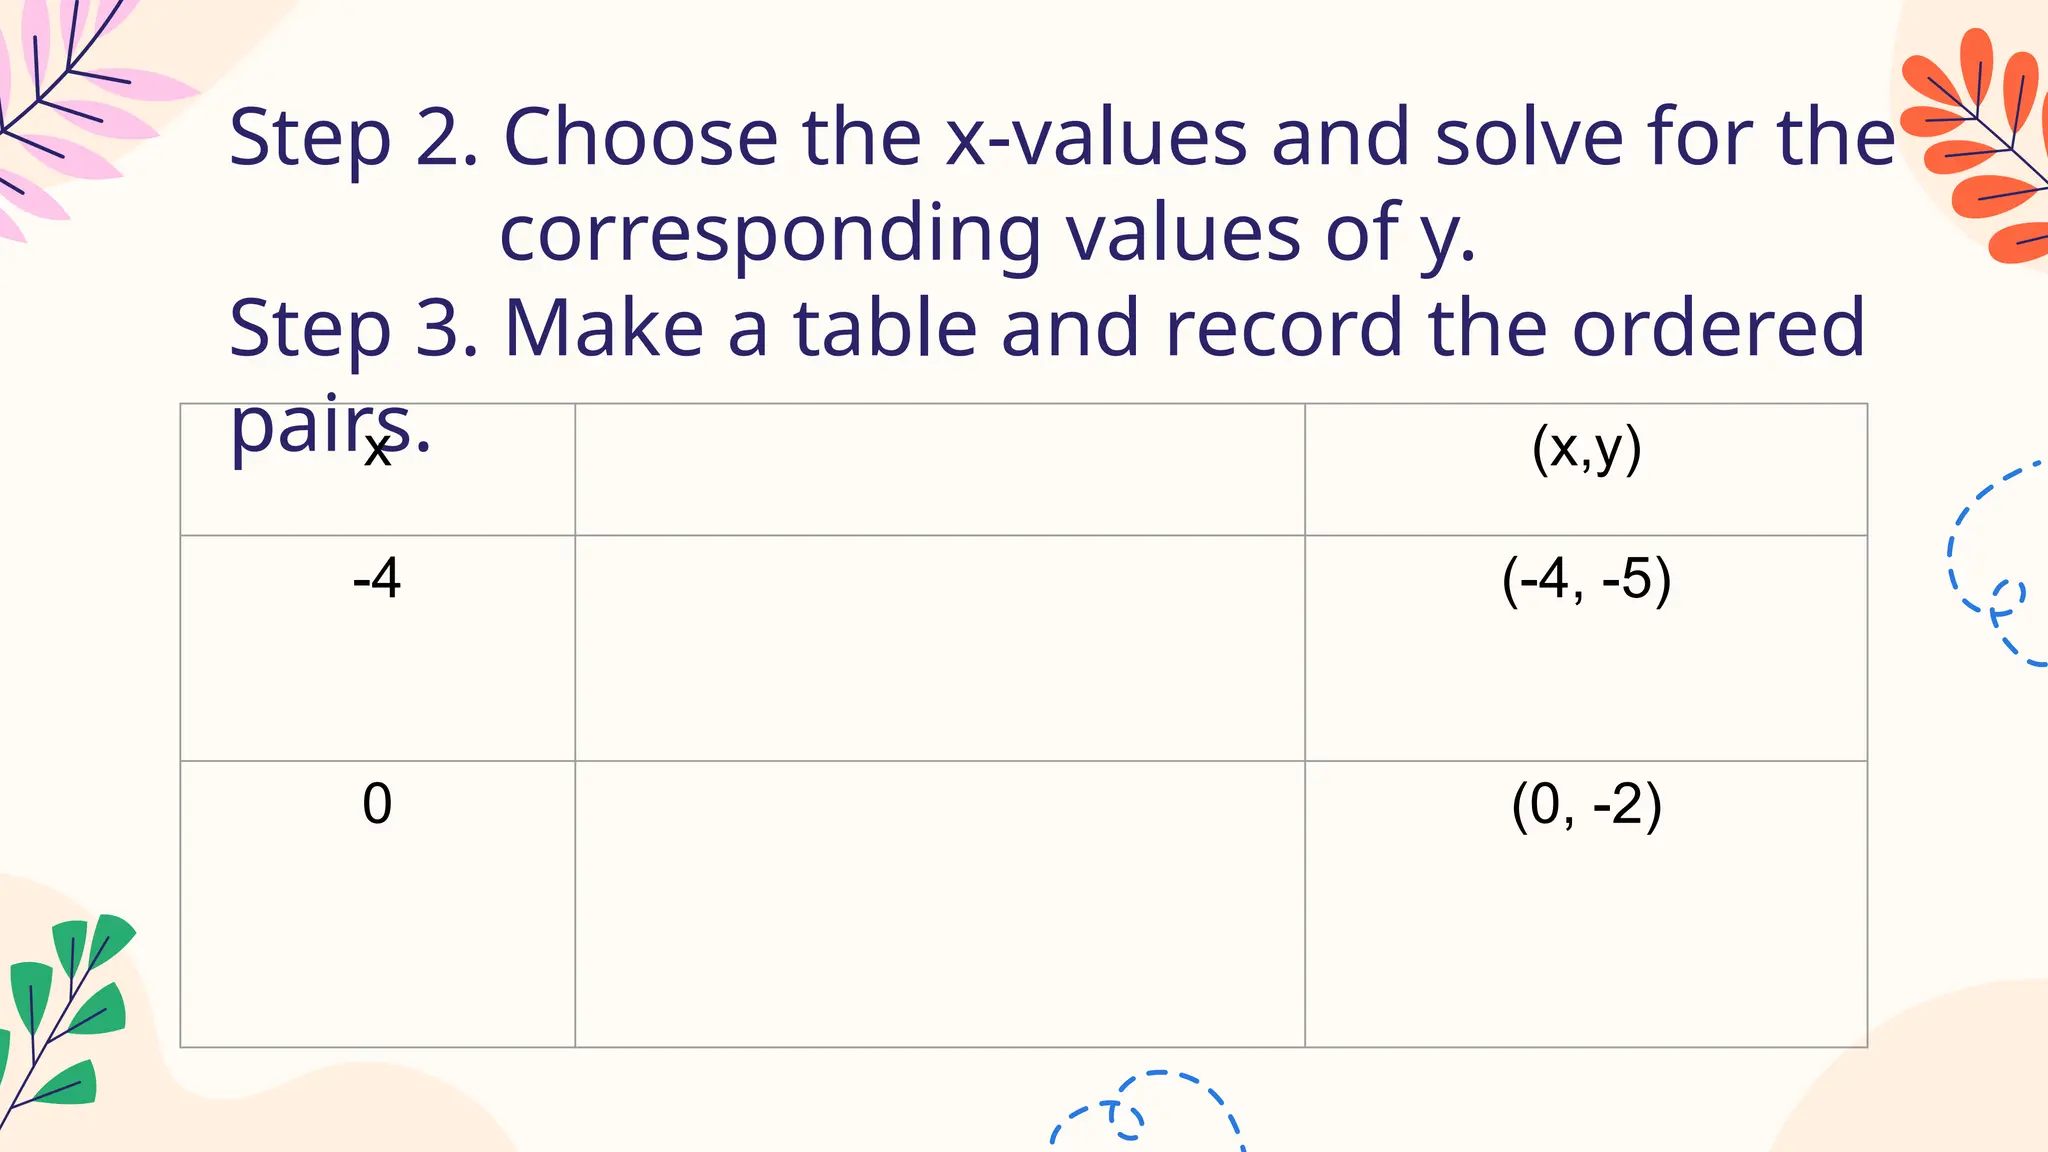
Step 2. Choosethe x-values and solve for the
corresponding values of y.
Step 3. Make a table and record the ordered
pairs.
x (x,y)
-4 (-4, -5)
0 (0, -2)
16.
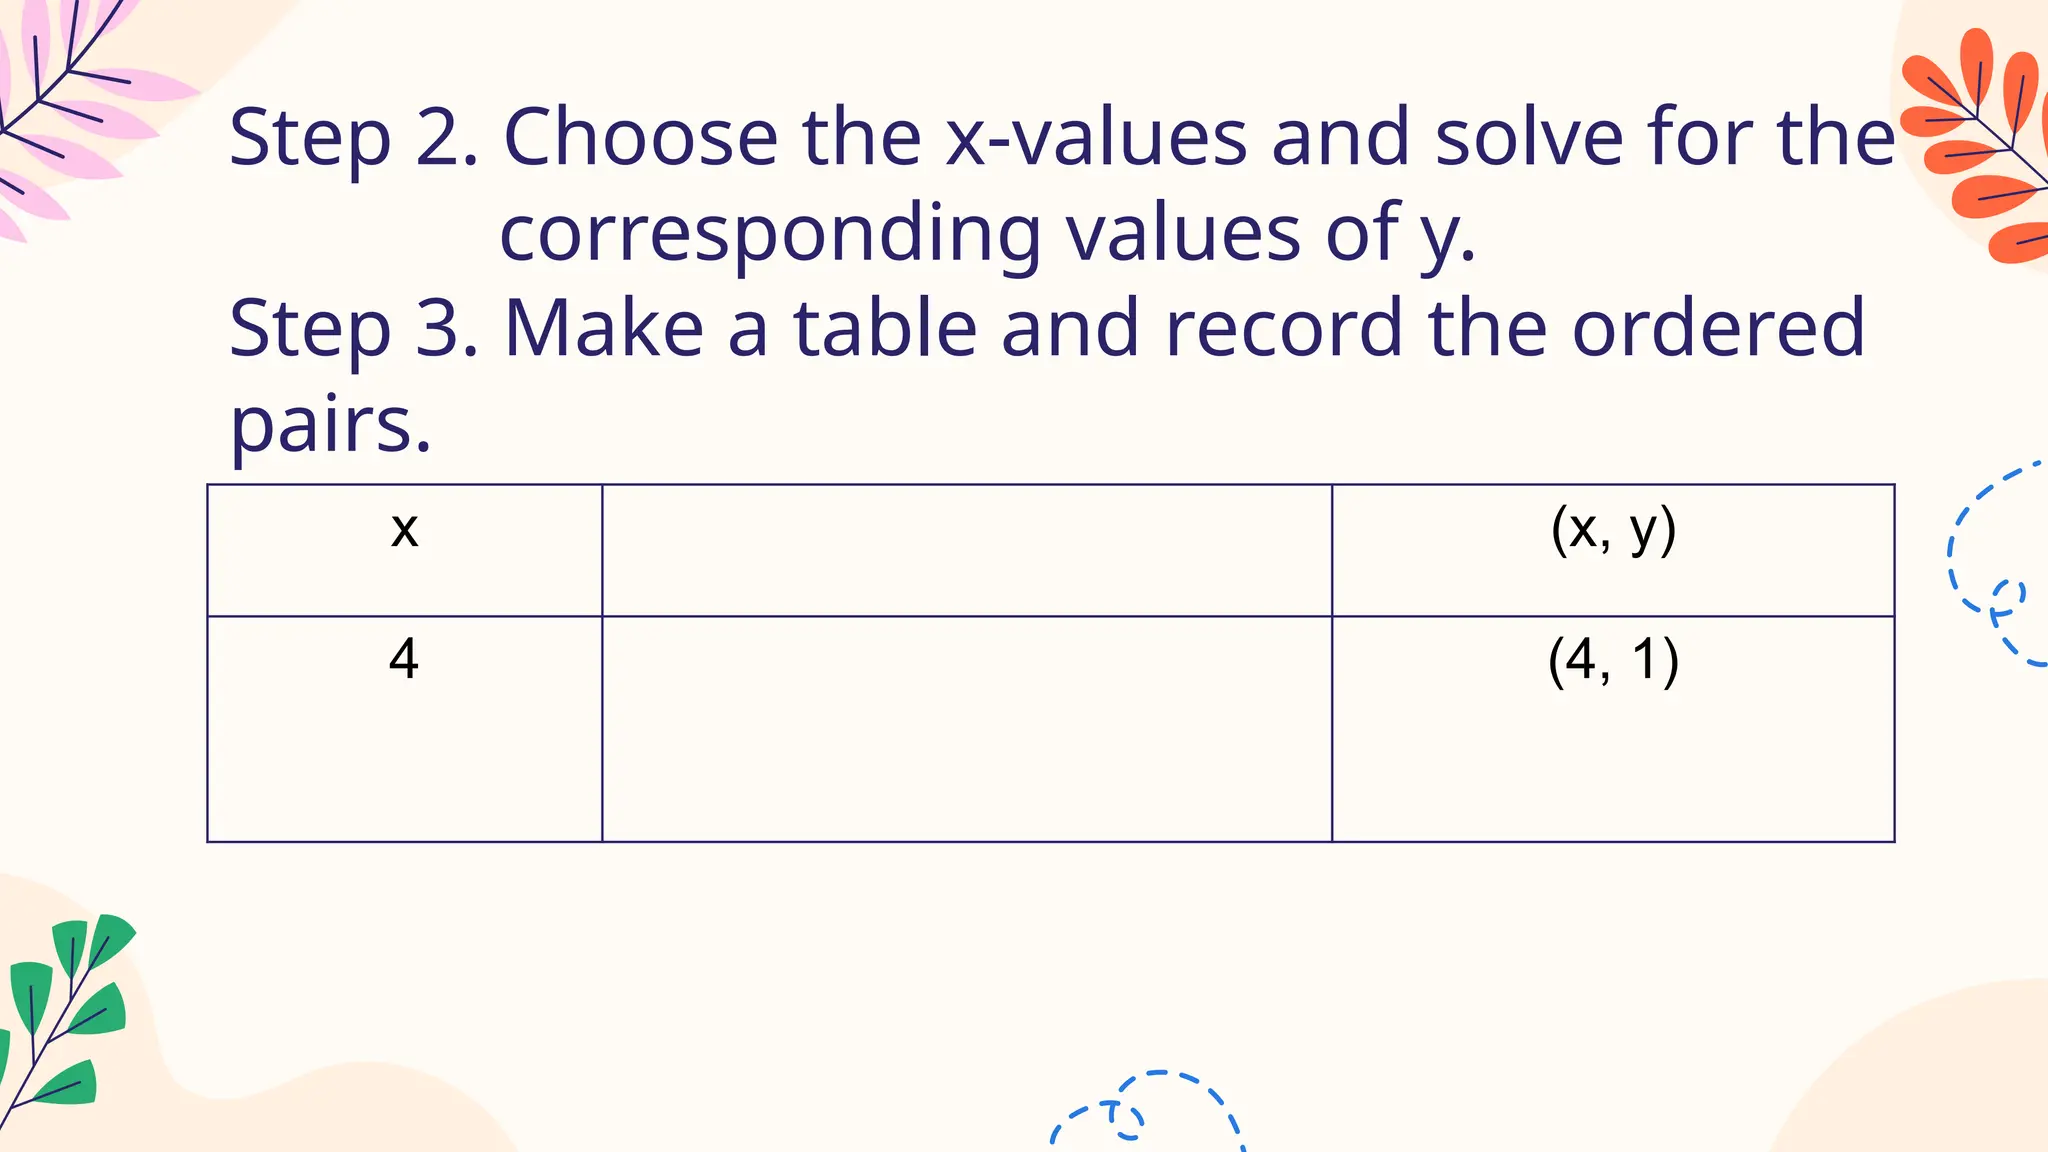
Step 2. Choosethe x-values and solve for the
corresponding values of y.
Step 3. Make a table and record the ordered
pairs.
x (x, y)
4 (4, 1)
17.
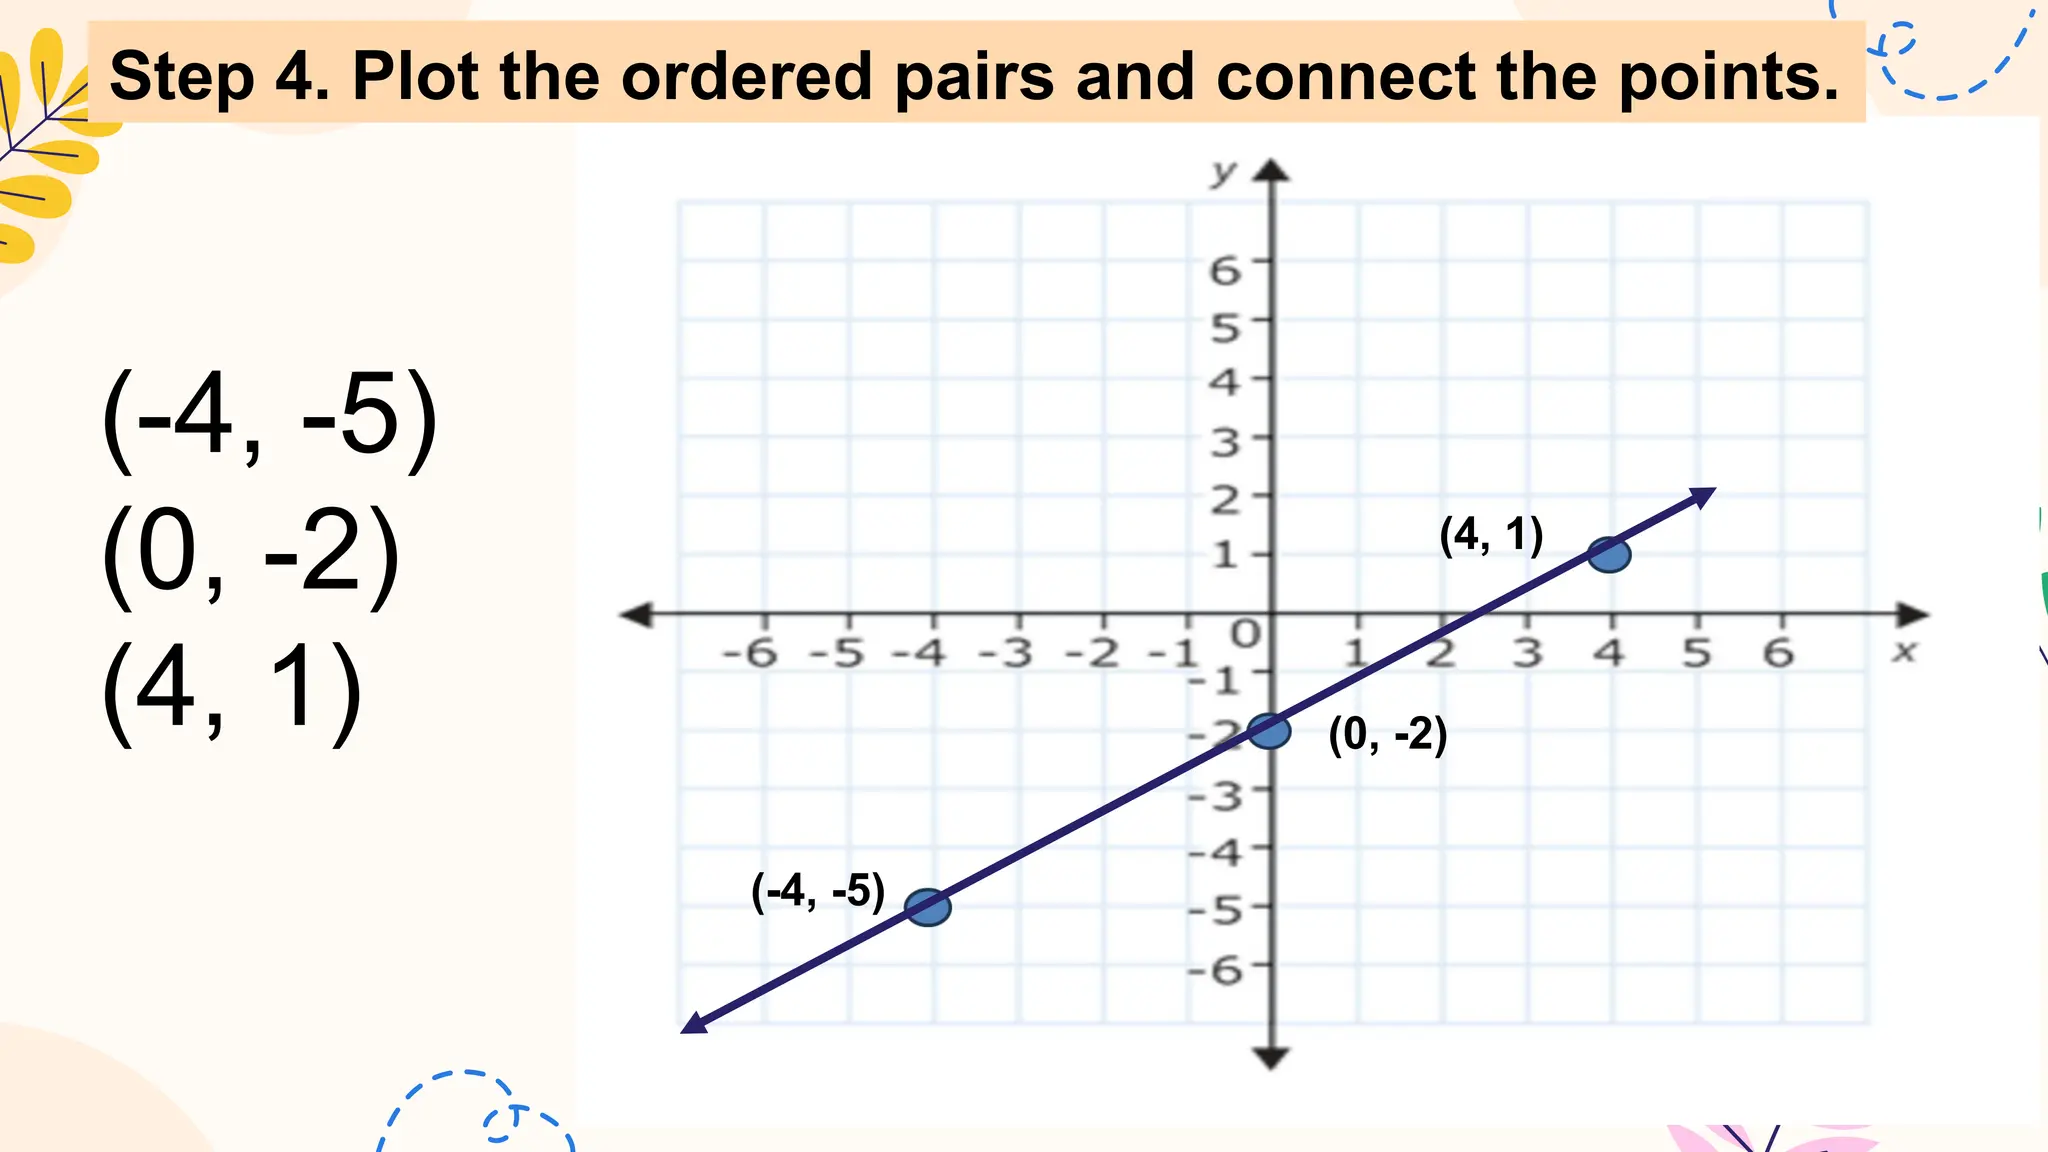
(-4, -5)
(0, -2)
(4,1)
(-4, -5)
(0, -2)
(4, 1)
Step 4. Plot the ordered pairs and connect the points.
18.
When we graphthe slope-intercept form , we may do
away with the use of the coordinate of two points.
Rather, we use the values of and in the equation.
Here is how to graph linear equation using slope-
intercept form.
19.
Step 1. Writethe equation in the form .
Step 2. Plot the intercept at (0, b).
Step 3. From the intercept , plot another point
using
the slope .
Step 4. Draw the line through the two points.
Step 5. Use a third point check.
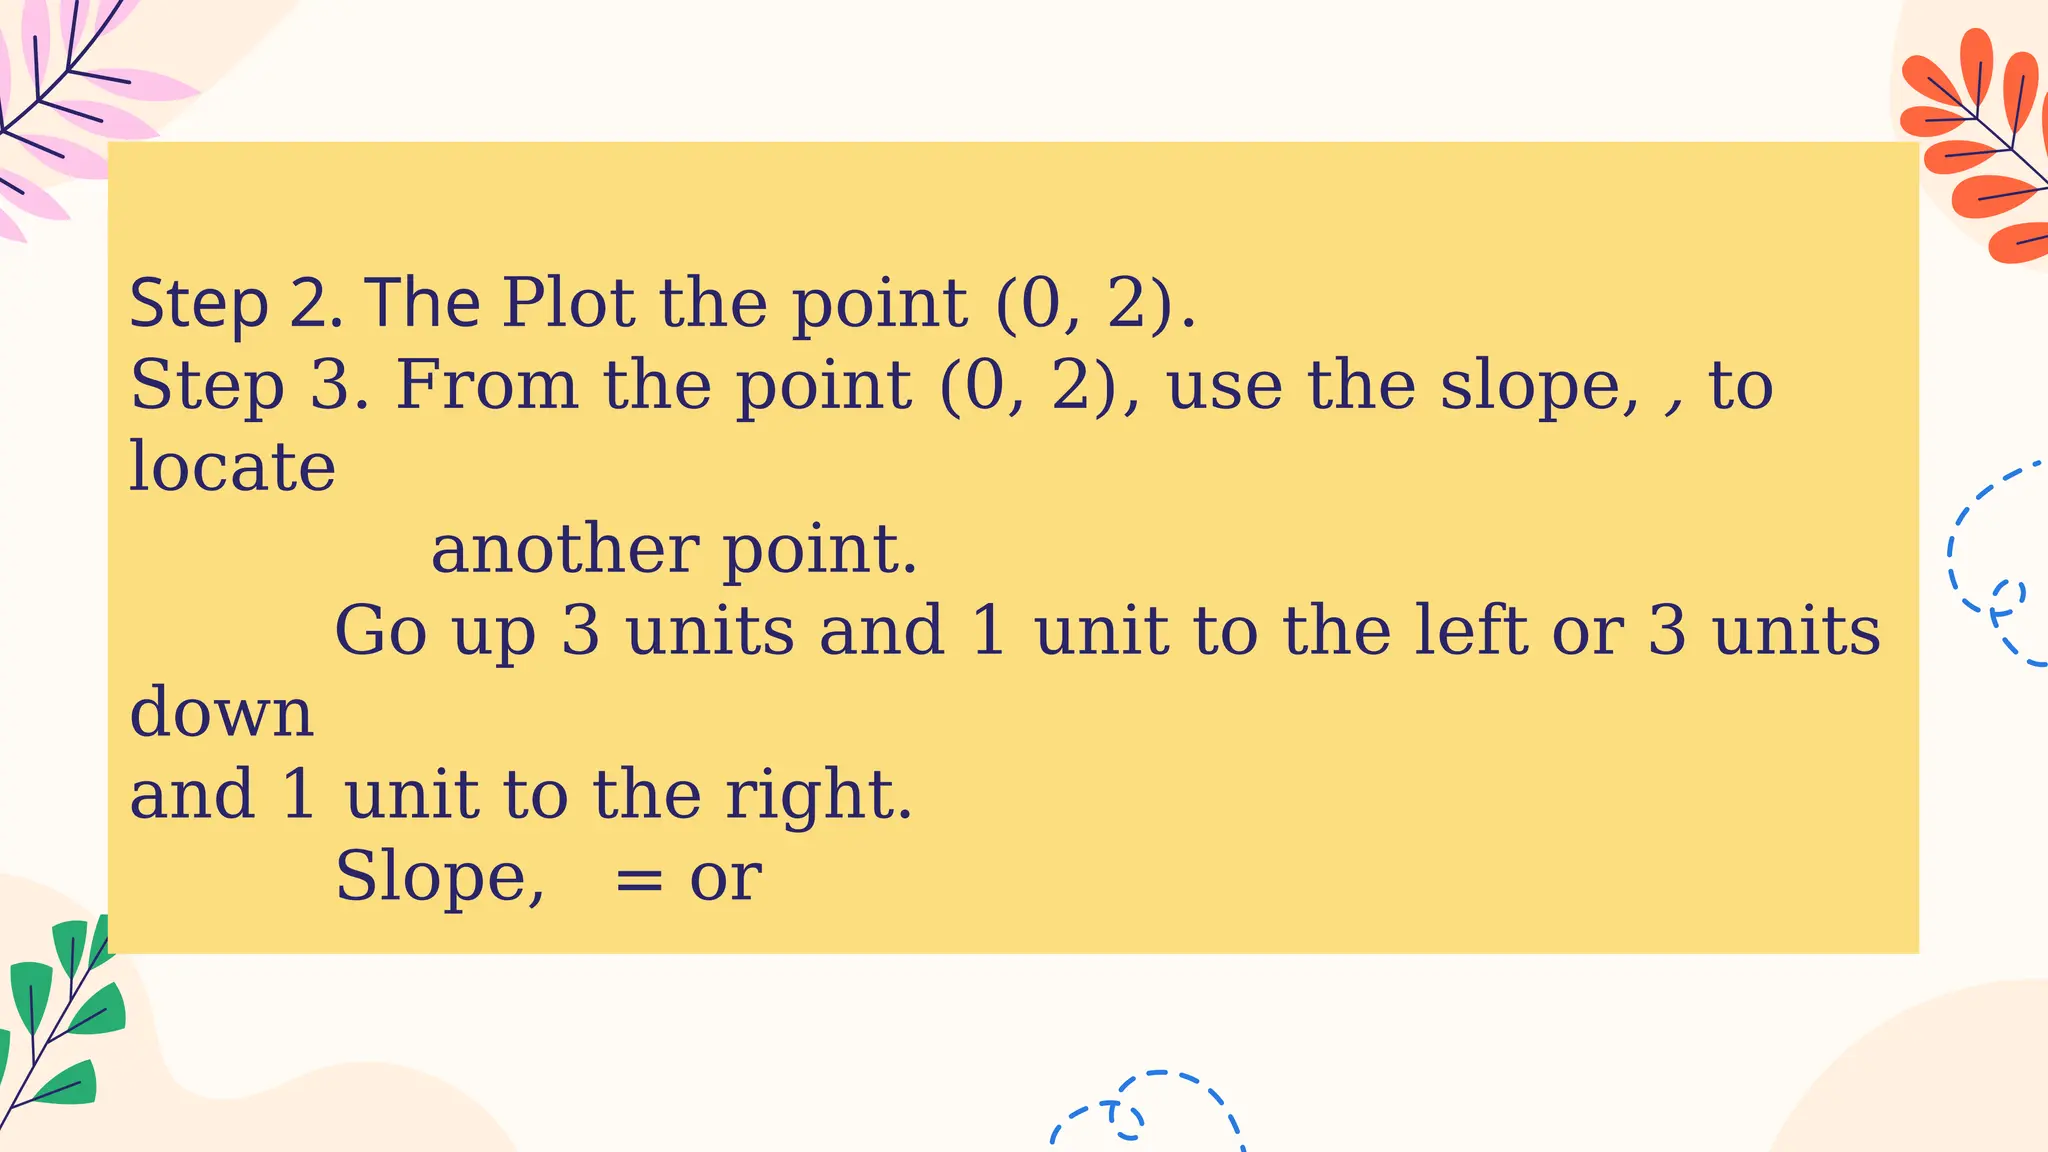
Step 2. ThePlot the point (0, 2).
Step 3. From the point (0, 2), use the slope, , to
locate
another point.
Go up 3 units and 1 unit to the left or 3 units
down
and 1 unit to the right.
Slope, = or
22.
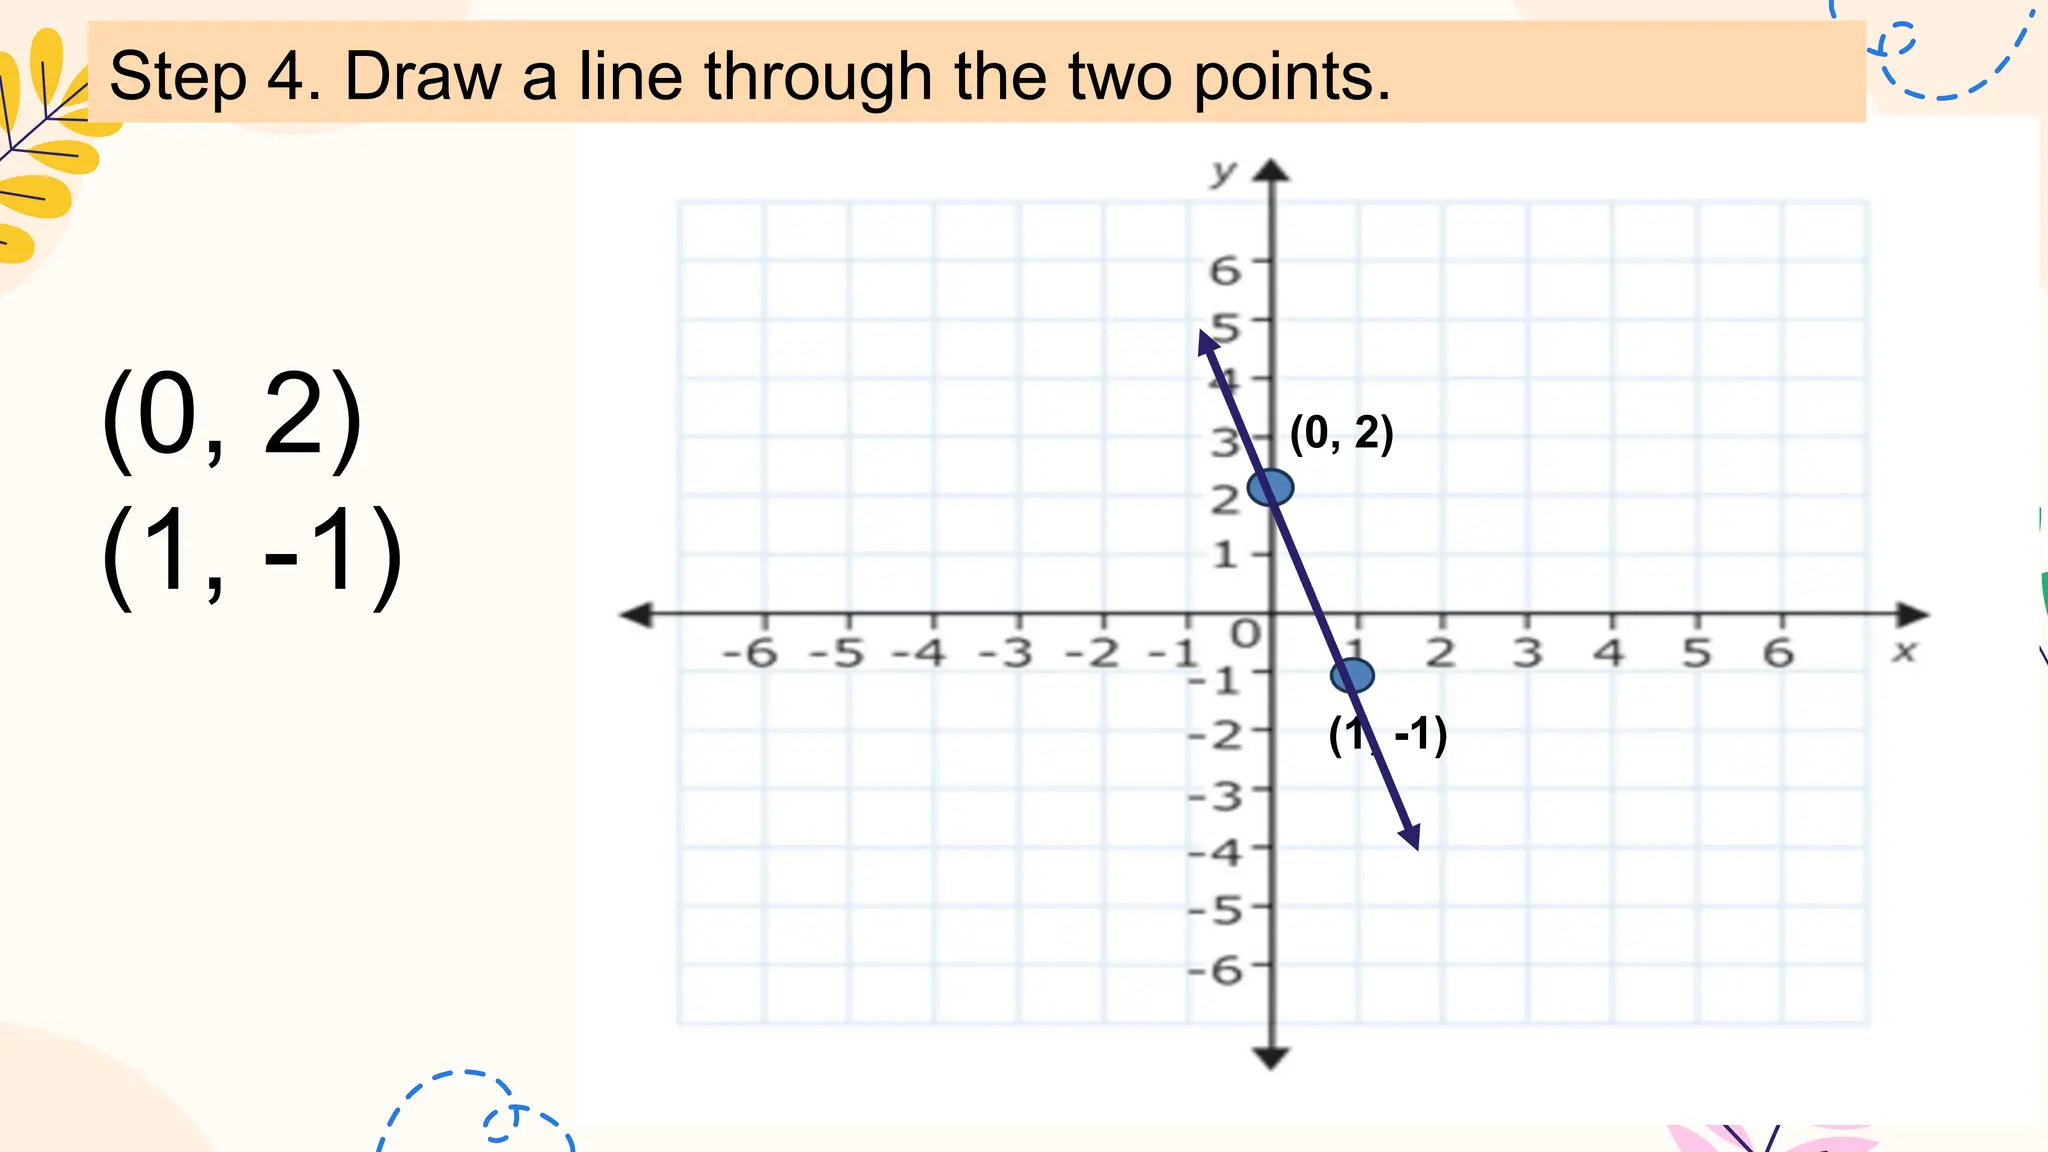
(0, 2)
(1, -1)
(0,2)
(1, -1)
Step 4. Draw a line through the two points.
24.
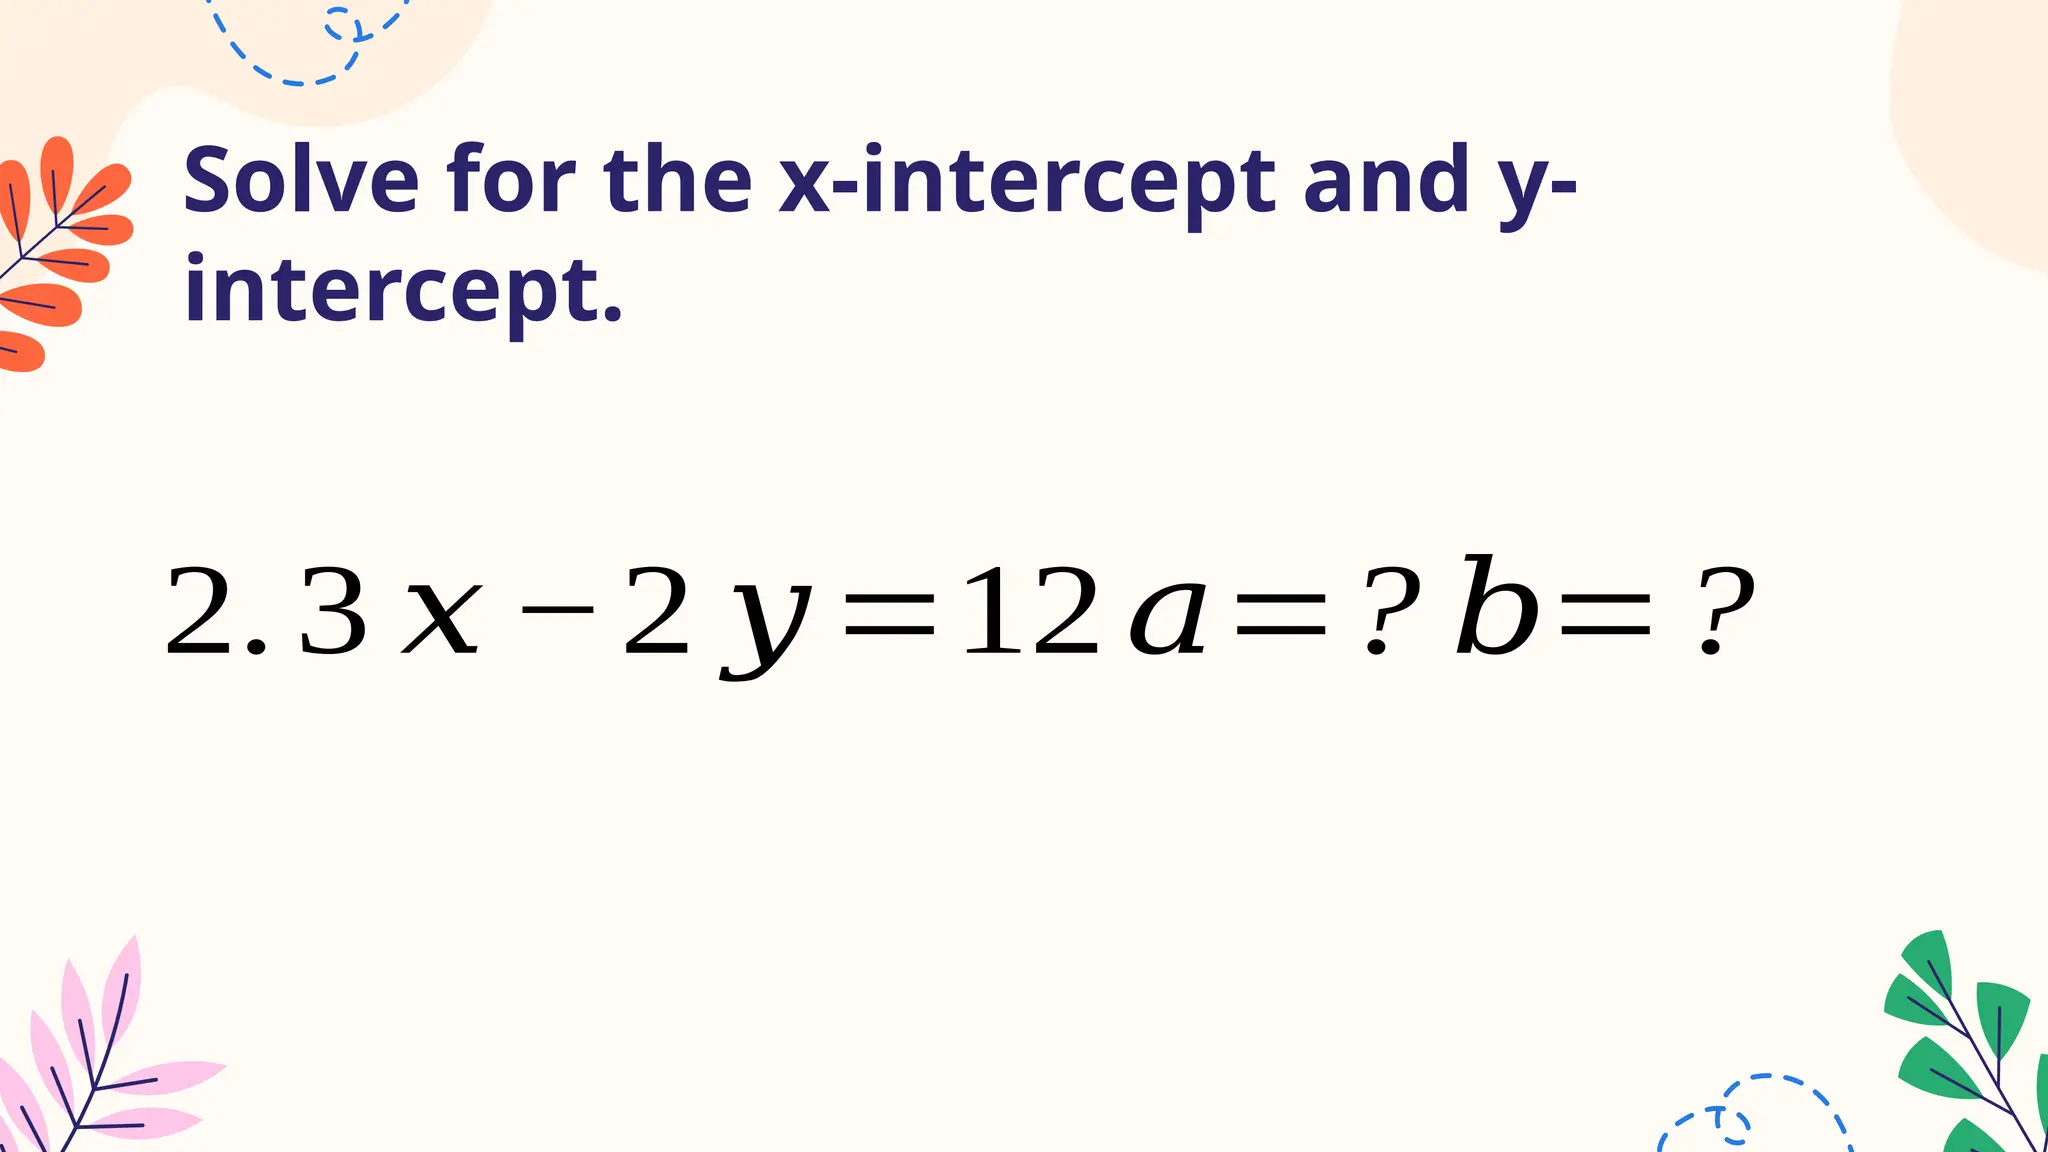
The Equation
The Equationis called the intercept form,
where a is the x-intercept and b is the y-
intercept.
When a graph intersects an axis, the
coordinate of the intersection is called an
intercept. If the line crosses the x-axis at the
point (a, 0), then the number a is the x-
intercept of the line. The values of the
intercepts can reveal a great deal about the
25.
If the linecrosses the x-axis at the point (a,
0), then the number a is the x-intercept of
the line. If the line crosses the y-axis at the
point (0, b), then the number b is the y-
intercept of the line. The values of the
intercepts can reveal a great deal about the
graph.
26.
Here is howto graph the linear
equation of the form


![Introduction_to_Linear_Equation[1].pdf Algebra 1](https://cdn.slidesharecdn.com/ss_thumbnails/introductiontolinearequation1-241214102404-e9b93535-thumbnail.jpg?width=640&height=640&fit=bounds)


