The document discusses different forms and methods for graphing linear functions, including:
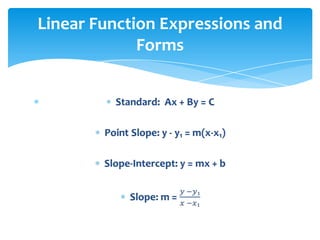
1) The standard, point-slope, and slope-intercept forms of linear equations.
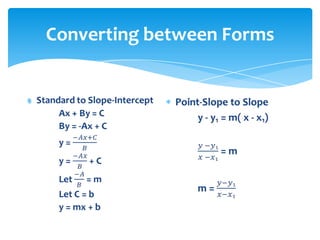
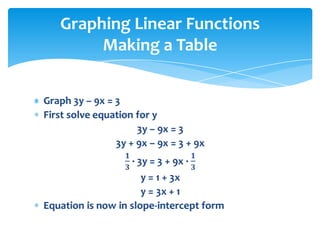
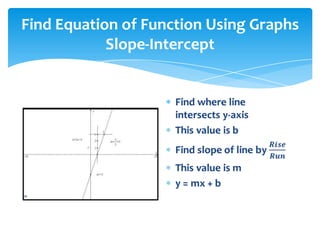
2) Converting between these forms by solving for slope and y-intercept.
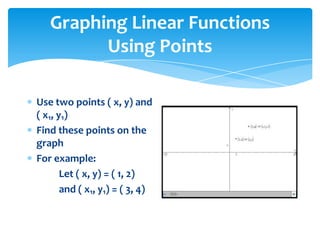
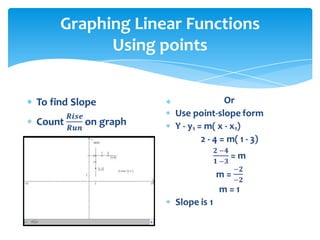
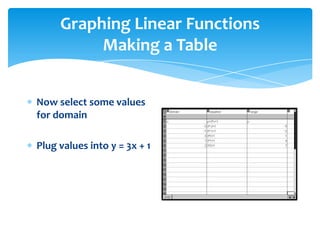
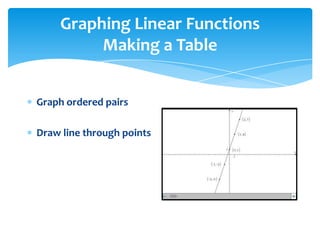
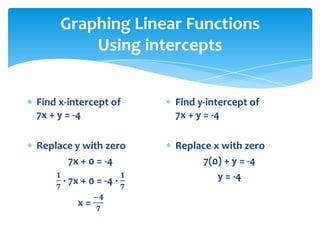
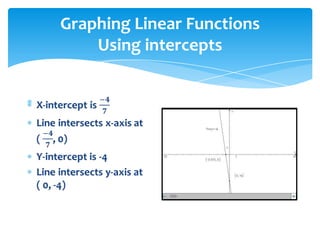
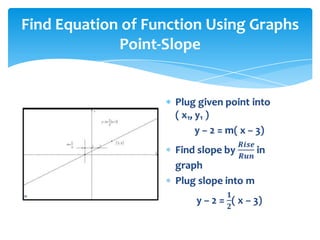
3) Graphing linear functions by finding the slope from two points using the point-slope form, making a table of x-y values, or finding the x- and y-intercepts.
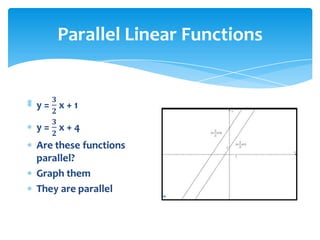
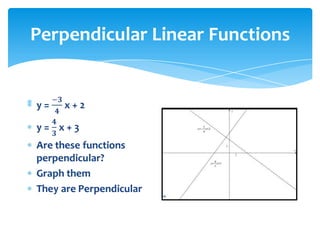
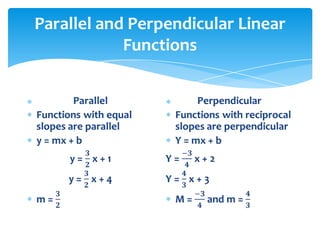
4) Determining if two functions are parallel or perpendicular based on having equal or reciprocal slopes.