Downloaded 11 times

![• Nonlinear data Structures.
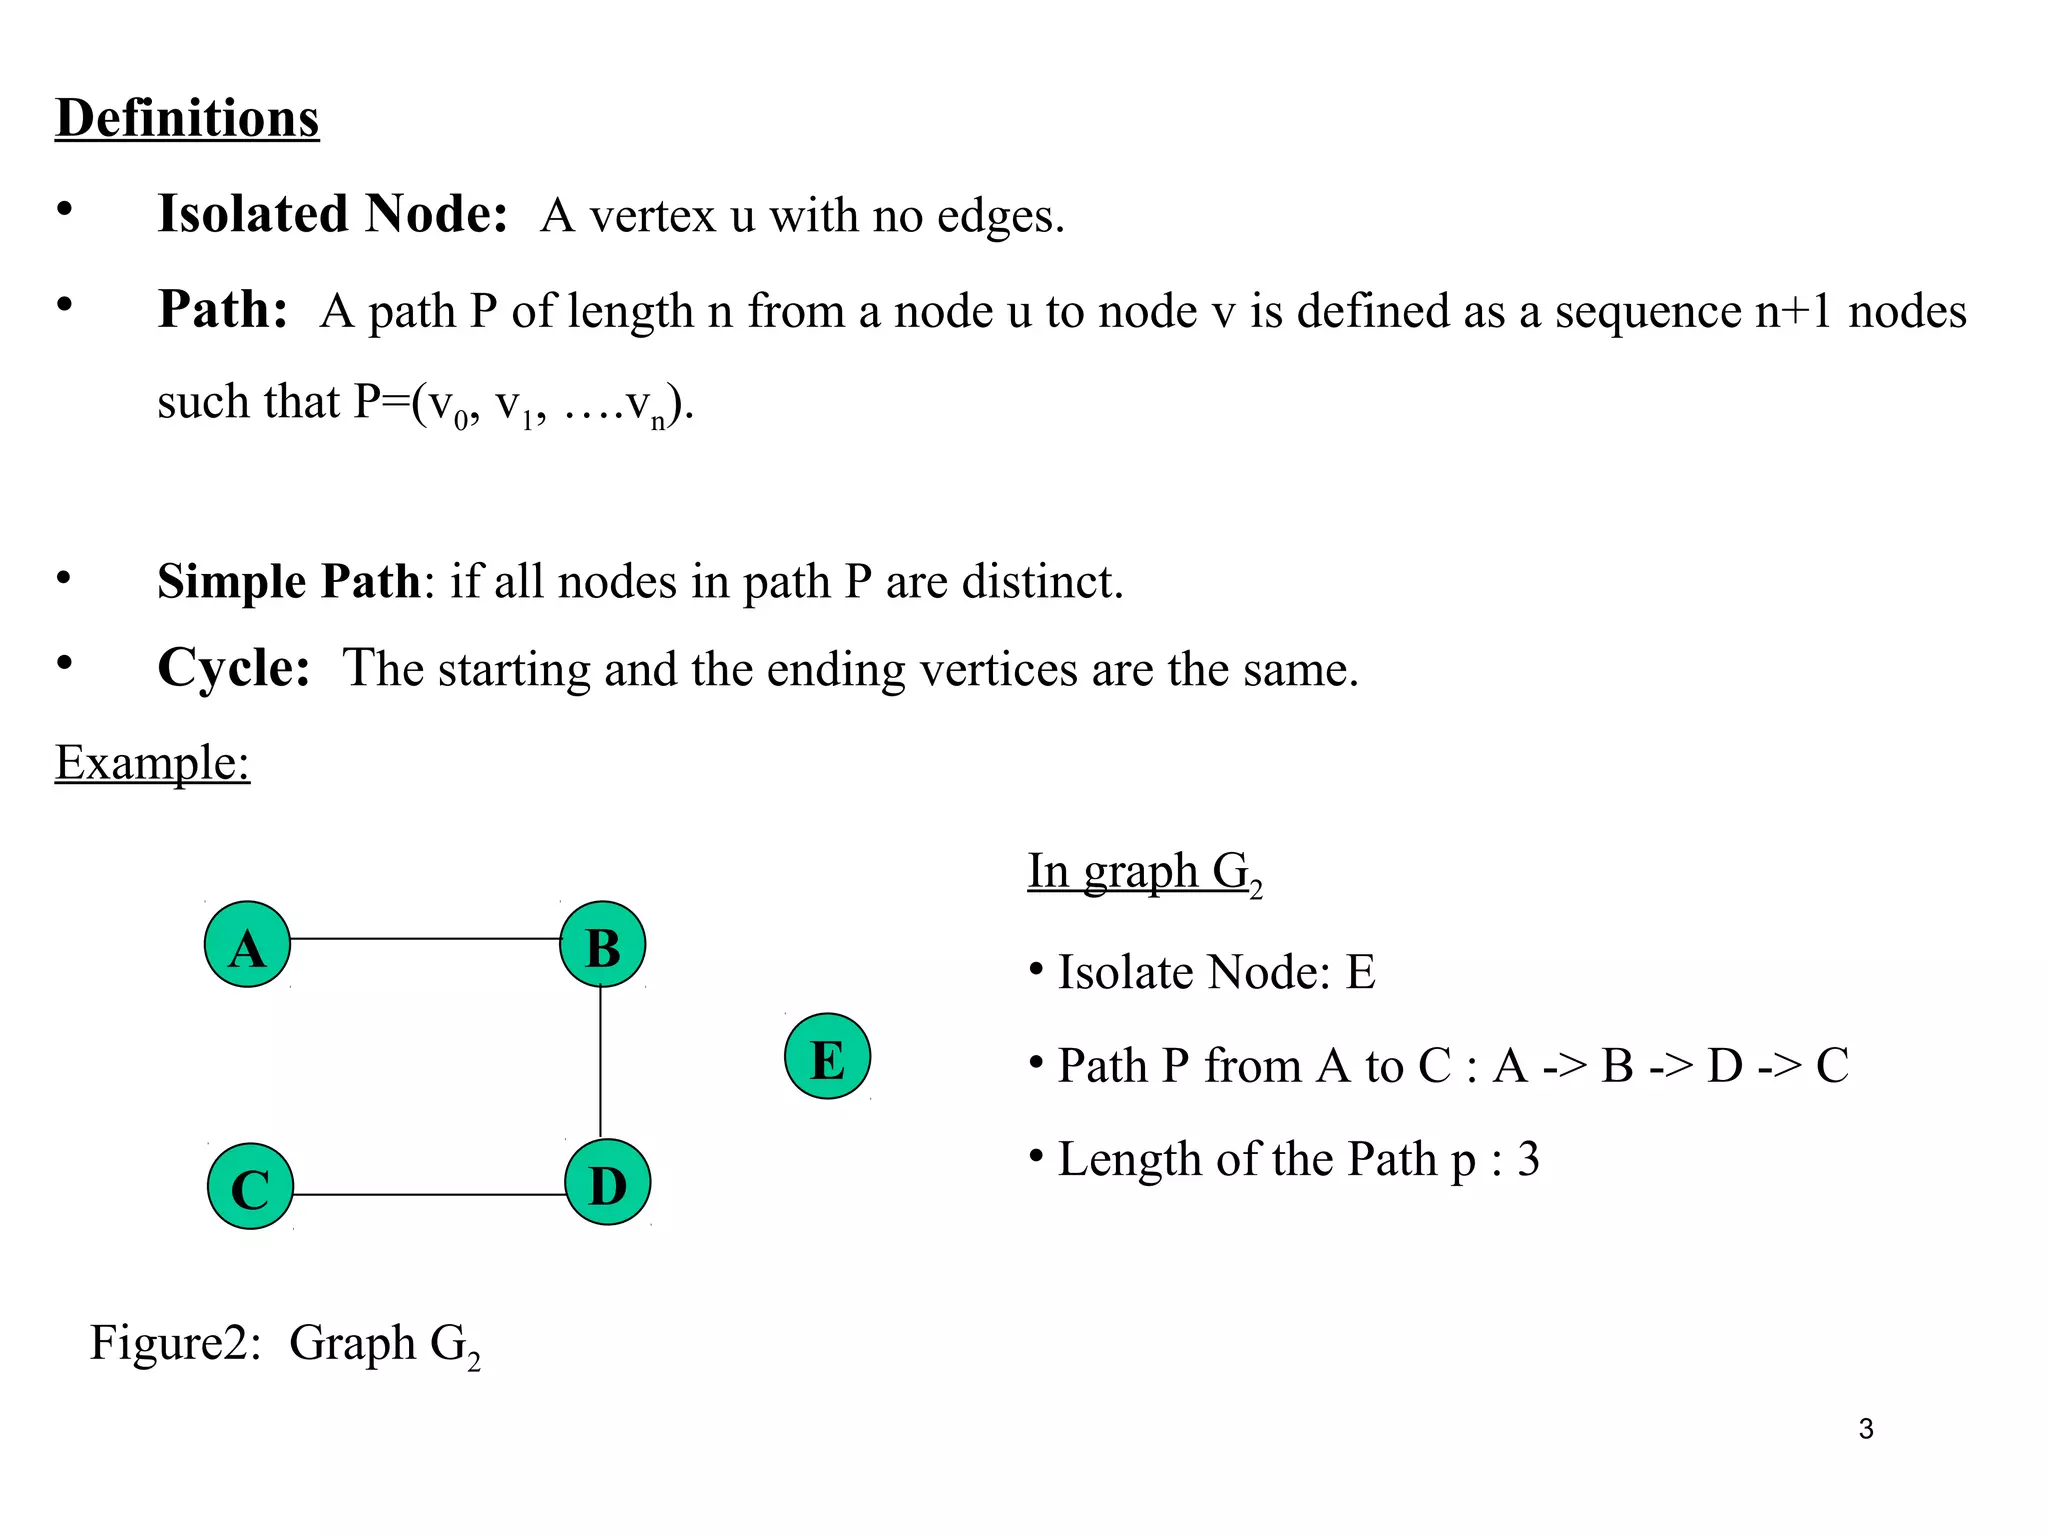
• A graph G consists of two properties:
(a) A set V of elements called vertices or nodes.
(b) A set E of connectors called edges such that each edge e is identified as
e = (u,v) (unordered pair of vertices). Here is a edge between u and v and
they are said to be the adjacent nodes or neighbors .
The order of a graph is |V| (the number of vertices).
A graph's size is |E|, the number of edges.
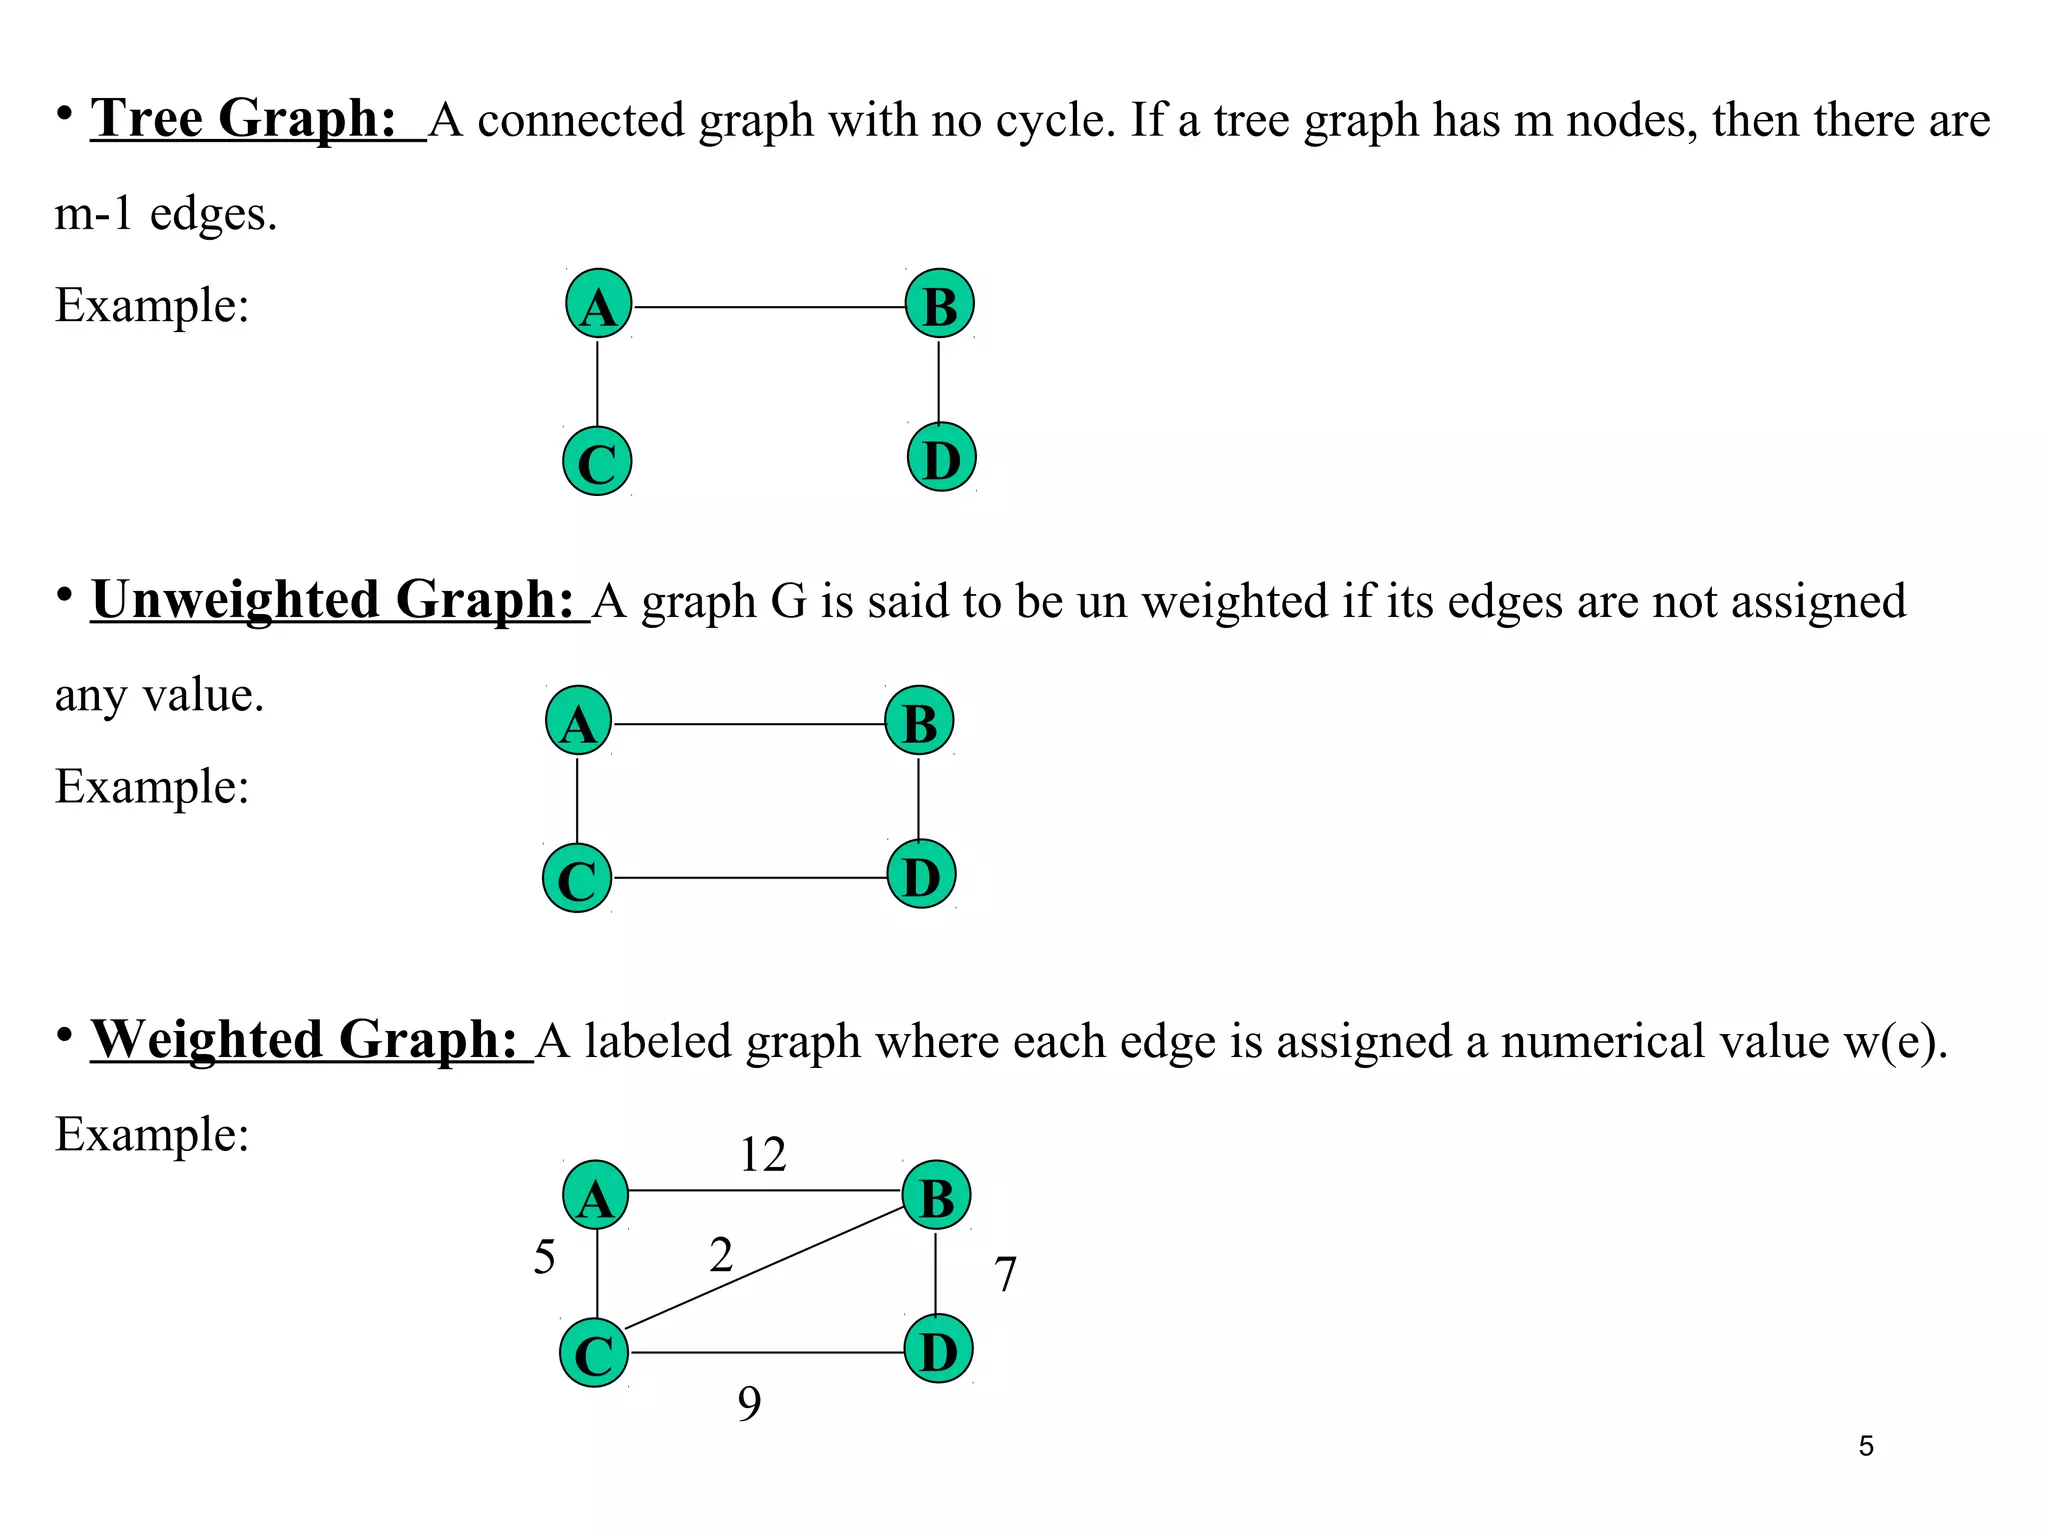
A tree is a graph with no cycle.
Example:
A B
C D
E
In Graph G1
• 5 Vertices:{A, B, C, D, E}
• 6 Edges: {[A,B], [A,C], [B,D],
[B,E], [C,D], [D,E]}
Figure1: A graph G1
GraphGraph
2](https://image.slidesharecdn.com/basicsofgraph-170815221600/75/Basics-of-graph-2-2048.jpg)
![Linked Representation of a GraphLinked Representation of a Graph
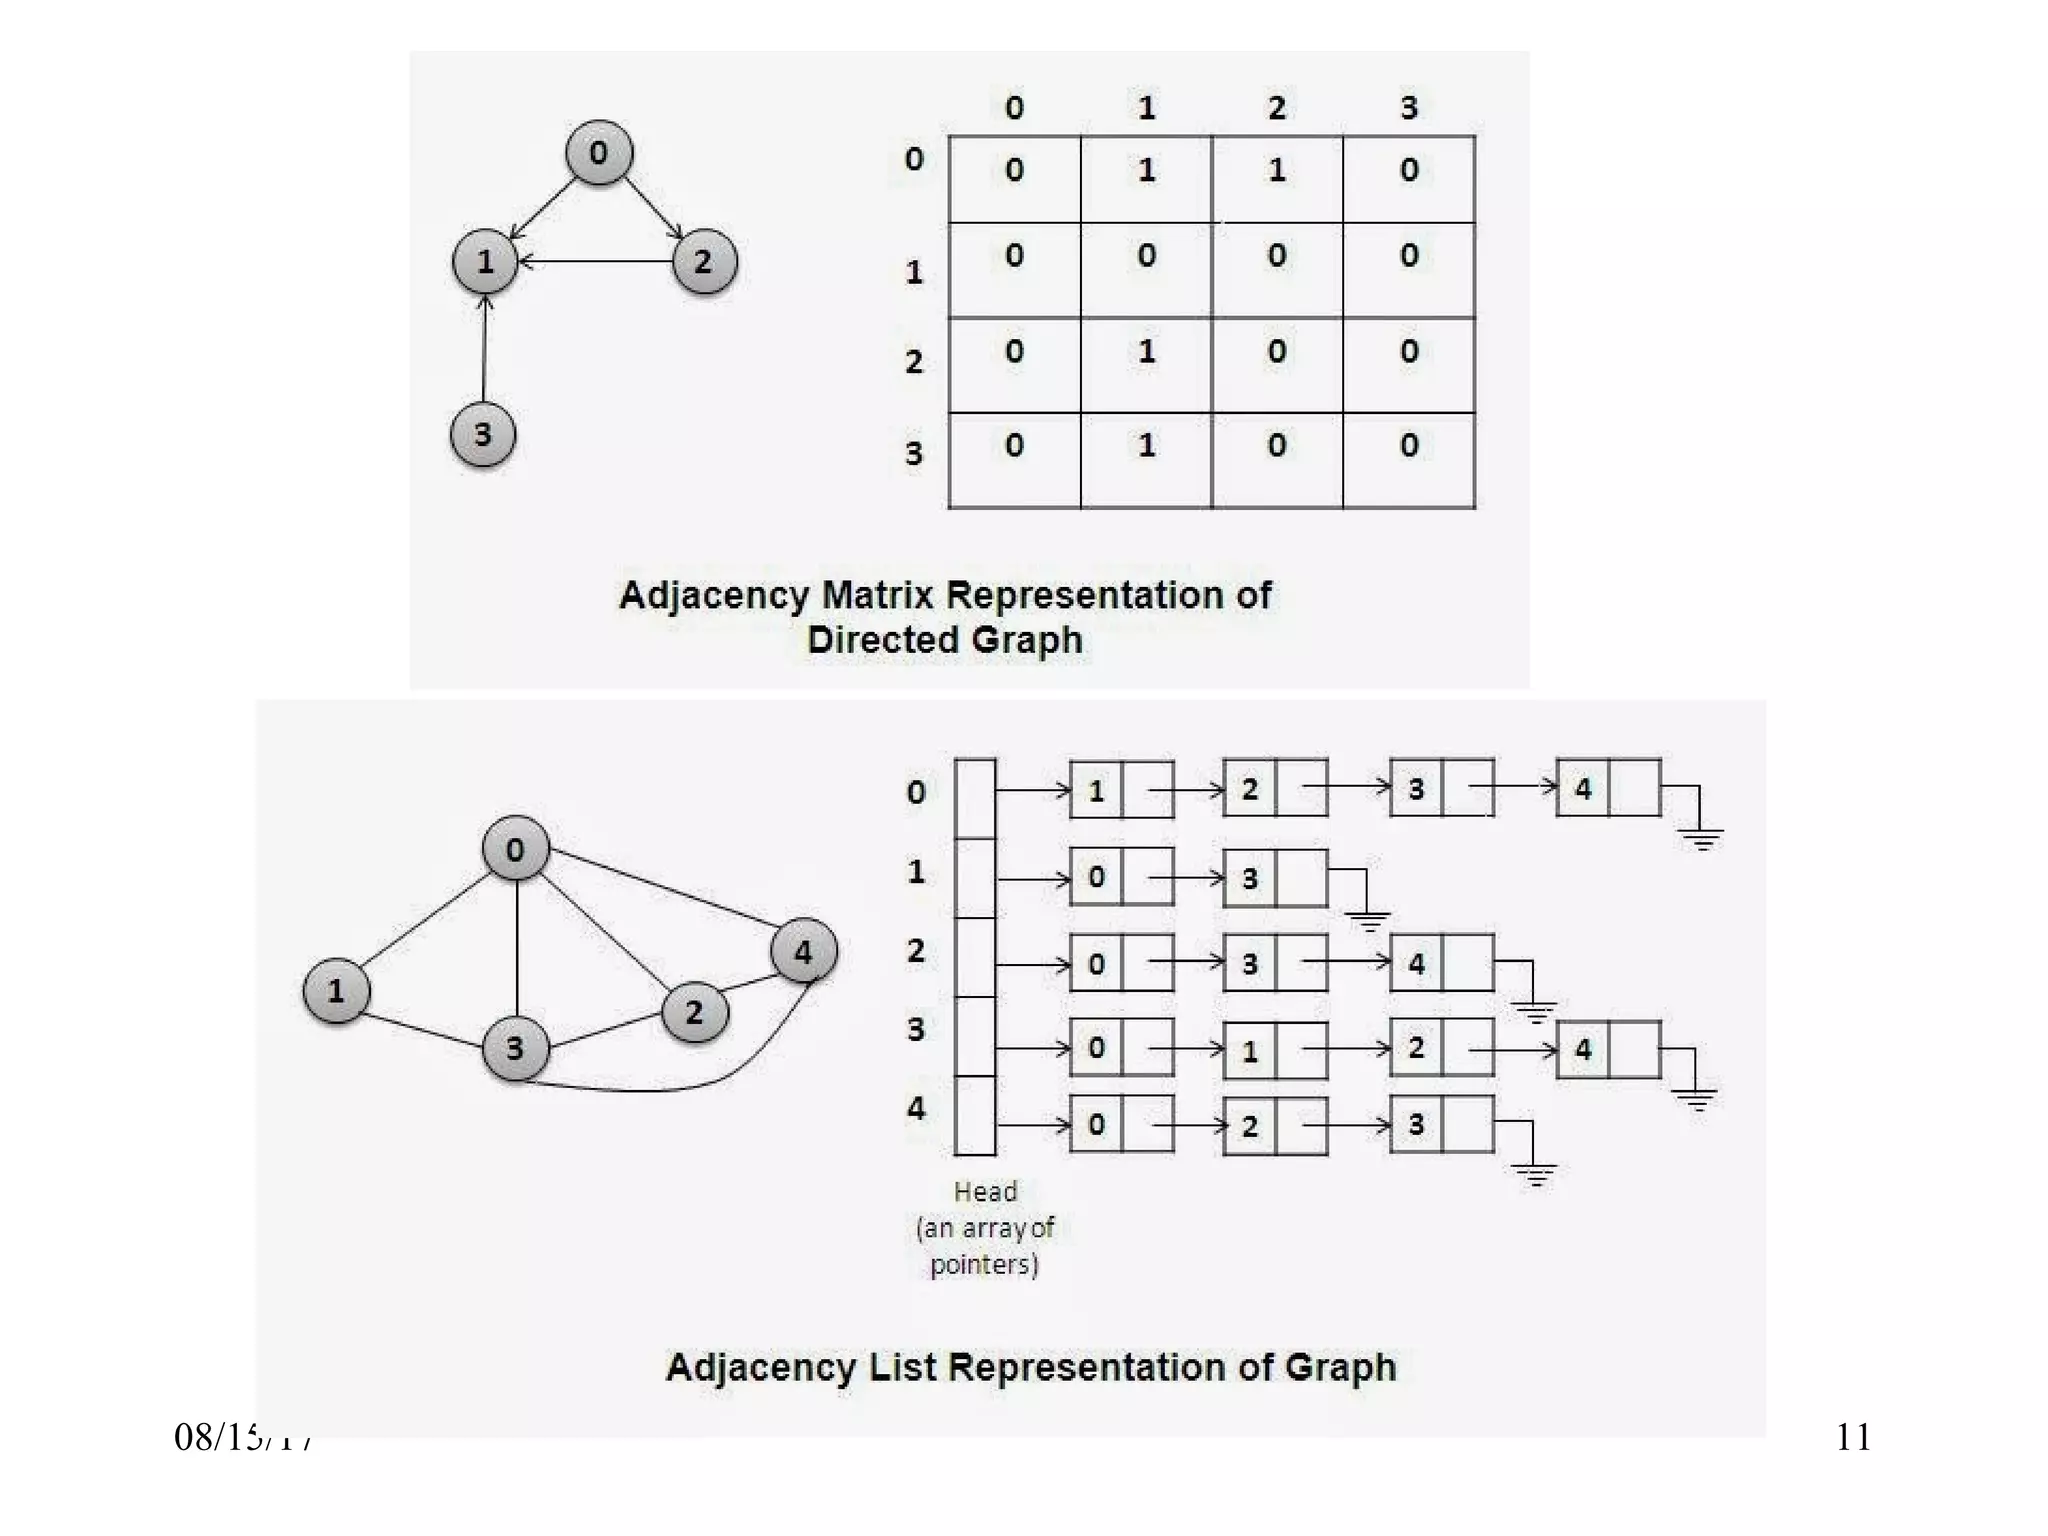
•Adjacency List:
An array of linked lists is used. Size of the array is equal to number of vertices. Let the
array be array[]. An entry array[i] represents the linked list of vertices adjacent to the ith
vertex. This representation can also be used to represent a weighted graph. The weights of
edges can be stored in nodes of linked lists. Following is adjacency list representation of
the above graph.
Example:
Figure: Directed Graph and Corresponding Adjacency List
10](https://image.slidesharecdn.com/basicsofgraph-170815221600/75/Basics-of-graph-10-2048.jpg)
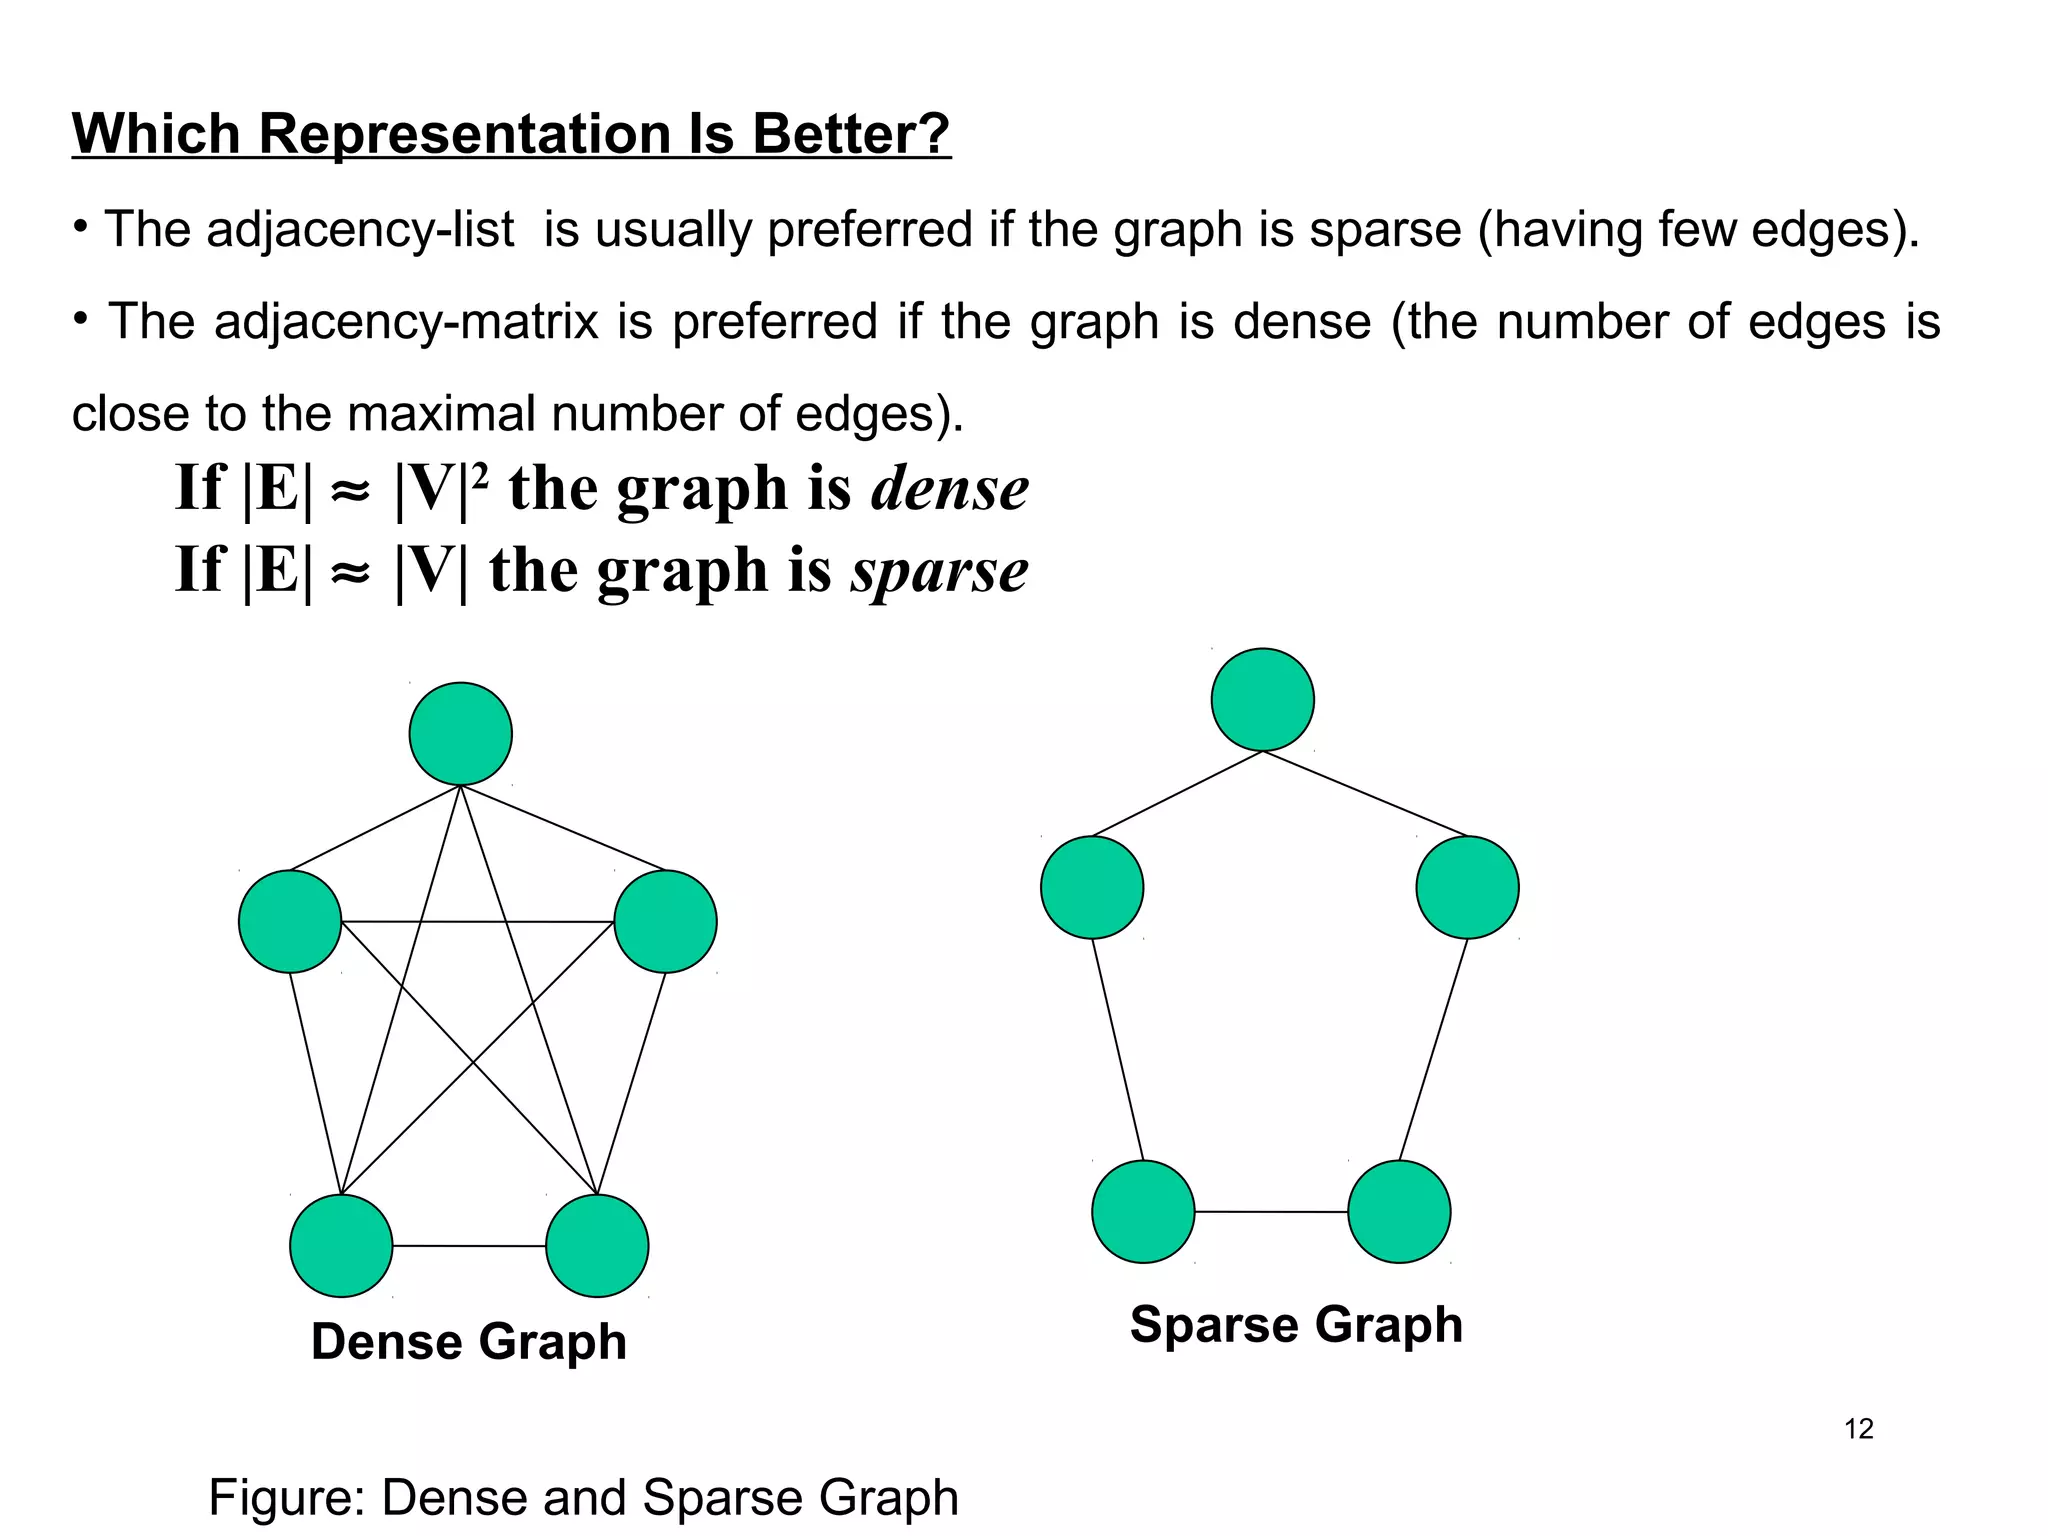


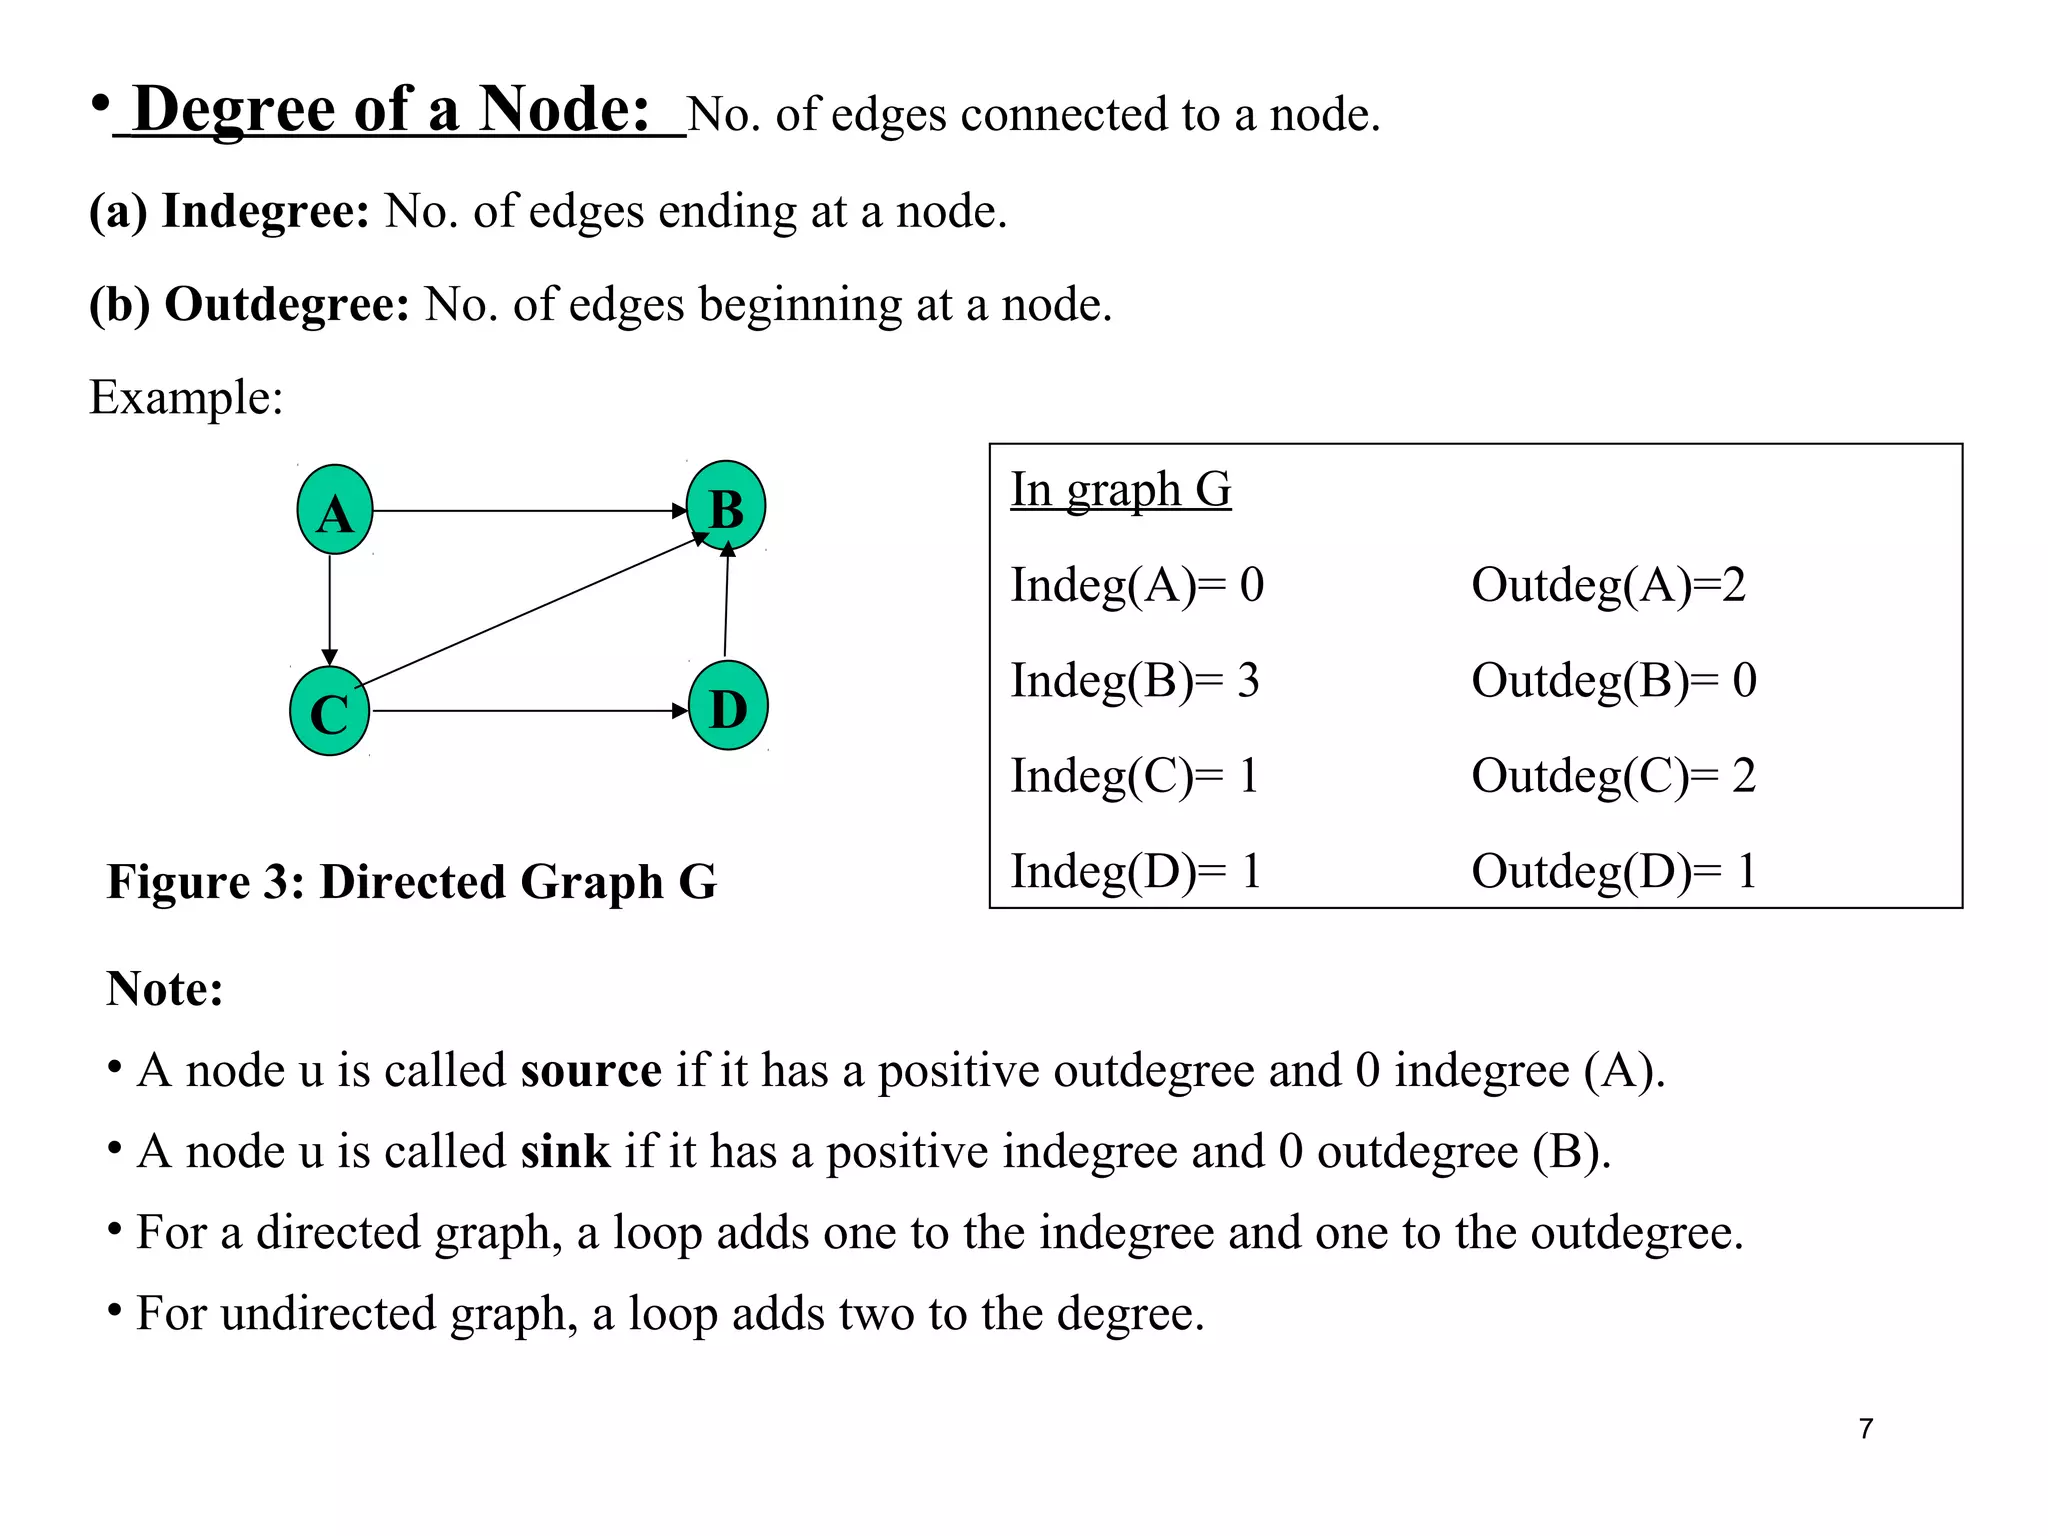
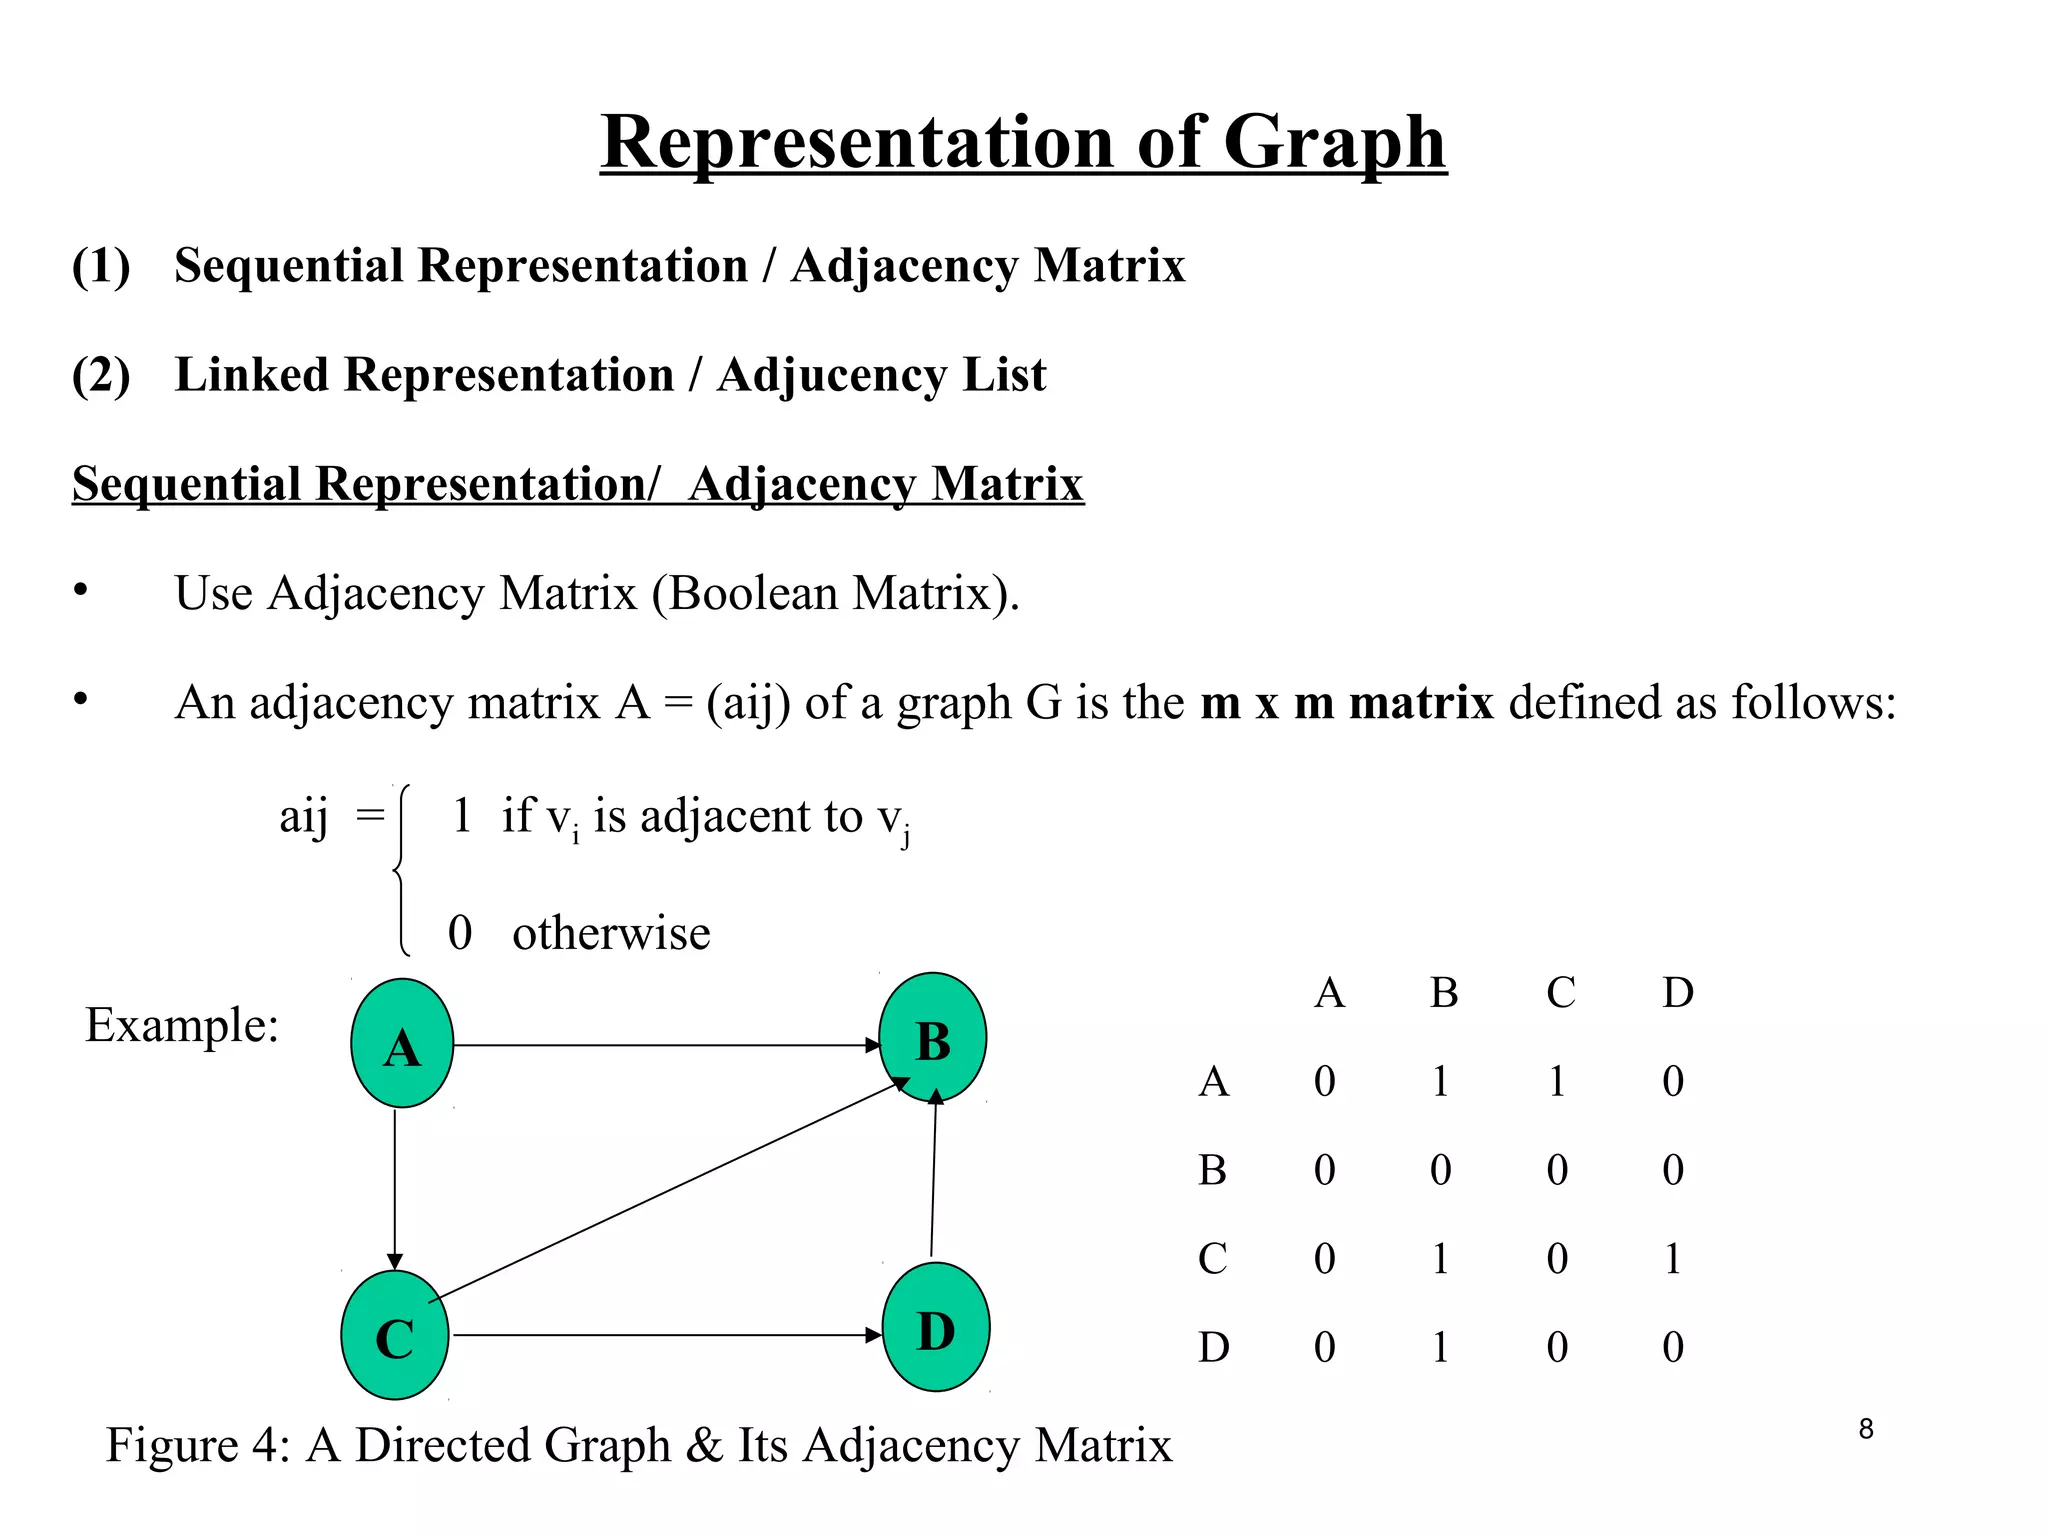
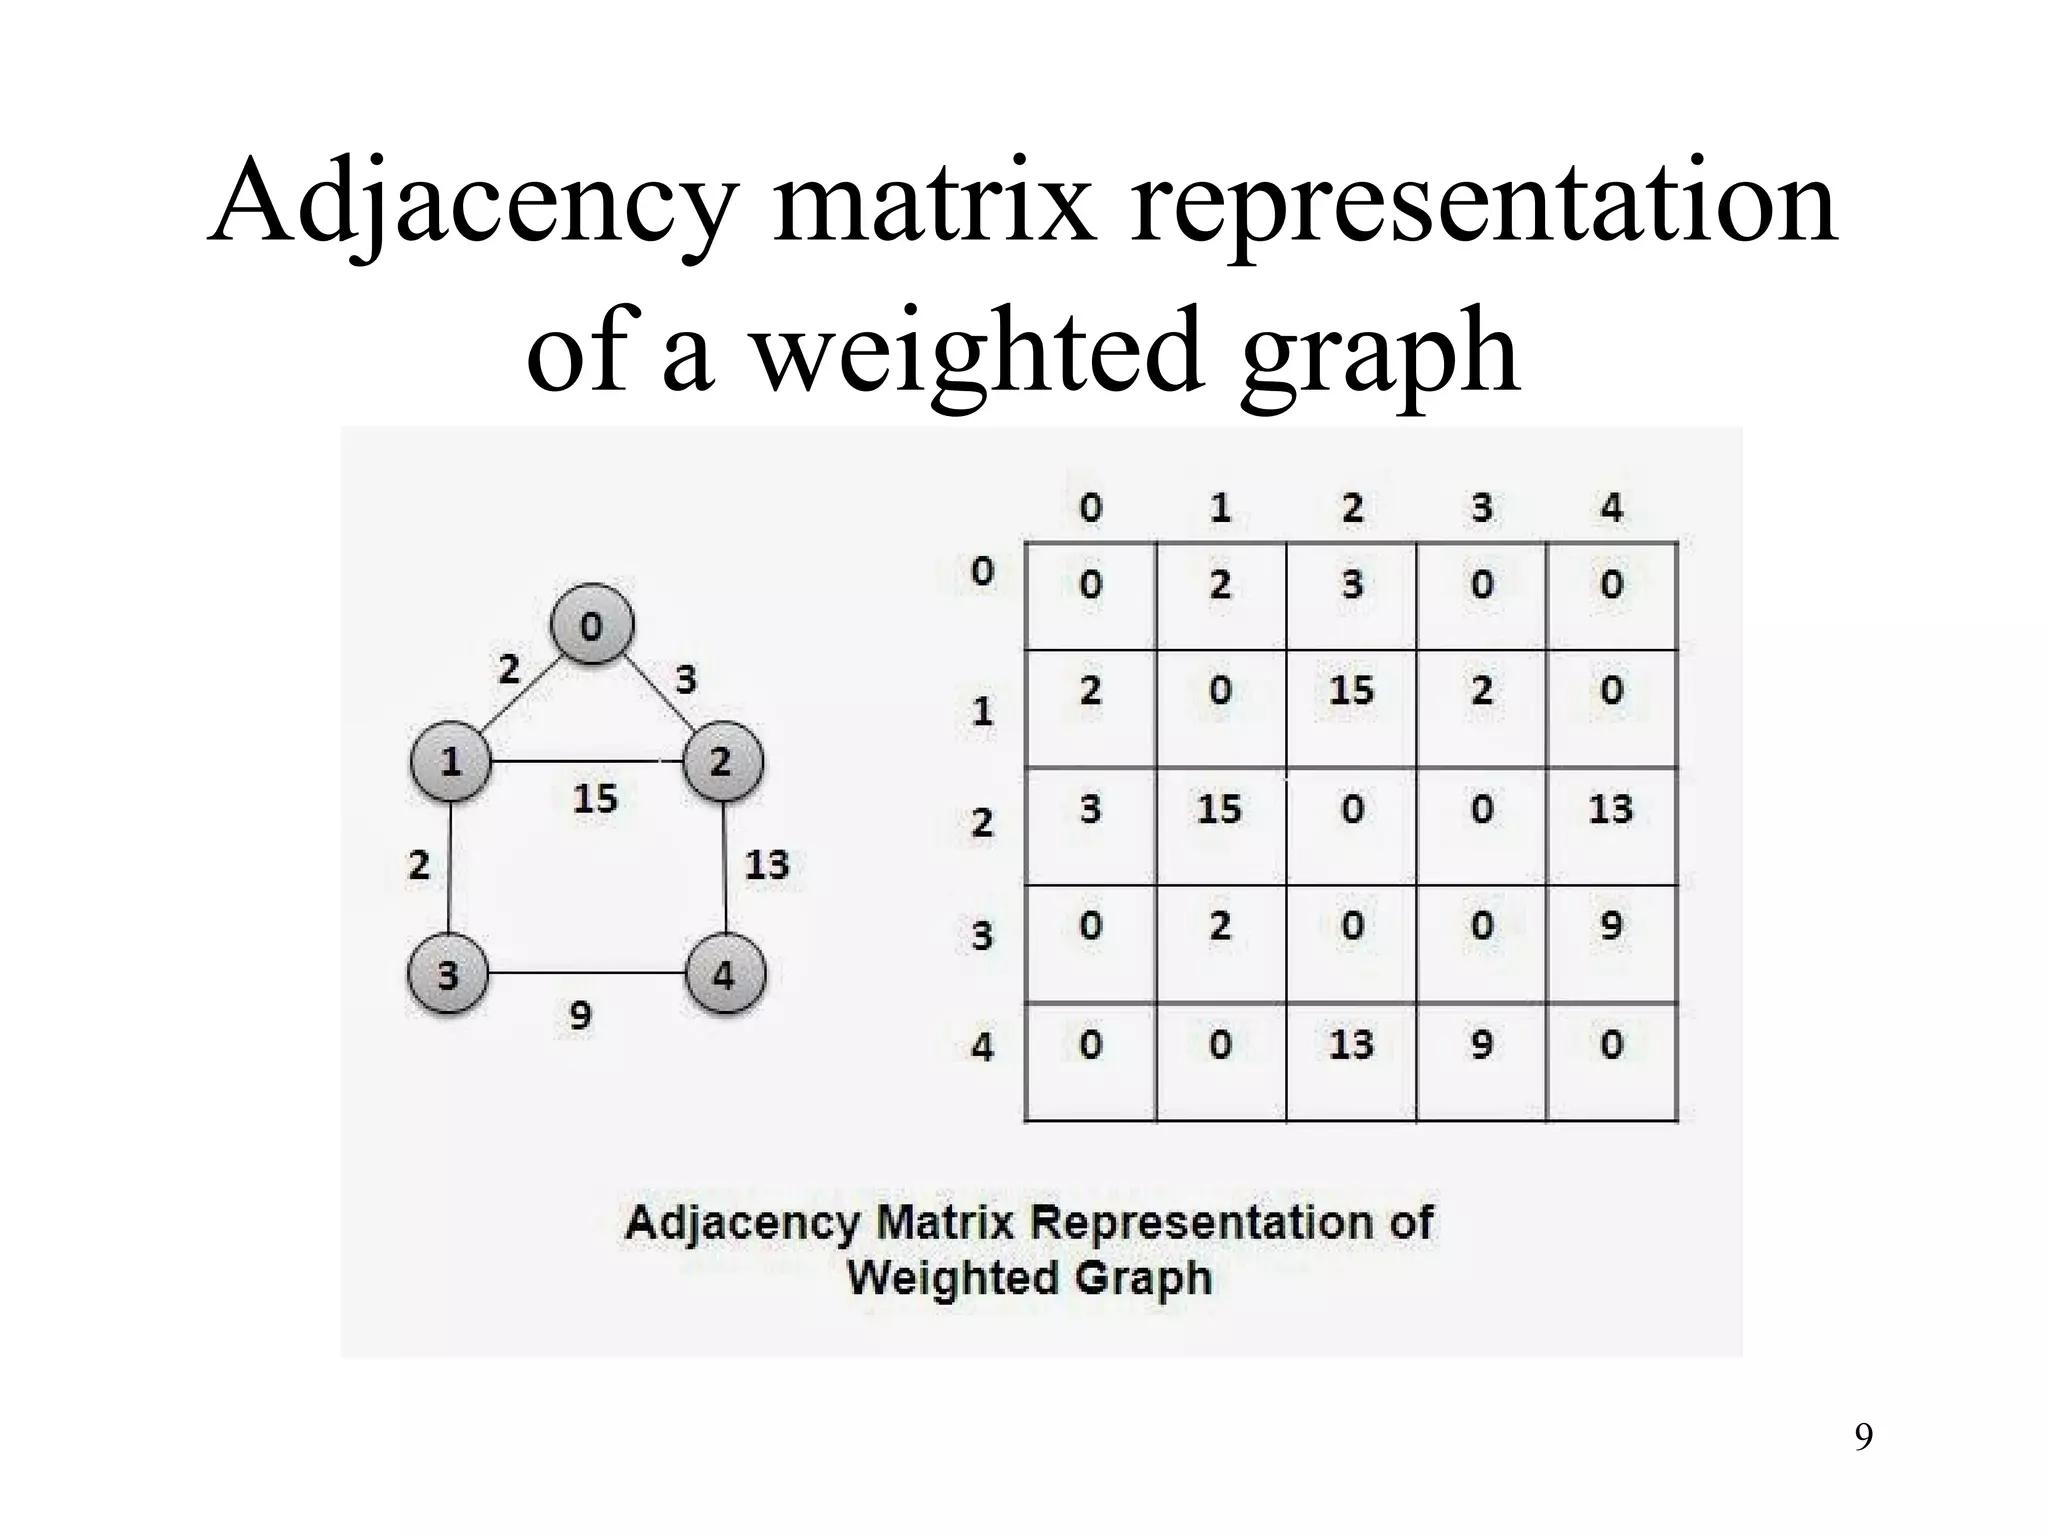
This document discusses graphs and their applications and representations. It defines what a graph is consisting of vertices and edges. It describes different types of graphs such as trees, connected graphs, weighted graphs, directed graphs, and multigraphs. It also discusses graph representations including adjacency matrices and adjacency lists. Finally, it notes that adjacency lists are generally preferred for sparse graphs while adjacency matrices are better for dense graphs.


![LED [light-emitting-diode]](https://cdn.slidesharecdn.com/ss_thumbnails/led-light-emitting-diod-170815220937-thumbnail.jpg?width=640&height=640&fit=bounds)


