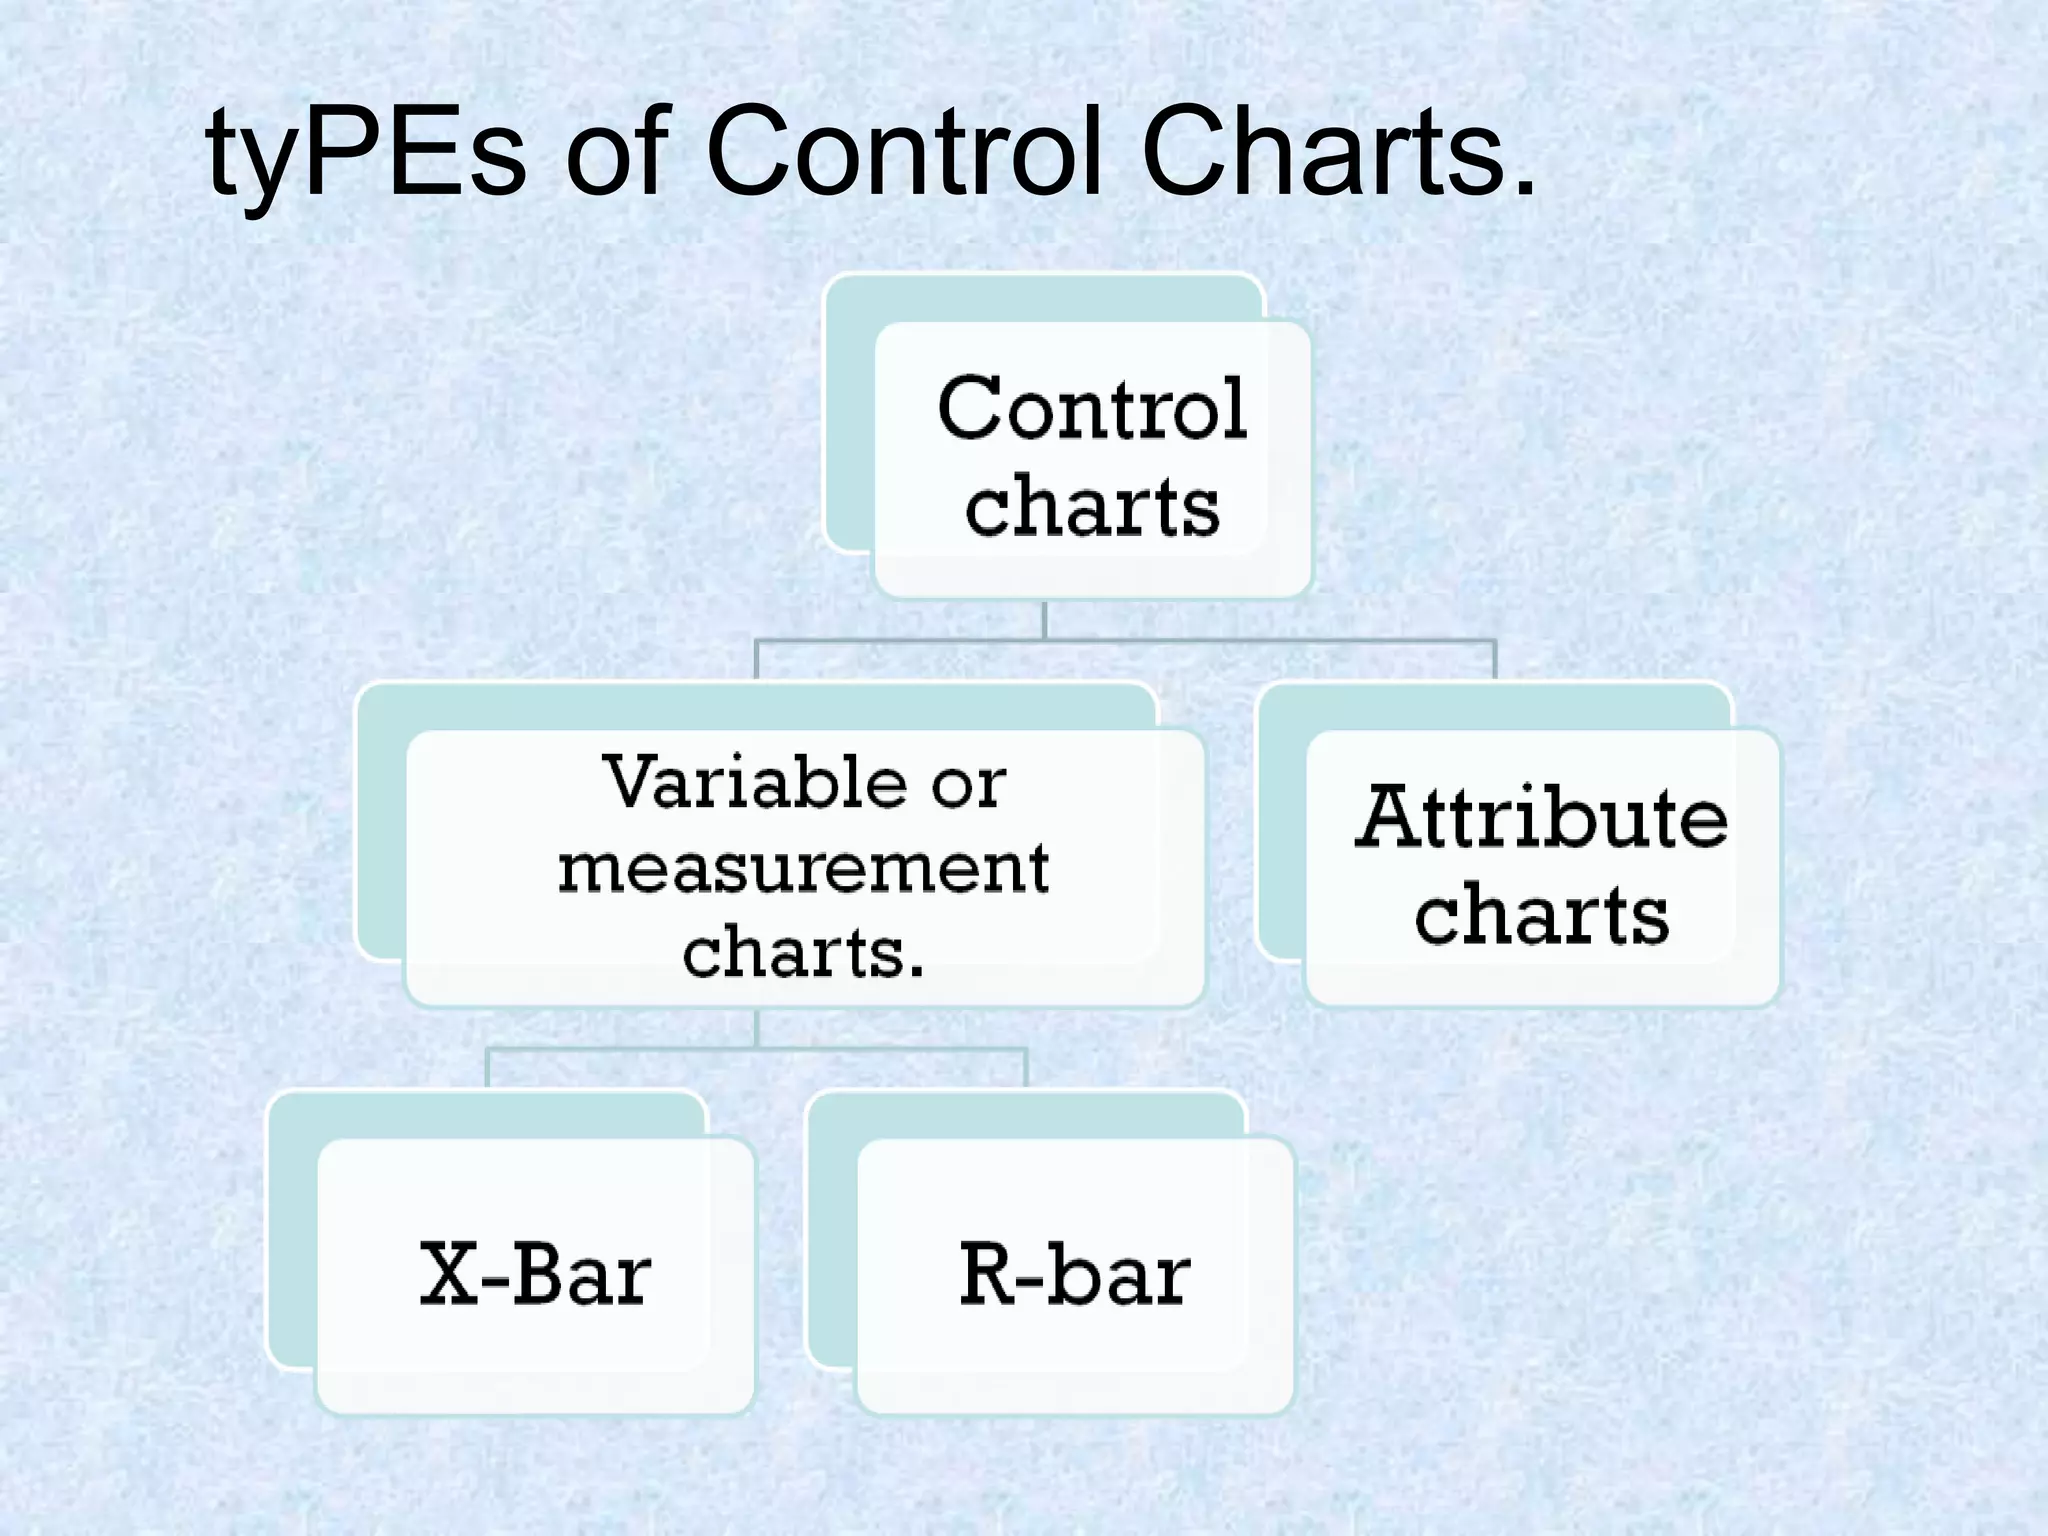
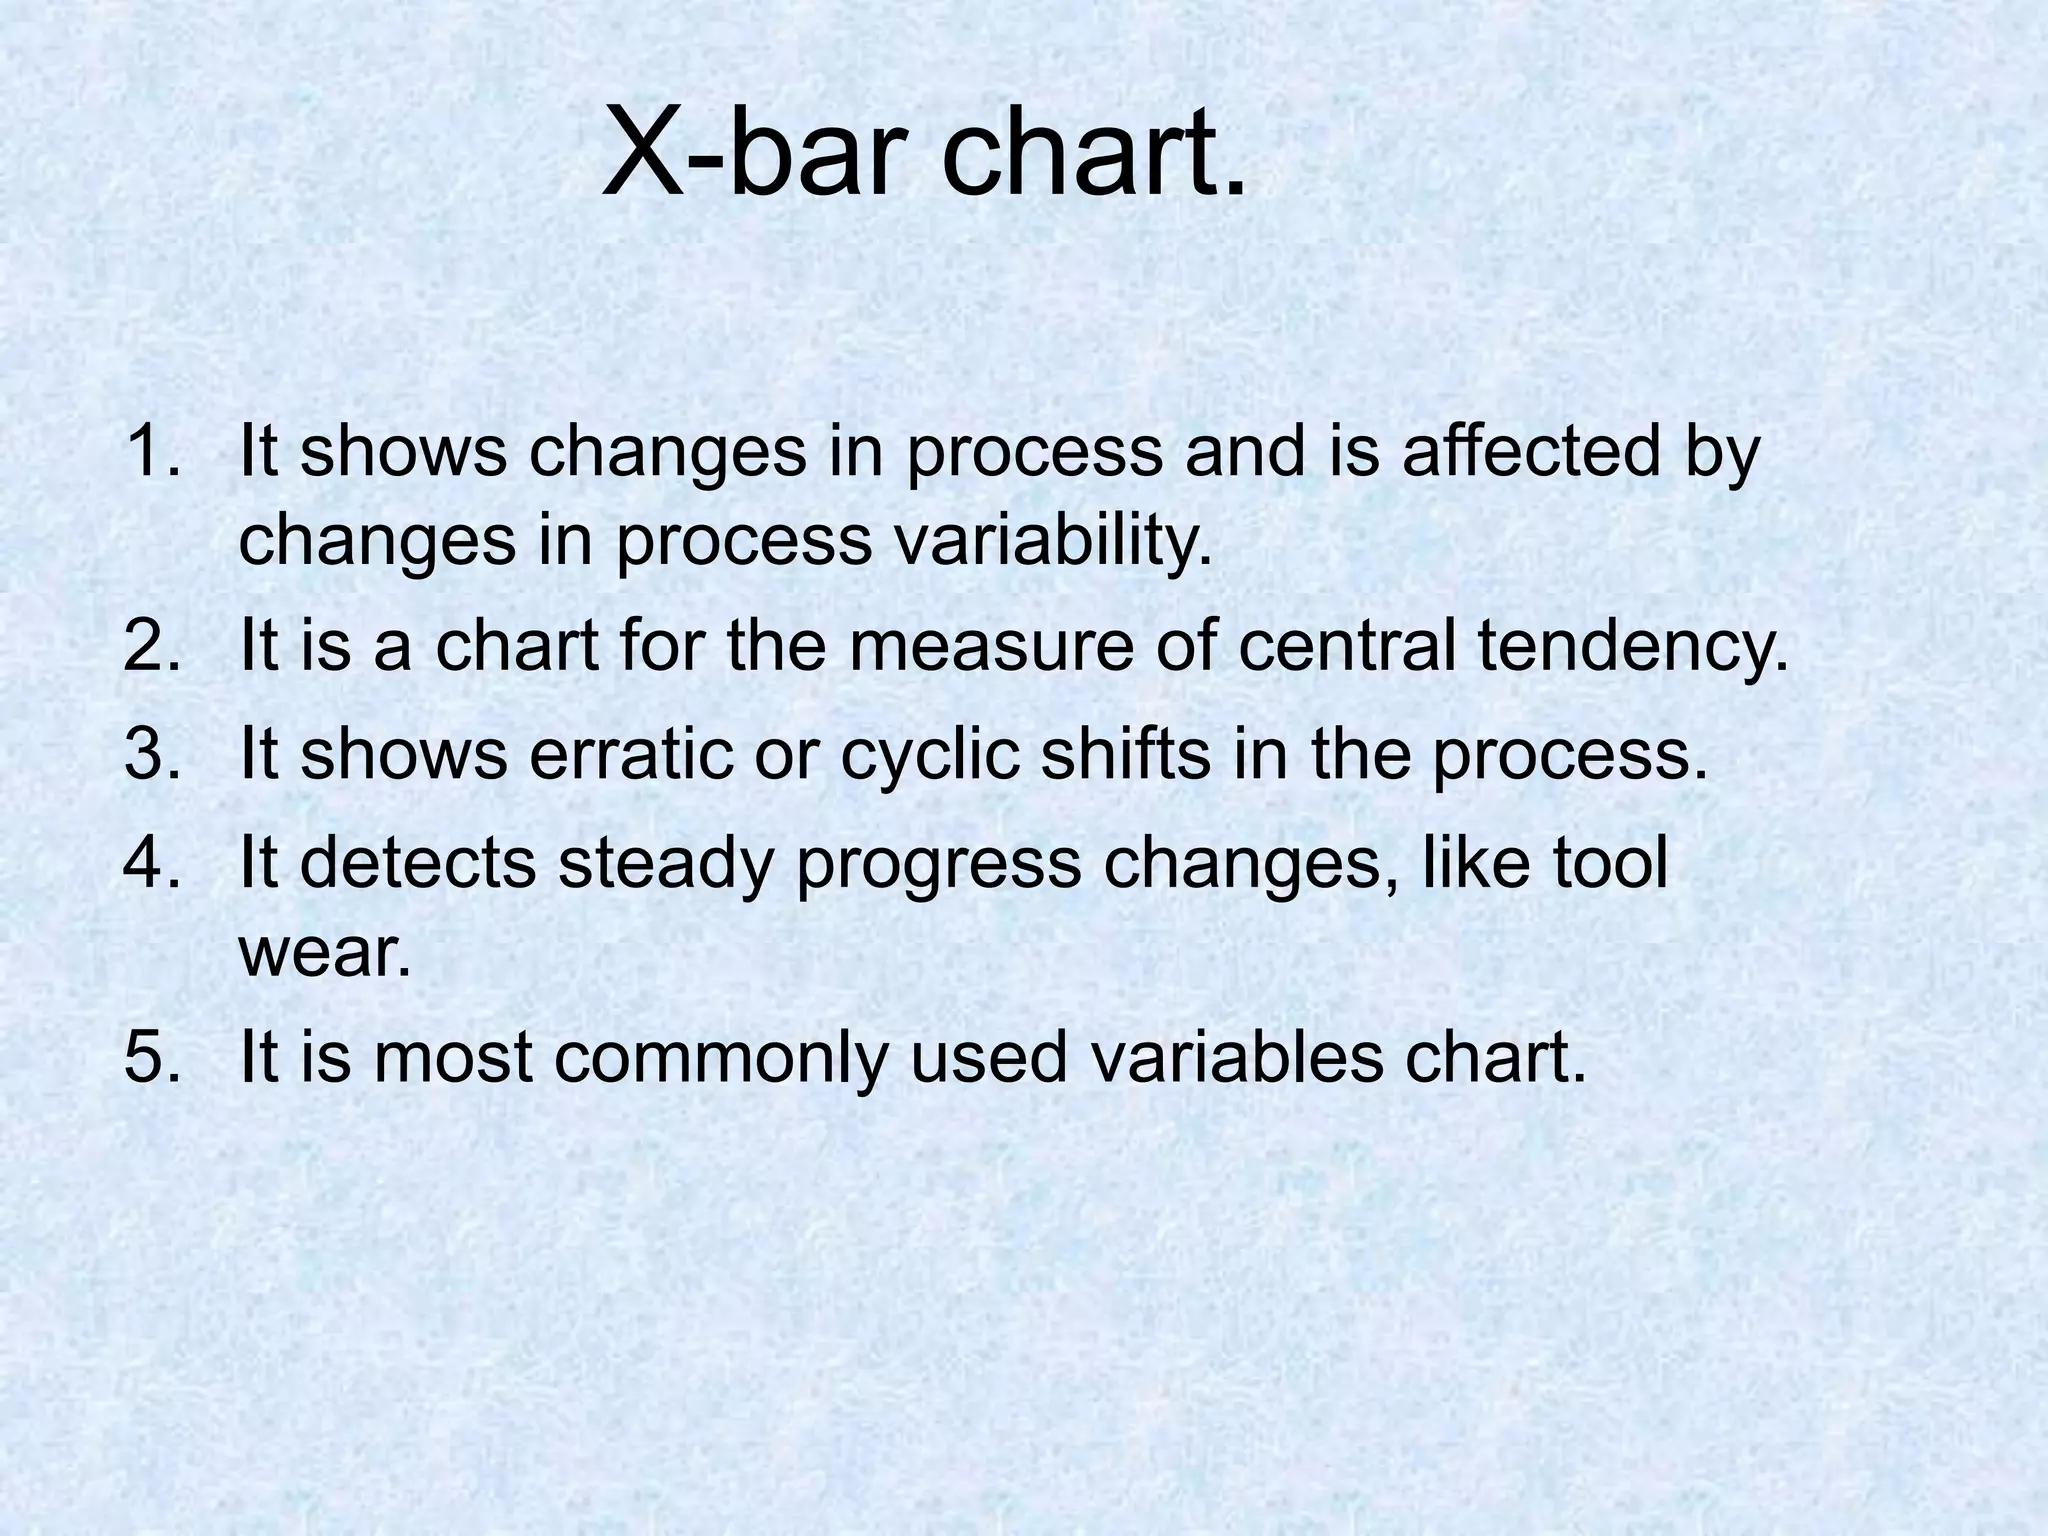
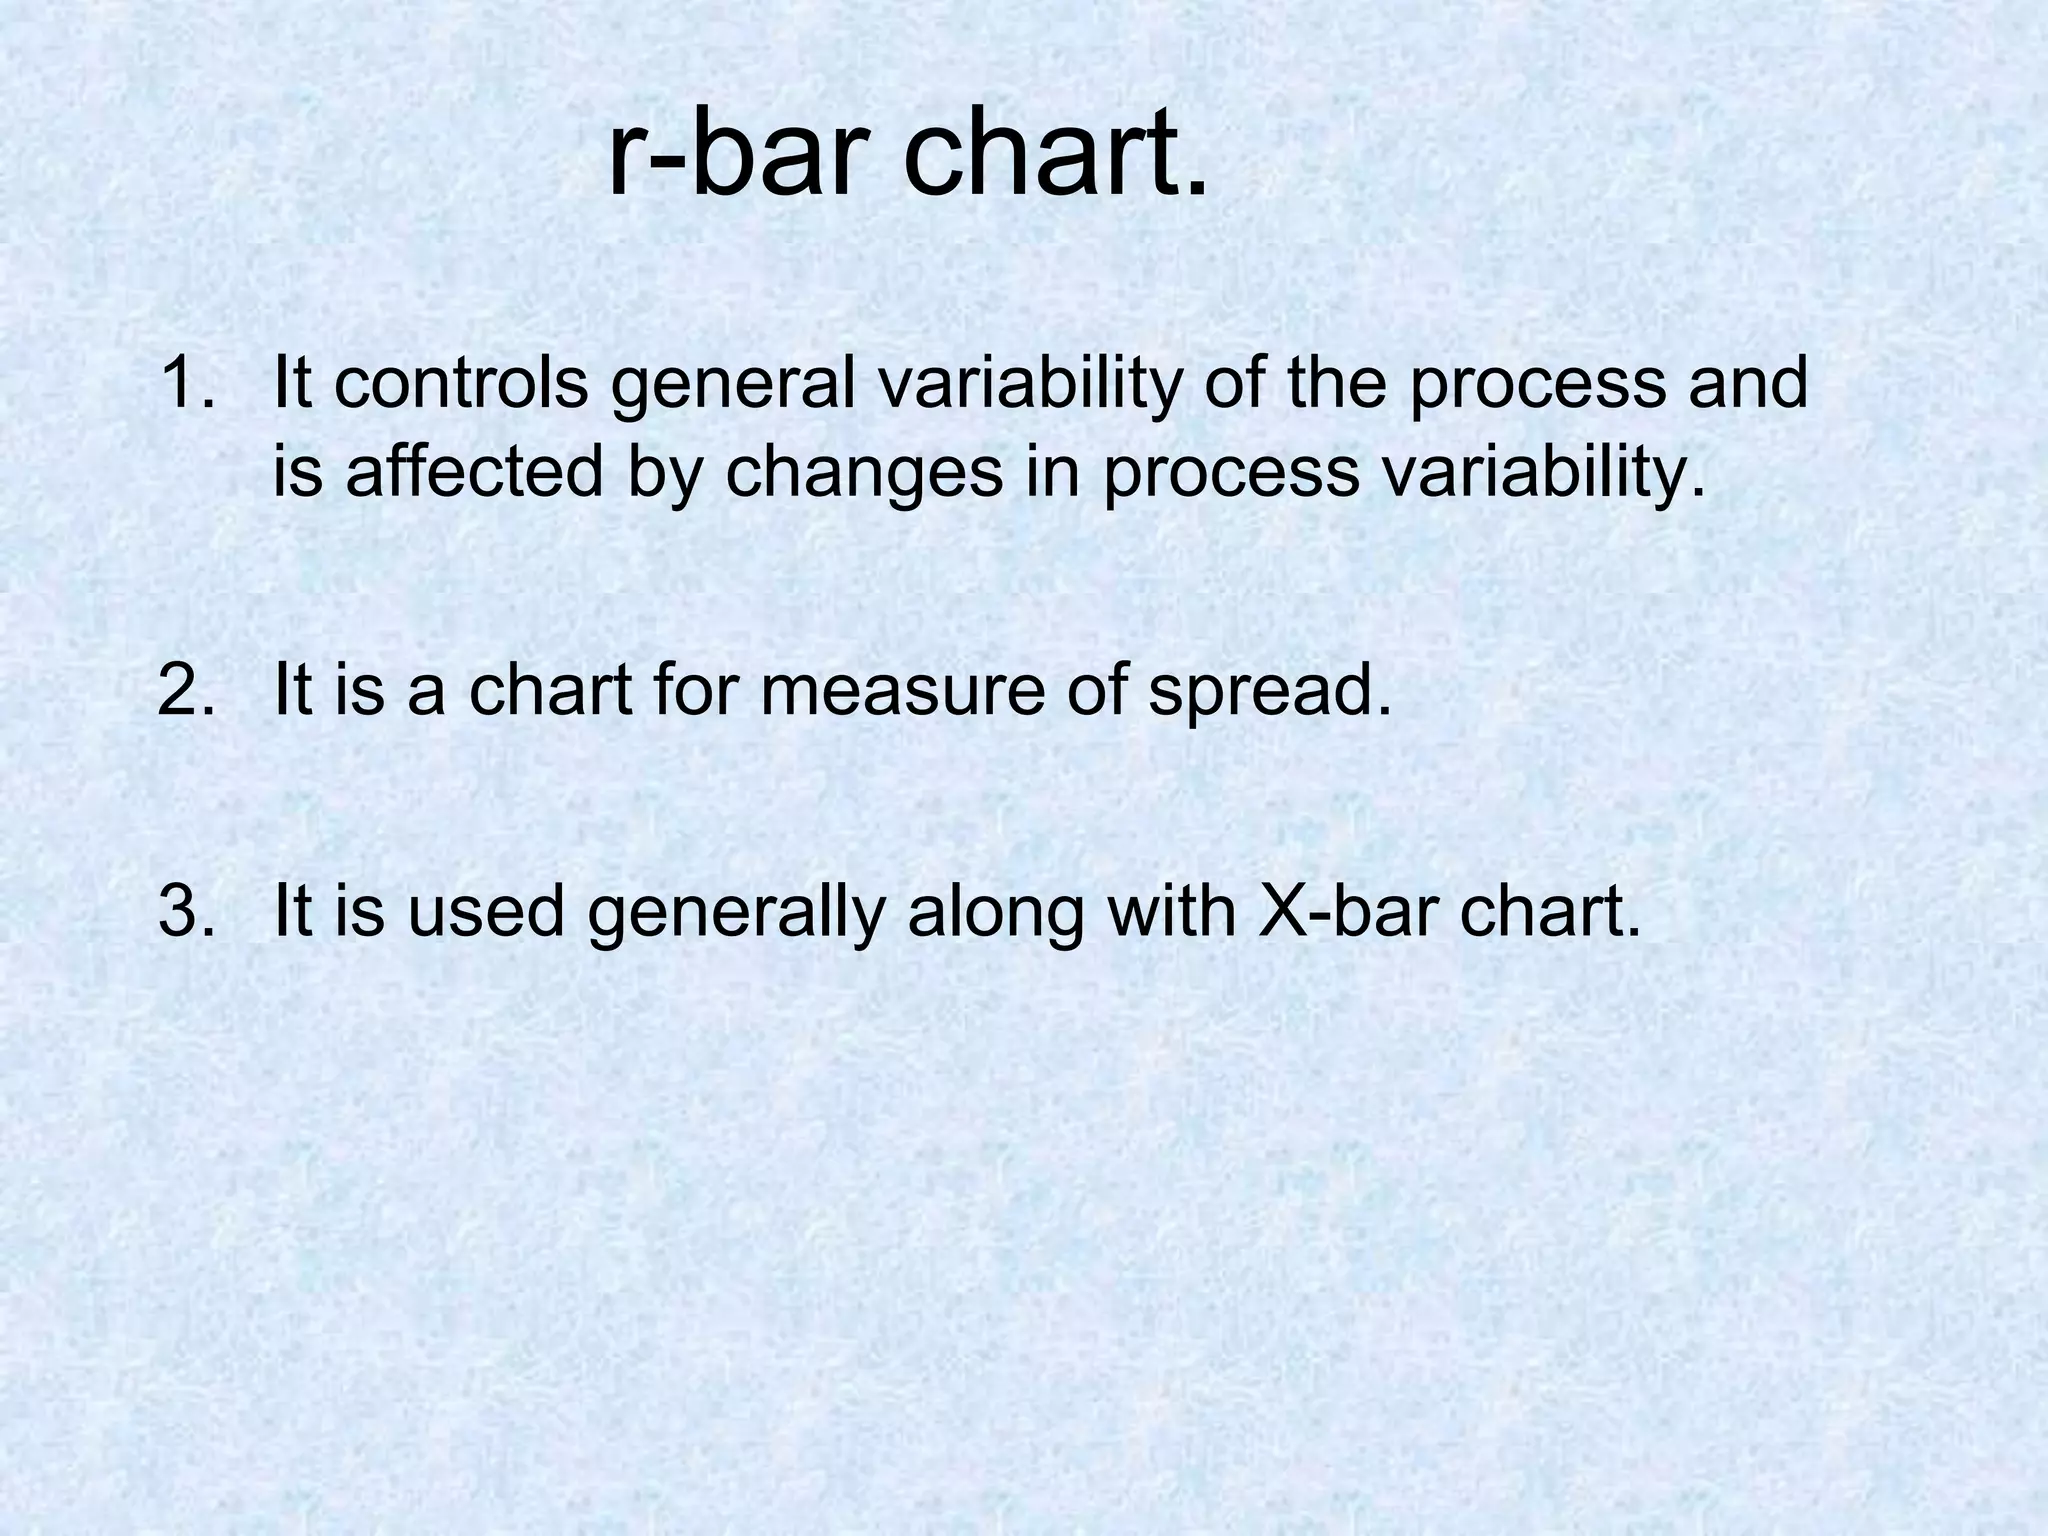
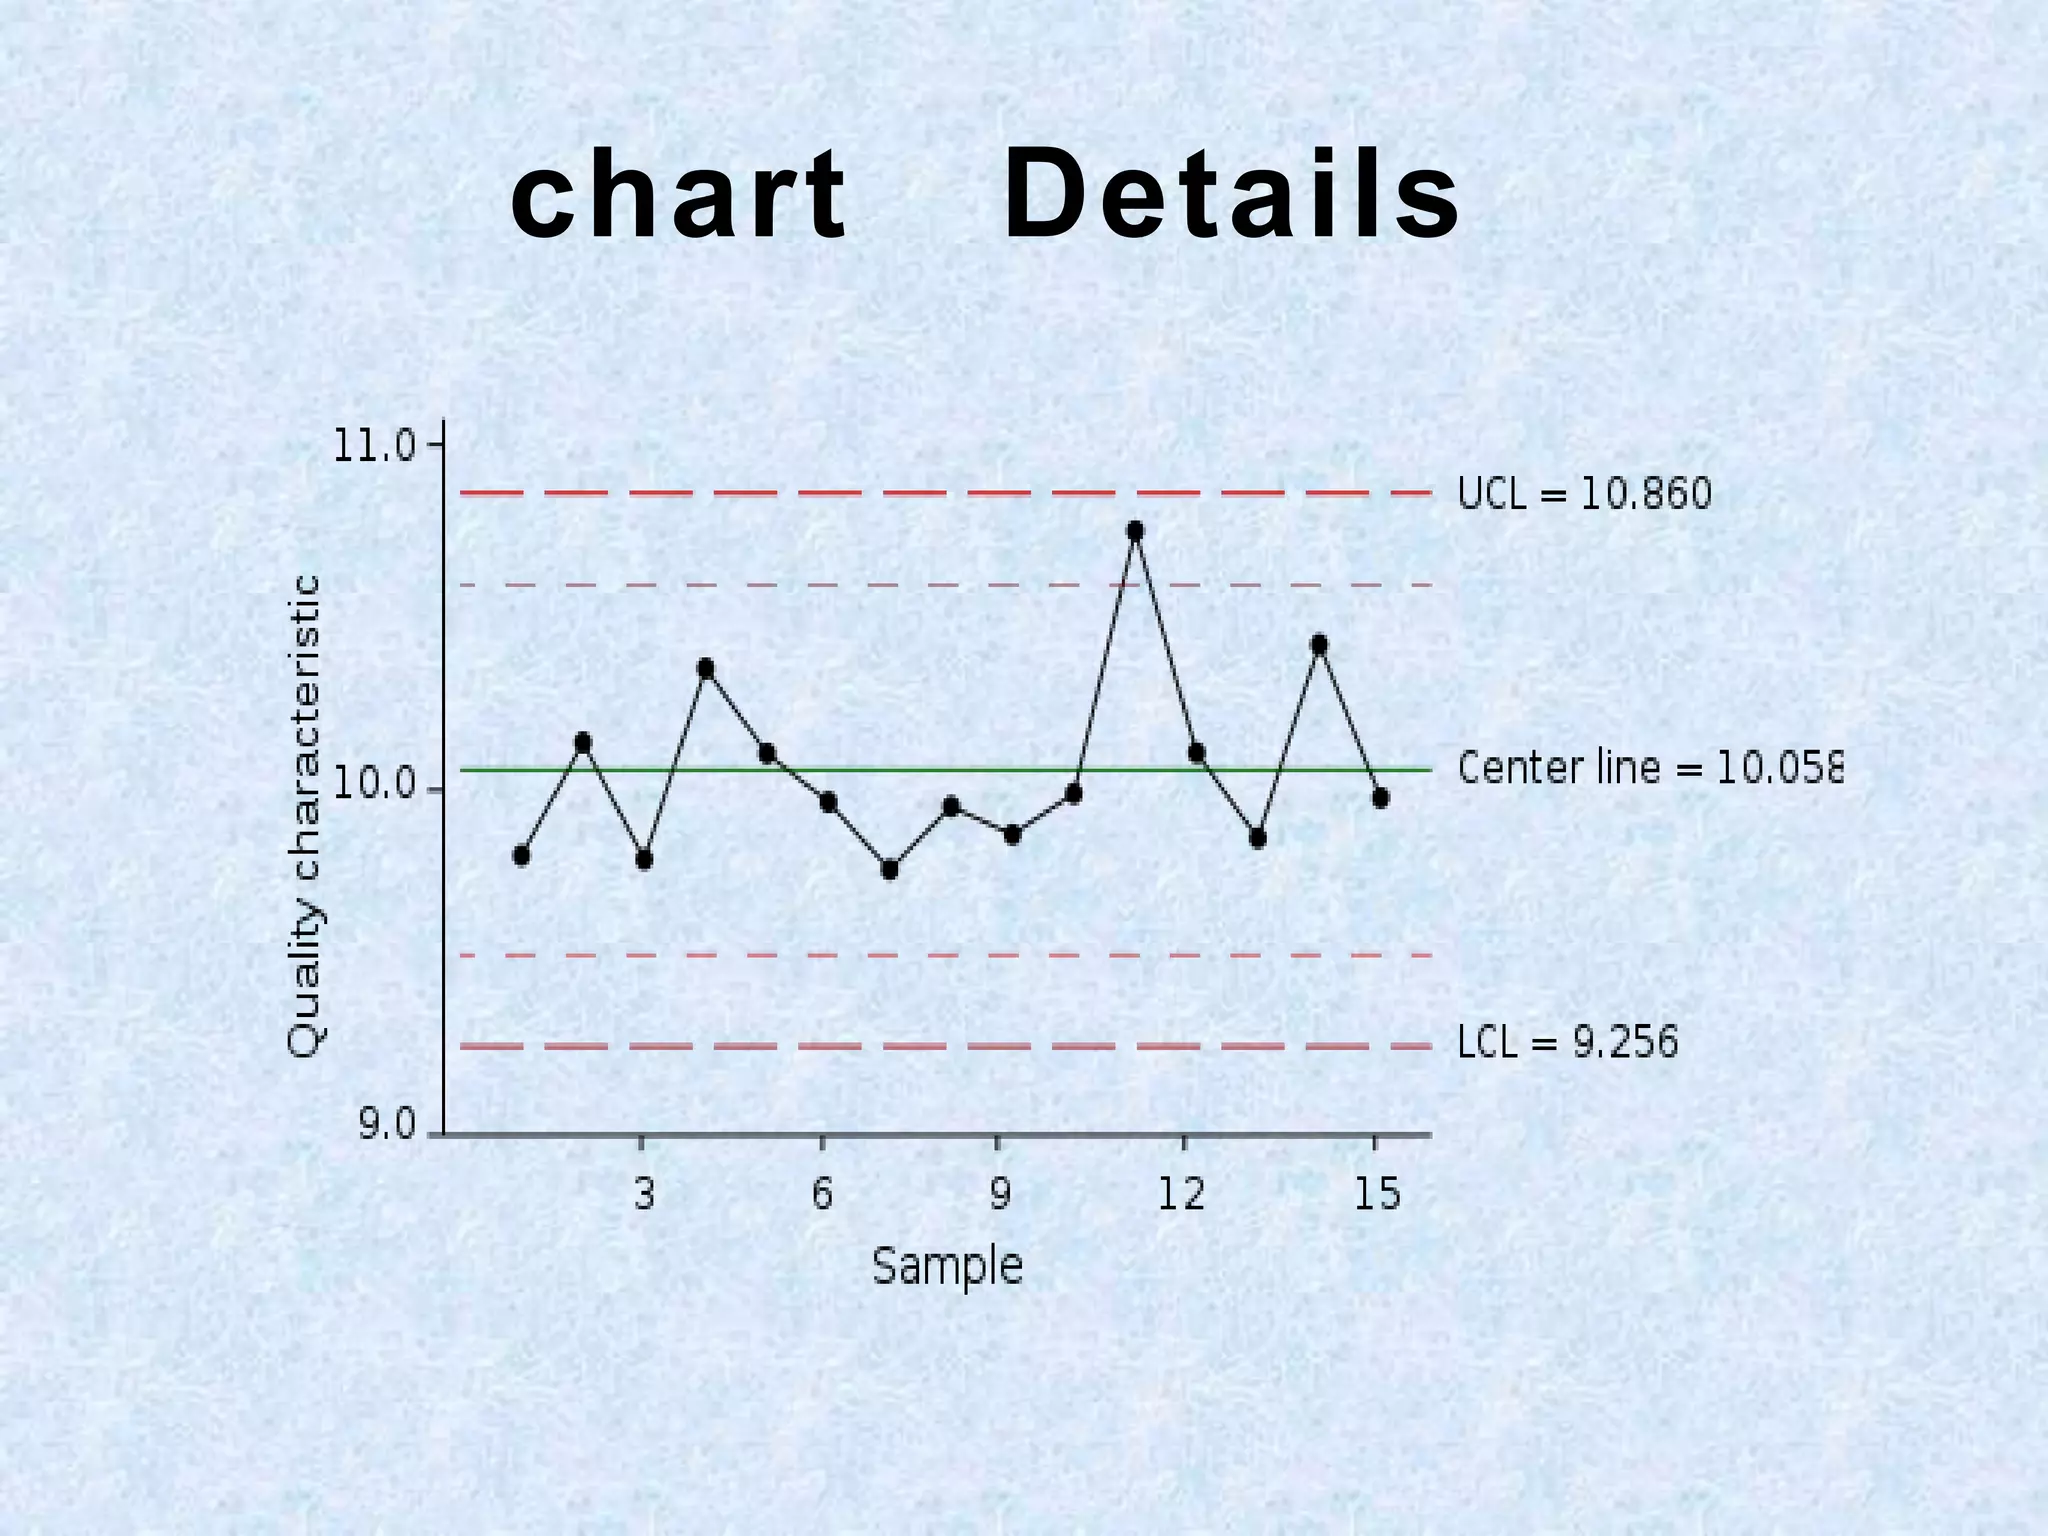
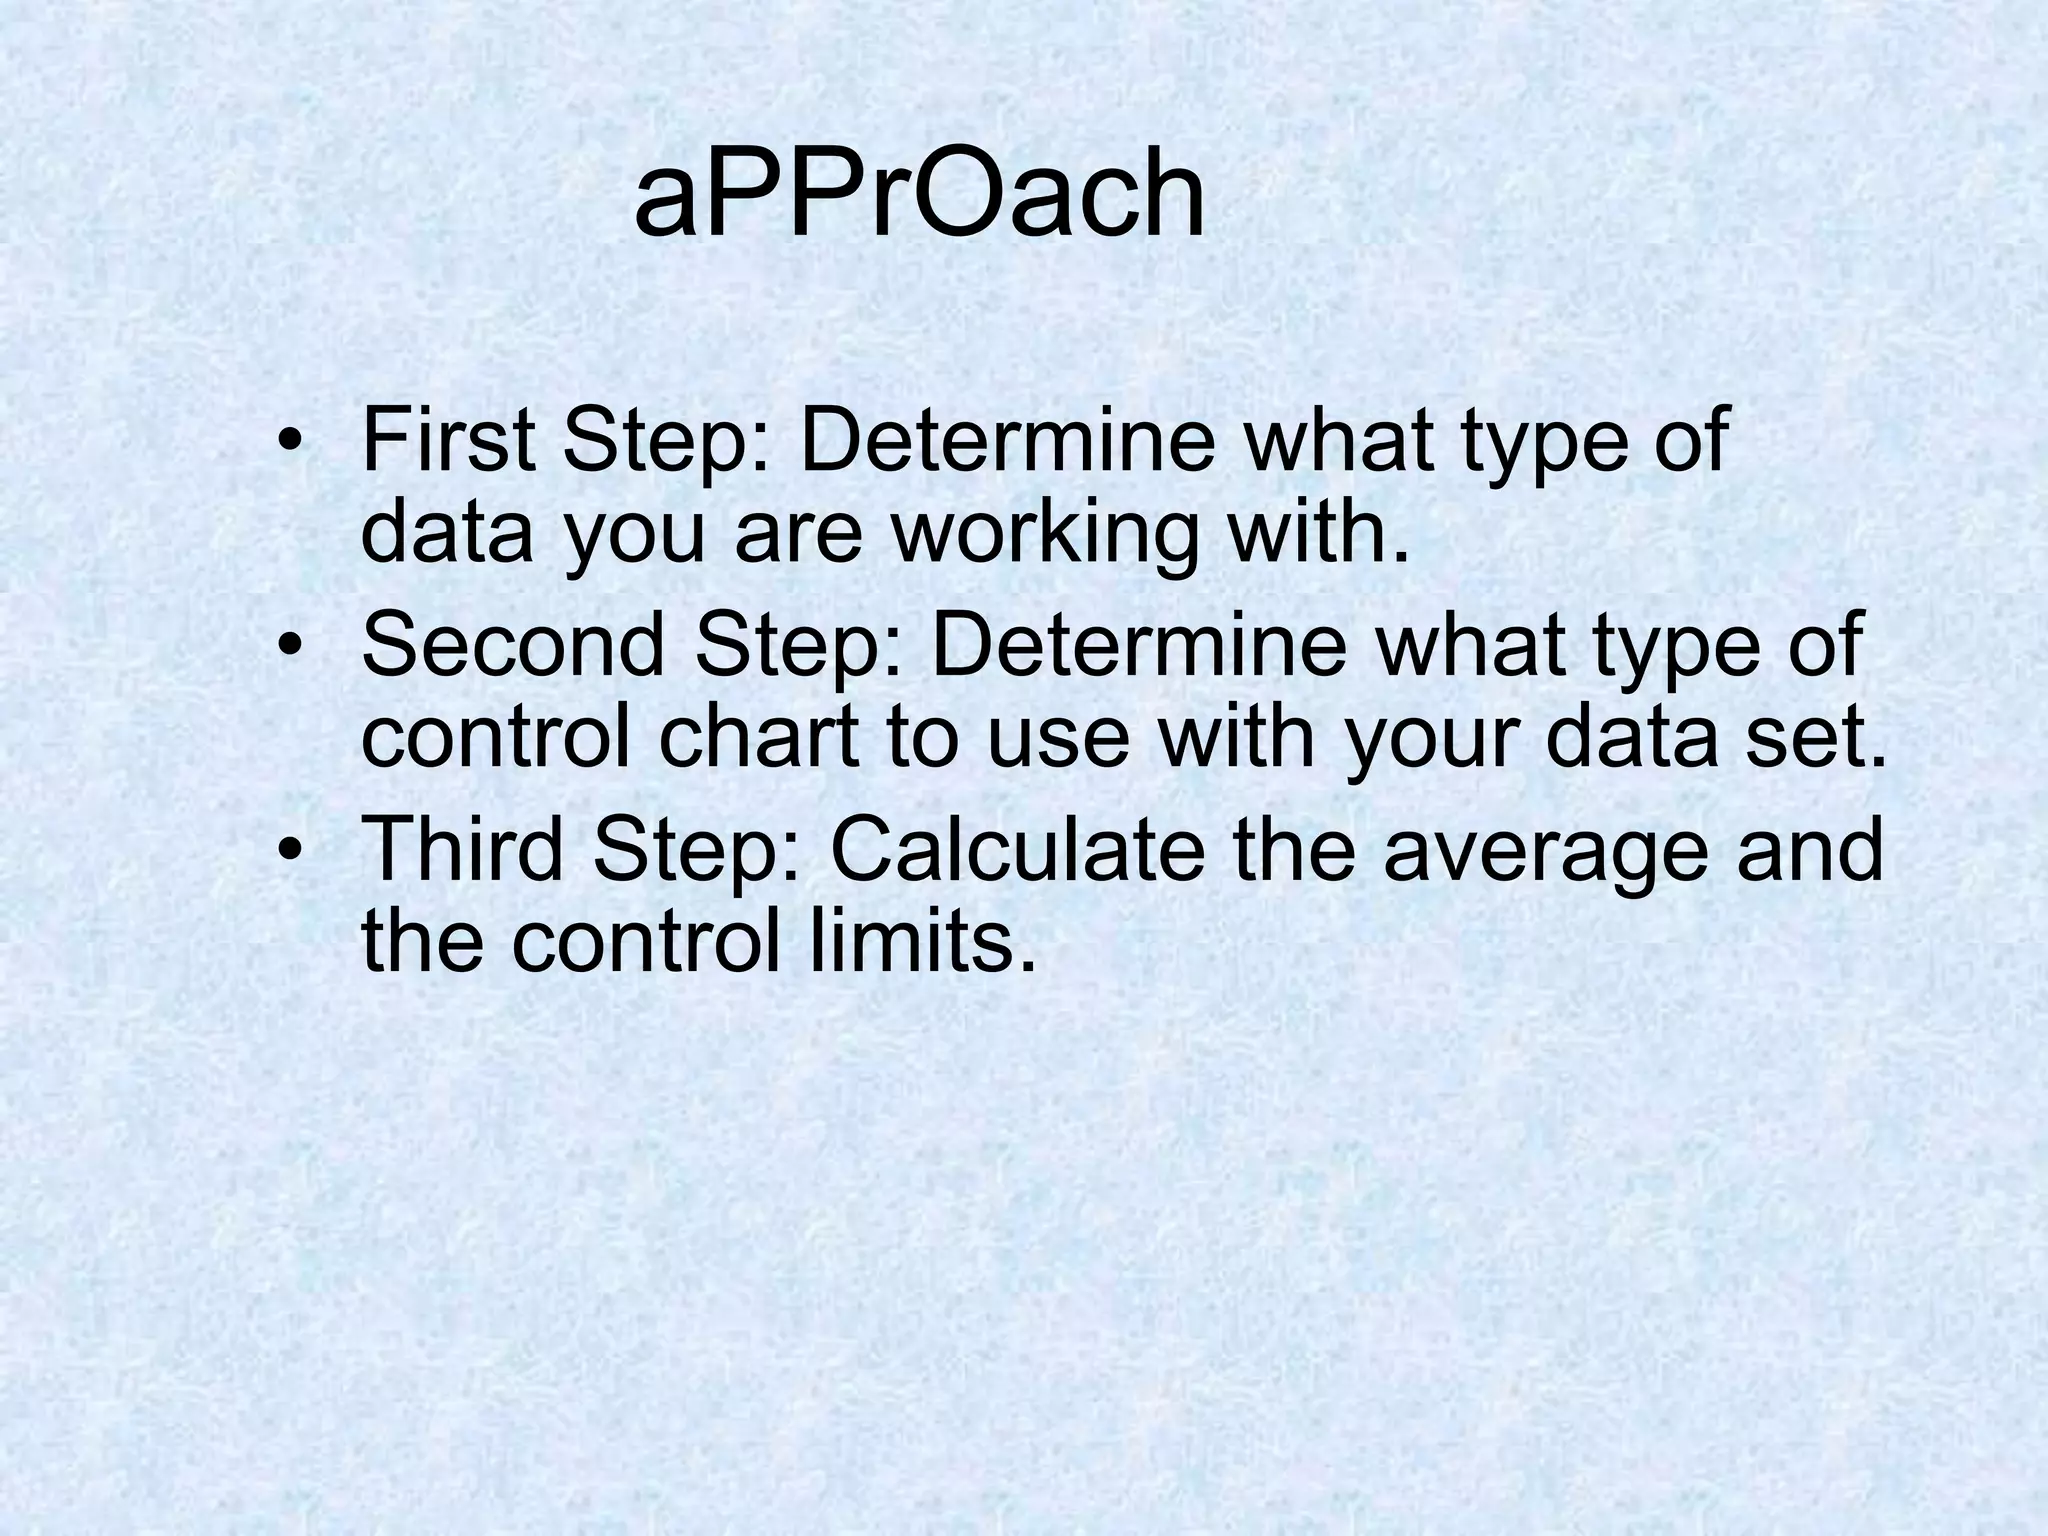
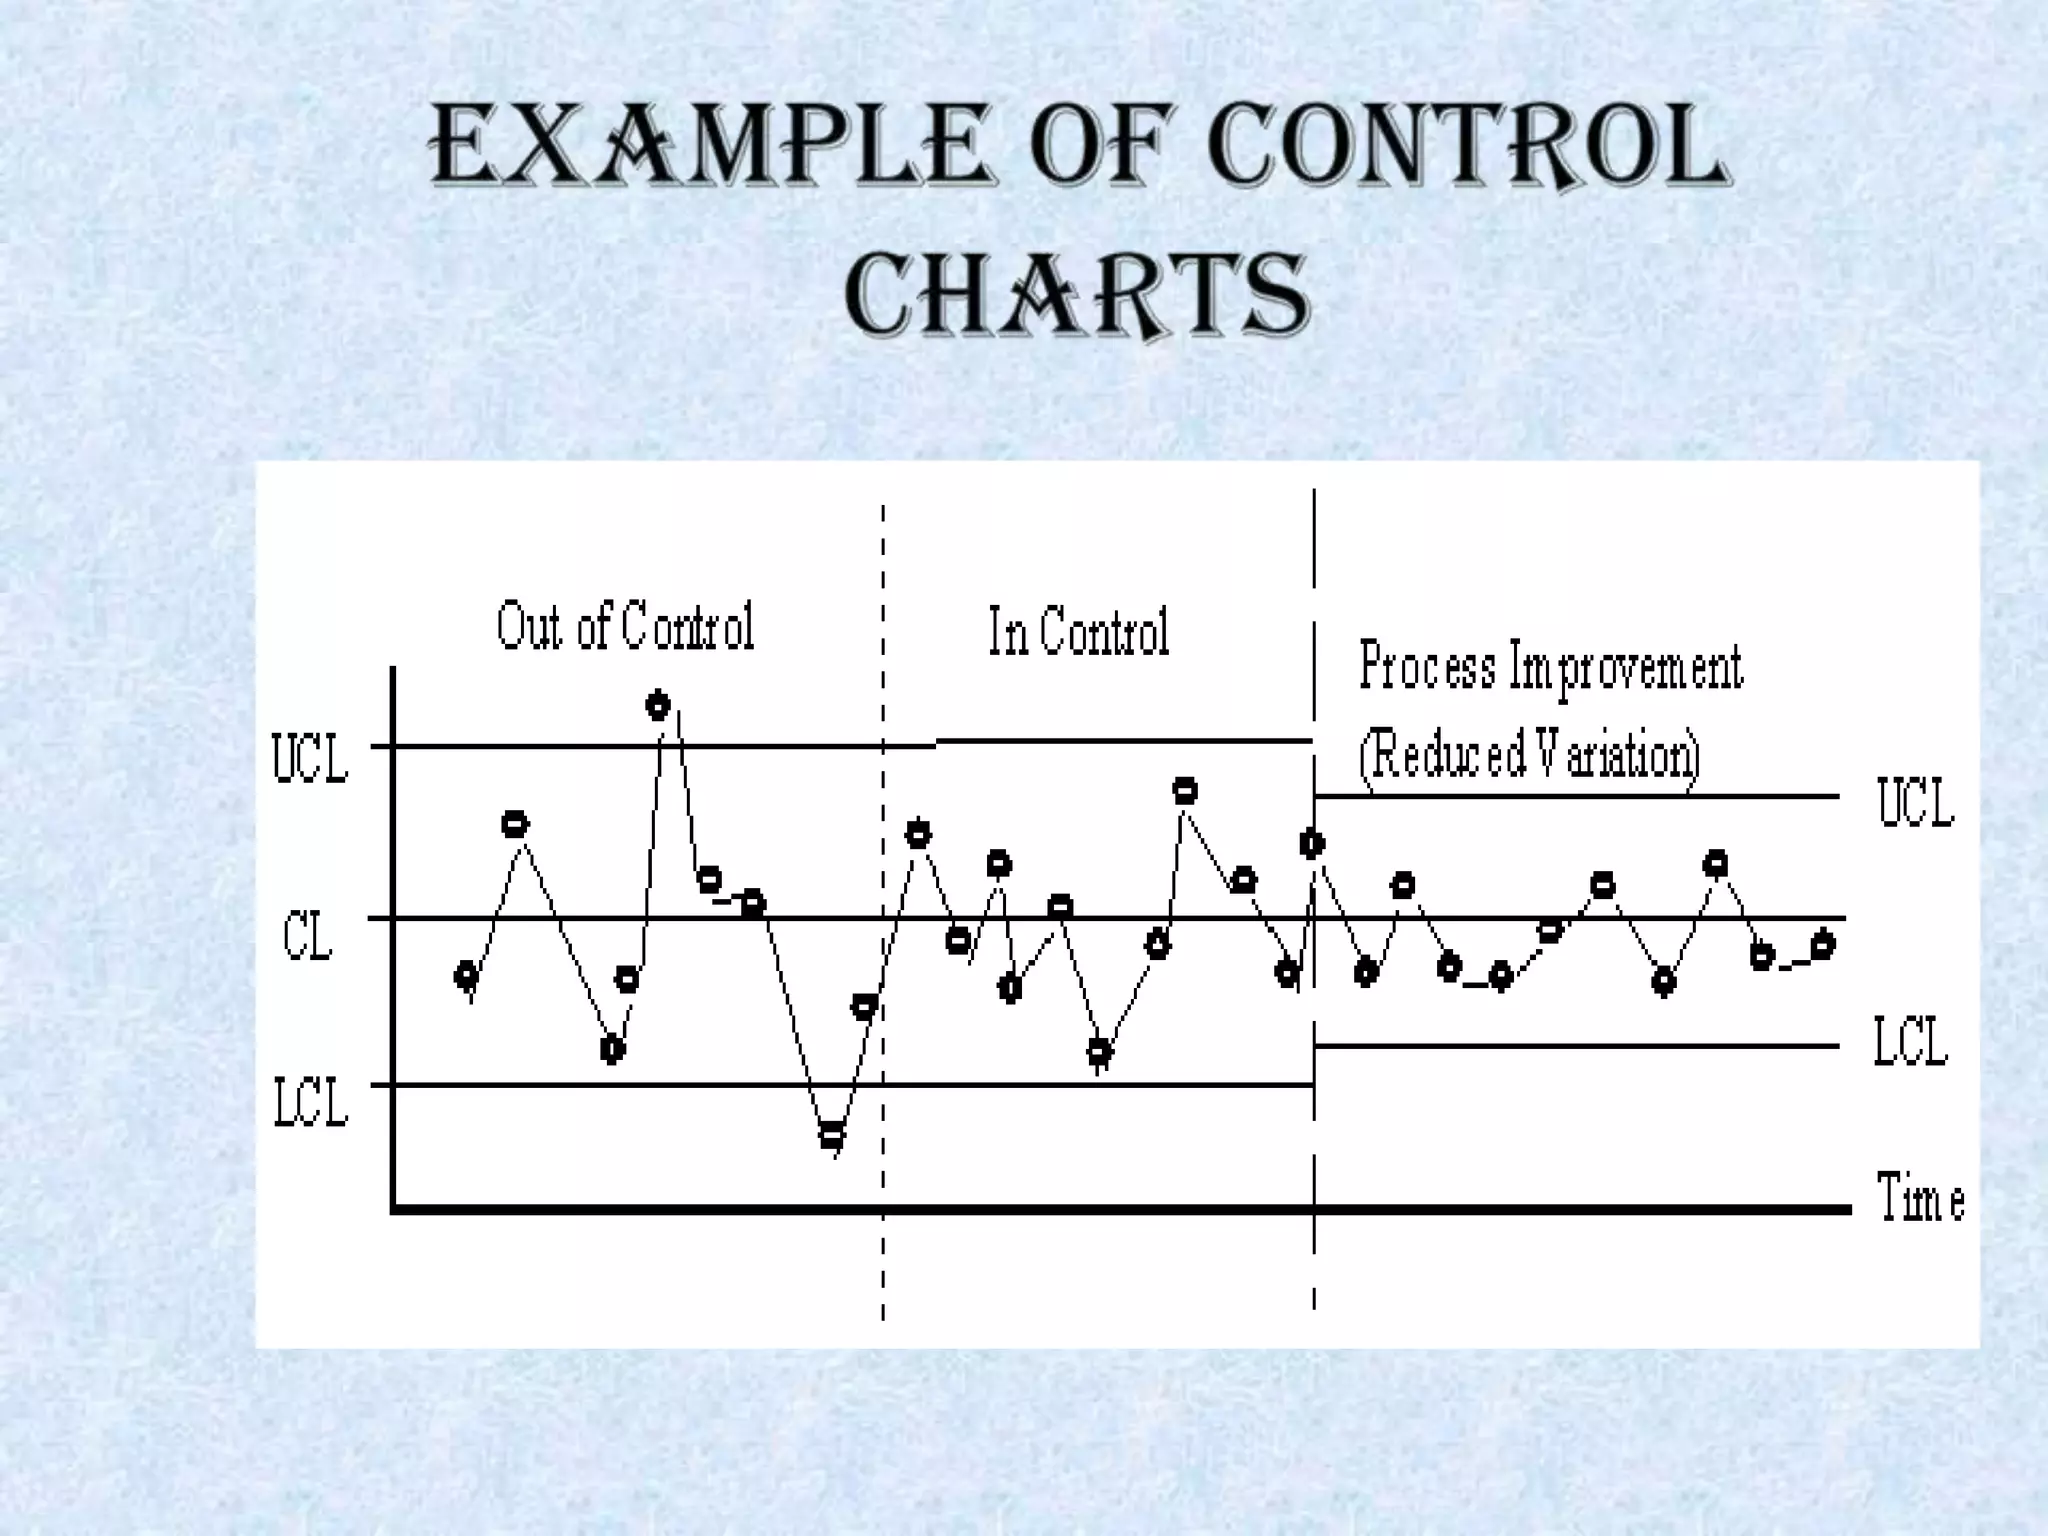
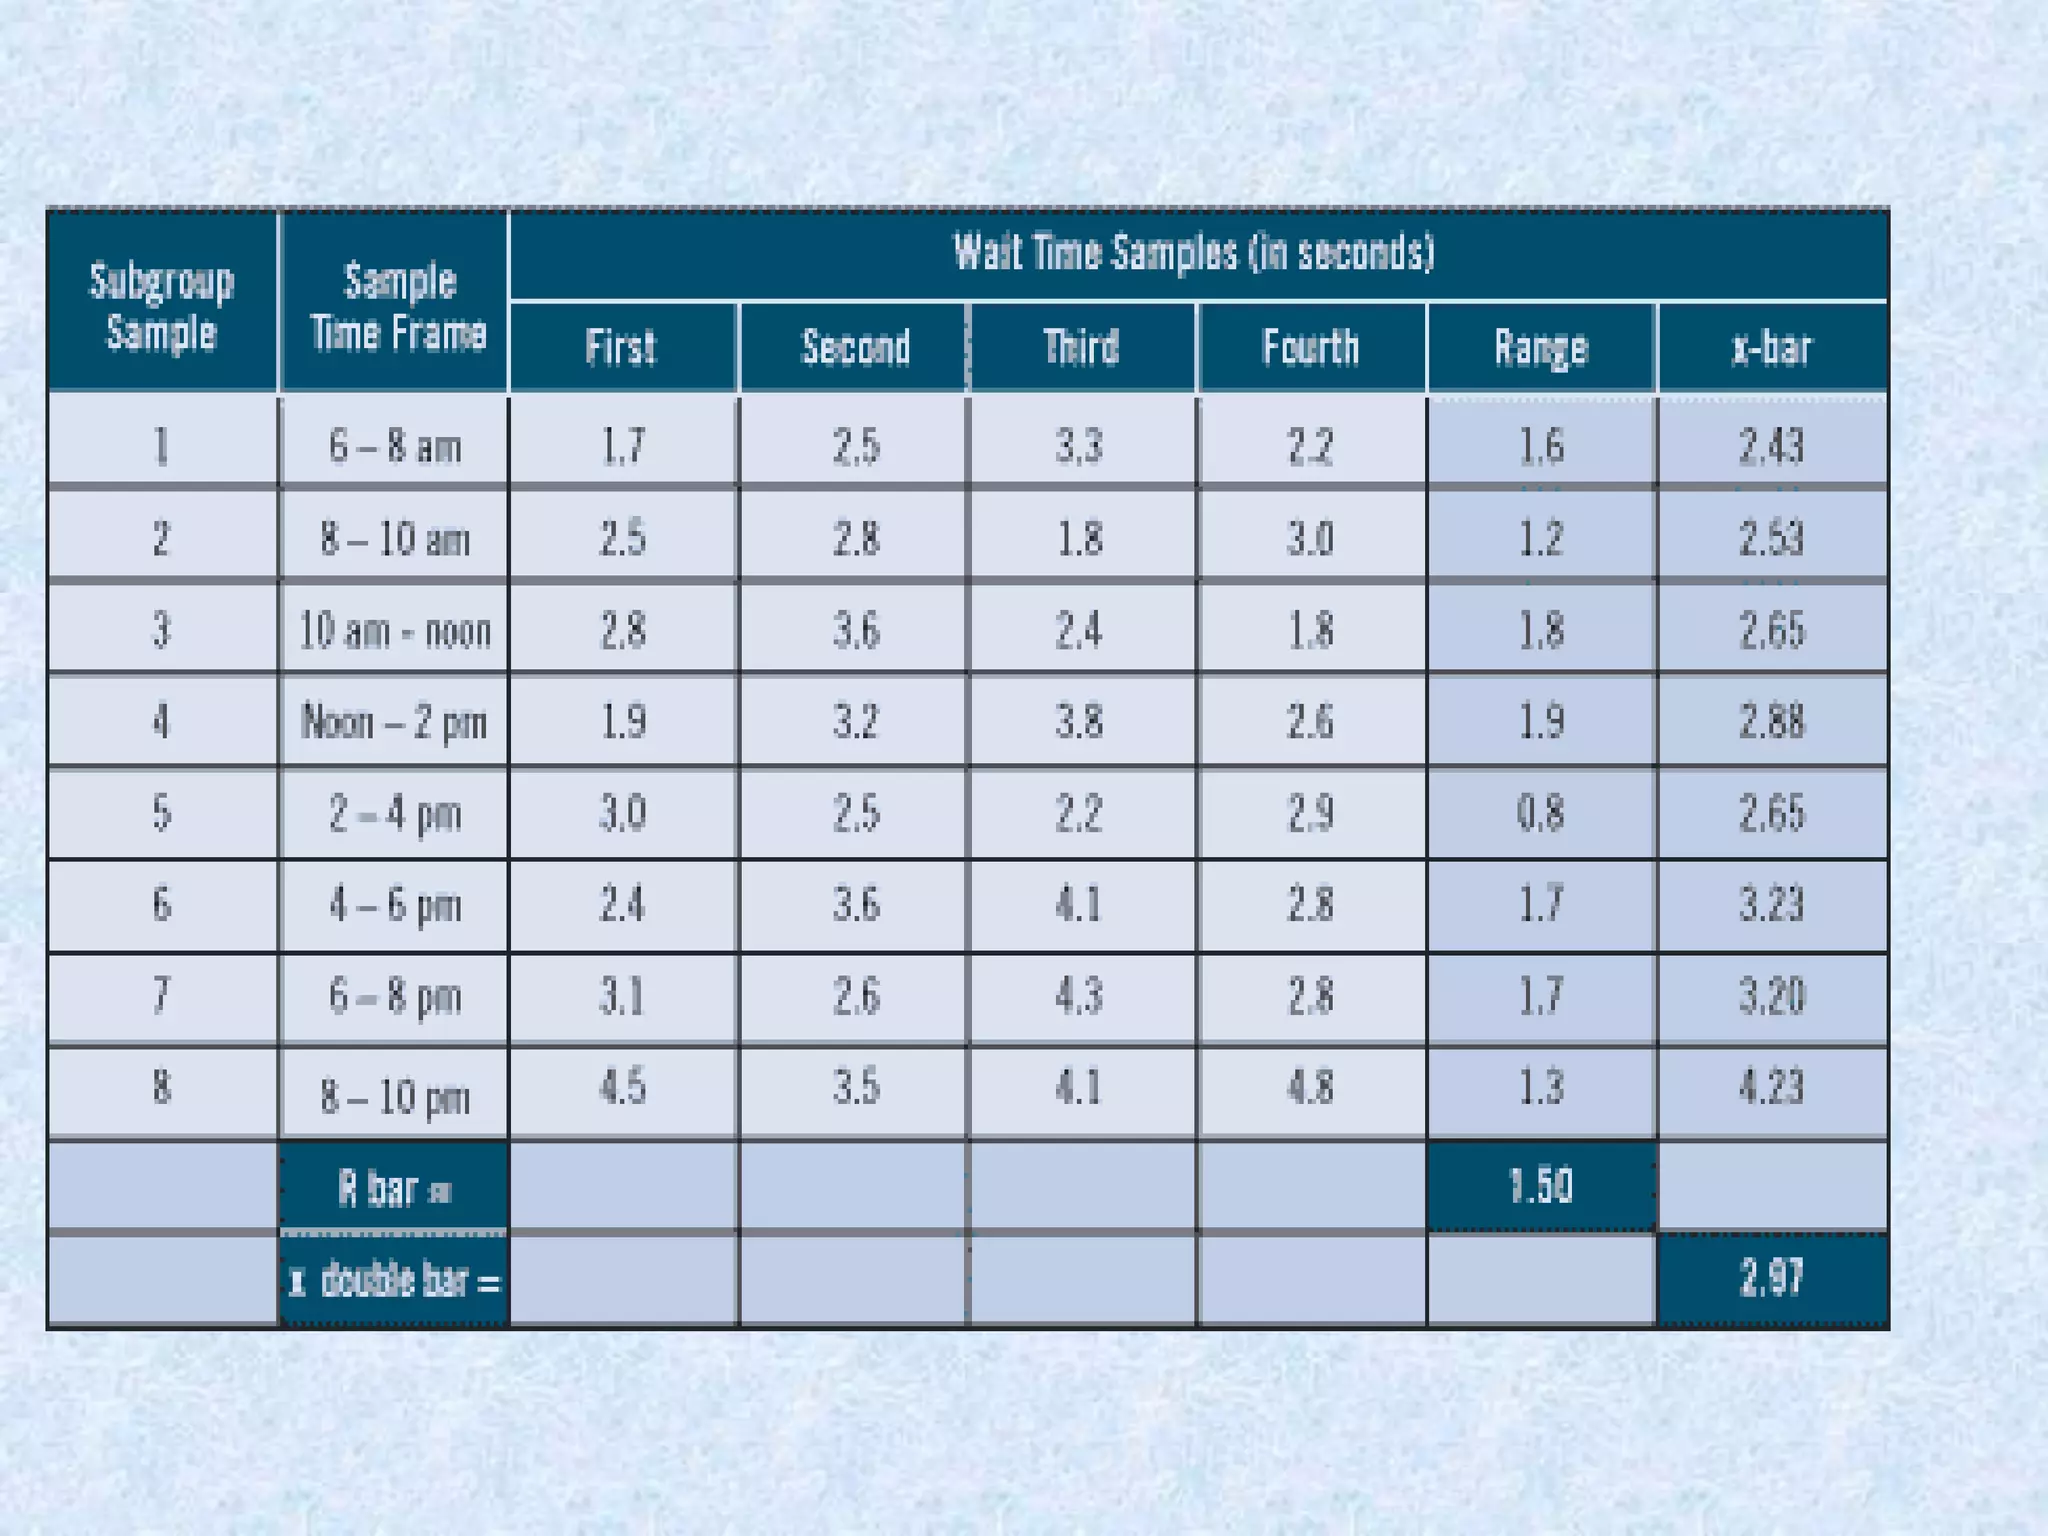
This presentation discusses control charts, which graphically represent collected quality data to detect variations in a production process. Control charts have several purposes and advantages, including indicating whether a process is in or out of control, determining process variability, ensuring product quality, and reducing scrap. There are different types of control charts for variables and attributes. Variable charts measure dimensions while attribute charts classify items as defective or not. The presentation focuses on X-bar and R-bar charts for variables. X-bar charts show central tendency while R-bar charts show spread. When used together, they provide powerful diagnosis of quality problems. Steps for using control charts include determining the data type, selecting the appropriate chart, calculating averages and control limits, and plotting the


![[BROCHURE] Italy Tour Project | @SlideON](https://cdn.slidesharecdn.com/ss_thumbnails/brochure8-251215152319-2805af68-thumbnail.jpg?width=640&height=640&fit=bounds)


