
Recommended
More Related Content
Similar to STATISTICAL PHARMACEUTICAL QUALITY CONTROL
Similar to STATISTICAL PHARMACEUTICAL QUALITY CONTROL (20)
Recently uploaded
Recently uploaded (20)
STATISTICAL PHARMACEUTICAL QUALITY CONTROL
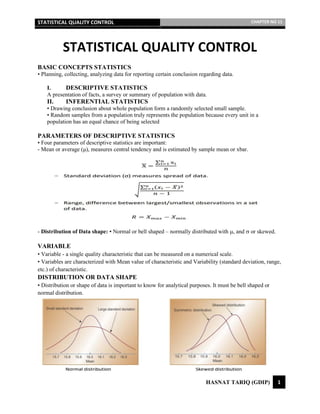
- 1. STATISTICAL QUALITY CONTROL CHAPTER NO 11 HASNAT TARIQ (GDIP) 1 STATISTICAL QUALITY CONTROL BASIC CONCEPTS STATISTICS • Planning, collecting, analyzing data for reporting certain conclusion regarding data. I. DESCRIPTIVE STATISTICS A presentation of facts, a survey or summary of population with data. II. INFERENTIAL STATISTICS • Drawing conclusion about whole population form a randomly selected small sample. • Random samples from a population truly represents the population because every unit in a population has an equal chance of being selected PARAMETERS OF DESCRIPTIVE STATISTICS • Four parameters of descriptive statistics are important: - Mean or average (μ), measures central tendency and is estimated by sample mean or xbar. - Distribution of Data shape: ▪ Normal or bell shaped – normally distributed with , and or skewed. VARIABLE • Variable - a single quality characteristic that can be measured on a numerical scale. • Variables are characterized with Mean value of characteristic and Variability (standard deviation, range, etc.) of characteristic. DISTRIBUTION OR DATA SHAPE • Distribution or shape of data is important to know for analytical purposes. It must be bell shaped or normal distribution.
- 2. STATISTICAL QUALITY CONTROL CHAPTER NO 11 HASNAT TARIQ (GDIP) 2 VARIATION • Variation exists in all processes and may be: I. COMMON OR RANDOM VARIATION • Where causes cannot be identified and are unavoidable. - E.g., Differences in process variables, i.e., tablet diameter, weight, etc. • Common variation is also called as variation built into process. • Standard deviation and Accuracy II. CAUSE-ASSIGNABLE VARIATION • Where causes of variation can be identified and eliminated. - E.g., Poor training, worn tools, machine needing repair. • Cause-assignable variation are also called as special or non-routine events. QUALITY ASPECTS • Two aspects of quality: - Features: More attributes meet desirability = high quality. - Freedom from defect = fewer defects = higher quality. STATISTICAL QUALITY CONTROL • SQC is set of statistical tools used in assessing quality characteristics or parameters of a process, thus also called as Statistical Process Control (SPQ). • SQC or SPQ tool is a Control chart used in monitoring variation in the characteristics of a product/process. • Control chart is a graph, plotted in time order used to study how a process changes (variates) over time. CONTROL CHARTS • Control Chart always shows sample data on a graph with central control limit (CL), upper control limit (UCL), and lower control limit (LCL) • Limits as lines on graph are determined from historical data. • Upper and lower control limits represent 3 standard deviations above and 3 standard deviations below mean line, respectfully. When to use control charts? • When controlling ongoing processes by finding and correcting problems as they occur • When predicting the expected range of outcomes from a process
- 3. STATISTICAL QUALITY CONTROL CHAPTER NO 11 HASNAT TARIQ (GDIP) 3 • When determining whether a process is stable (in statistical control) • When analysing patterns of process variation from special causes (non-routine events) or common causes (built into the process) • When determining whether your quality improvement project should aim to prevent specific problems or to make fundamental changes to the process Why 3 sigma is taken? • Reasons for taking 3 : - Probability that a random value of measurement falls in-between 3-σ limits is 0.9973, which is very high. - On other hand, probability that a random value of sample falls outside of 3-σ limits is 0.0027, which is very low. - Thus, when values fall in-between 3-σ limits, variations are attributed due to chance variation, then process is considered to be statistically controlled. - But, when one or many values fall out of 3-σ limits, variations are attributed to assignable variation and process is said to be not under statistical control. • By comparing current data to these lines, Conclusions can be drawn about whether process variation is consistent (in control) or is unpredictable (out of control, affected by special causes of variation).
- 4. STATISTICAL QUALITY CONTROL CHAPTER NO 11 HASNAT TARIQ (GDIP) 4 CONTROL CHARTS – TYPES • Types of control charts are presented below: CONTROL CHARTS – SHEWHART • Control chart for variables is used to monitor a measurable continuous characteristic, e.g., weight, diameter, etc. CONTROL CHARTS FOR VARIABLES • Control charts for variable are: - X-bar Chart - R-Chart • Both, x-bar chart and R-chart are used as pair. • This type of chart graphs the means (or averages) of a set of samples, plotted in order to monitor the mean of a variable, for example the length of steel rods, the weight of bags of compound, the intensity of laser beams, etc.
- 5. STATISTICAL QUALITY CONTROL CHAPTER NO 11 HASNAT TARIQ (GDIP) 5 • In constructing this chart, samples of process outputs are taken at regular intervals, the means of each set of samples are calculated and graphed onto the X bar control chart. • This chart can then be utilized to determine the actual process mean, versus a nominal process mean and will demonstrate if the mean output of the process is changing over time. Mean of the process changing over time. •This type of chart demonstrates the variability within a process. It is suited to processes where the sample sizes are relatively small, for example <10. Sets of sample data are recorded from a process for the particular quality characteristic being monitored. • For each set of date, the difference between the smallest and largest readings are recorded. This is the range “R” of the set of data. The ranges are now recorded onto a control chart. The center line is the averages of all the ranges. • x-bar and Range charts are SQC tools used to monitor variables data when samples are collected at regular intervals from a process. • Assume process is normally distributed, and fraction nonconforming can be found by: P (x < LCL) + P (x > UCL), i.e., beyond limits. • x-bar chart detects changes in mean value of a quality characteristics across all units or a process • x-bar monitor central tendency. • R-chart detects dispersion or variability, changes in range (standard deviation of quality characteristics across all units of a process. • R-charts monitor the dispersion. • In general, xbar chart is insensitive to small departures from normality. • R chart is more sensitive to non-normality than the xbar chart • Process can show acceptable central tendencies on x-bar chart but unacceptable variability on R-chart OR acceptable variability on R-chart but unacceptable central tendencies on x-bar • Thus, R-chart is interpreted first: - If R-chart is in control, interpret the X-bar chart (i) if in control, process is in control; (ii) if out of control: process average is out of control. - If R-chart is out of control, process variation is out of control then investigate cause; no need to interpret the X-bar chart • X-bar and R-bar Charts reveal different problems: - Shift in mean in x-bar chart but not be R-chart - Shift in dispersion in R-chart but not be x-bar chart
- 6. STATISTICAL QUALITY CONTROL CHAPTER NO 11 HASNAT TARIQ (GDIP) 6 • Control charts for attributes are: - p-Chart - c-Chart • P-Charts are used for quality characteristics that are discrete and involve yes/no or good/bad decisions. - E.g., Number of leaking tubes in a lot of 48 • C-Charts are used for discrete defects when there can be more than one defect per unit. - E.g., Number of flaws on a tablets P-CHARTS • A statistical control chart that plots proportion for defective sample (p) over time Involves taking of sample and each item is inspected for determining sample proportion defective by dividing the number of defective items by sample size. • P charts are utilized where there is a pass / fail determination on a unit inspected. The p chart will show if the proportion defective within a process changes over the sampling period (the p indicates the portion of successes). • In the p chart the sample size can vary over time. A similar chart to the p chart is the np chart. However, with the np chart the sample size needs to stay constant over the sampling period.
- 7. STATISTICAL QUALITY CONTROL CHAPTER NO 11 HASNAT TARIQ (GDIP) 7 • An advantage of the np chart is that the number non-conforming is recorded onto the control rather than the fraction non-conforming. Some process operators are more comfortable plotting the number rather than the fraction of non-conformances. • Plot the sample proportion defective on the control chart and compare with UCL and LCL to determine if process is out of control • Mean = p, Sd = Sigma C-CHART • C-chart for number (count) of defects per unit plots movement in the number of defects per unit. • Randomly selected one item and number of defects are counted in that item. • Number of defects are plotted on control chart which are compared with UCL and LCL to determine if process is out of control. ▪ Sd=SQR of mean ▪ UCL= C + 3.SQR of mean ▪ LCL=C – 3. SQR of mean • The c chart is used where there can be a number of defects per sample unit and the number of samples per sampling period remains constant. • In the u chart, again similar to the c chart, the number of defects per sample unit can be recorded, however, with the u chart, the number of samples per sampling period may vary. CONTROL CHARTS – PROCESS ACCEPTANCE CONTROL CHARTS • Charts that give information about capability of process relative to its specification limits (not mean). • These charts estimates fraction of nonconforming items deviating specification limit for any process. • In these charts, CL is Specification limit (SL), LCL is LSL and USL • Specification for assay of Active ingredient is 95-105 % and an ideal target specification is 100%. • In the real world, results vary 90% , 98.5%, 104% , 110 % etc. and mean may be different from the target specification, i.e. 108% vs 100%
- 8. STATISTICAL QUALITY CONTROL CHAPTER NO 11 HASNAT TARIQ (GDIP) 8 Difference between 2 types of Charts CONTROL CHARTS – PROCESS 1. Setting limits and Zones 2. Process procedure 3. Pattern Analysis 4. Interpretation 1. A. SETTING LIMITS • Control limits are functions of natural variability of process • Natural tolerance limits represent natural variability of process (usually set at 3-sigma from mean) • Specification limits are determined by regulatory bodies, e.g., FDA. • Specification width and process variability Shewhart Control Charts Acceptance Control charts Central Line is practical average/mean deduced from data, 101% Central line is the target specification 100 % Indicates how process is behaving from practical calculated mean? Indicates how process is behaving from theoretical set target specification? A process consistency – may not be within regulatory spec, for example mean is 108 %, SD 1.2, YES, the process is consistent, but it is not meeting SPECIFICATION Tells that process consistency with respect to the Regulatory Registered Specification. Used during development setting of specifications Tells, once specification is set, how the process is behaving with respect to the set specification. Parameters include UCL, CL, LCL Parameters include USL, SL and LSL and the Process Capability ratio (Cp) and Process Capability Index (CPk)
- 9. STATISTICAL QUALITY CONTROL CHAPTER NO 11 HASNAT TARIQ (GDIP) 9 1. B. Assigning different Zones • For interpretation of pattern on charts, data is represented over 6 standard deviations, 3 standard deviations from mean line to UCL and 3 from mean to the LCL. • To help analyze charts, the chart area is divided into 6 sections A, B, and C representing the standard deviations. EXAMPLE OF R-CHART WITH ASSIGNED ZONES • Example of R chart with assigned zones is given below: 2. PROCESS PROCEDURE • Random sampling of output of a process • Inspecting output from a process for measuring the quality characteristics • Charting as graph with set CL, UCL and LCL • Helpful in identifying in-process variation • Acceptance sampling used to randomly inspect a batch of products to determine acceptance/rejection 3. PATTERNS OF POINTS • Position of points on control chart makes patterns of data distribution. • Pattern of point distribution with reference to UCL and LCL and 6 zones on the graphs are observed. • An unusual or nonrandom pattern in the data: - Number of points outside of control limits
- 10. STATISTICAL QUALITY CONTROL CHAPTER NO 11 HASNAT TARIQ (GDIP) 10 - Cyclic Patterns - Shift in process level (all above/below CL) - Trend (increasing/decreasing) - Stratification (3 up and 3 down) • Patterns of points provide useful diagnostic information on process which is used to make process modifications that reduce variability. • Pattern tell when there is a problem in process. 4. INTERPRETATION • Sample observation (points) consistently below CL
- 11. STATISTICAL QUALITY CONTROL CHAPTER NO 11 HASNAT TARIQ (GDIP) 11 • Two out of any three successive points fall in zone A of the same side • Four out of any five successive points fall in or beyond zone B of the same side • The Process” behavior” • The process is considered in control for n samples collected if all points are inside control limits and no systematic behavior is identified • Above indicates that trial control limits are suitable for controlling current or future production. • If points plot out of control, then control limits must be revised. • Before revising, identify out of control points and look for assignable causes.
- 12. STATISTICAL QUALITY CONTROL CHAPTER NO 11 HASNAT TARIQ (GDIP) 12 - If assignable causes can be found, then recalculate control limits. - If no assignable causes can be found then consider control limits as appropriate for current control. CONTROL CHARTS APPLICATIONS • Applied where a process has tendency to go out of control which may be harmful and costly • May be used to study past performance and or to evaluate present conditions. • Helps controlling ongoing processes by finding (and correcting) problems as they occur. • Data collected from control chart may form basis for process improvement. • Helps determine what process adjustments need to be made. • Help predicting expected range of outcomes in a process. • Help determining whether a process is stable or in control. • Help making defects visible. • Help analyzing patterns of process variation from special causes or common causes. • Target quality improvement aim to prevent specific problems or to make fundamental changes to process. • Tool to: - Improve process - Improve productivity - Make defects visible - Zero defects PROCESS CAPABILITY – AN APPLICATION OF PROCESS ACCEPTANCE CONTROL CHART • Acceptance charts help in determining capability/feasibility of a process • Two parameters of process capability are: - Process Capability Ratio (Cp) - Process Capability Index (Cpk) PROCESS CAPABILITY RATIO • Process-Capability Ratio (Cp) is used to express process capability. • A way to deal with quality of product by devising quantifiable measurements of quality element • Involves assessing process variability relative to preset product specifications • Cp assumes that the process is centered in the specification range. 𝐶𝑝 = 𝑈𝑆𝐿 − 𝐿𝑆𝐿 / 6𝜎 • Cp > 1 indicates that process exceeds minimal specifications (a low number of nonconforming items are being produced). • Cp = 1 reflects process variability just meets the specifications (about 0.27% nonconforming units are being produced). • Cp < 1 reveals that process is not capable of producing within specifications (a large number of nonconforming items are being produced. PROCESS CAPABILITY INDEX • Process Capability Index (Cpk) helps to address a possible lack of centering of the process. 𝐶𝑝𝐾 = 𝑚𝑖𝑛 ( 𝑈𝑆𝐿 − 𝜇 /3𝜎 , 𝜇 − 𝐿𝑆𝐿 /3𝜎 ) - Where, min is a function which outputs the minimum value of the given value from above 2 resultant values. • Cpk is less than 1, revealing that the process is not capable.