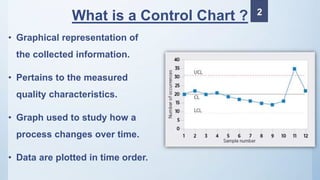
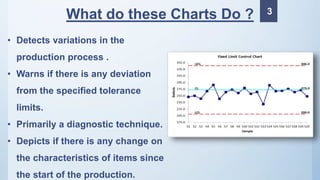
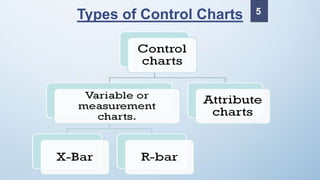
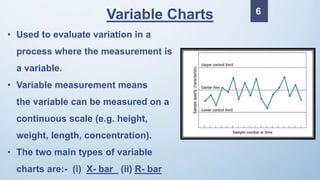
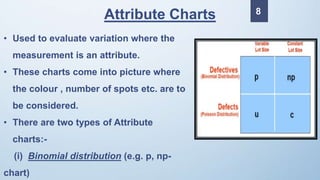
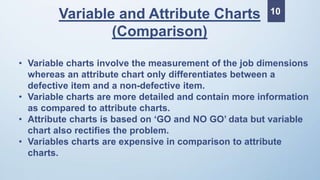
Control charts are graphical representations used to monitor quality characteristics of a process over time. They detect variations in production processes and warn of any deviations from tolerance limits. The main types of control charts are variable charts, used for continuous measurements like height or weight, and attribute charts, used for characteristics measured as attributes like defects. Variable charts are more detailed and informative but also more expensive than attribute charts. Control charts have advantages like indicating whether a process is in control and reducing scrap.