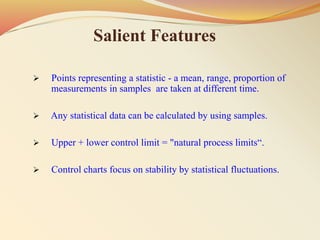
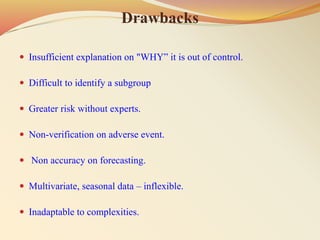
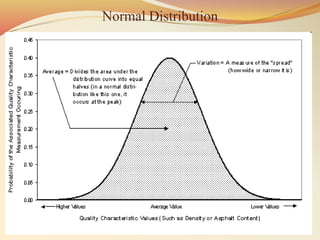
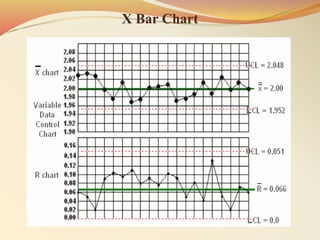
This is the statistical tool used in quality control and a graphical technique that represents whether the process is in the state of statistical control, or not or any variations are expected.
This document provides an overview of control charts, including:
- Control charts are statistical tools used to monitor processes over time by analyzing variation. They have a central line for the average and upper and lower control limits.
- Walter Shewhart invented control charts in the 1920s to reduce failures and repairs in telephone transmission systems by distinguishing between common and special causes of variation.
- There are variable control charts that monitor continuous data using statistics like the mean and range, and attribute control charts that monitor discrete data using statistics like defects per sample.
- Examples of control charts discussed include X-bar and R charts for variables, and P and NP charts for attributes. An example problem demonstrates how to construct and
Control charts are graphs used to study how a process changes over time by plotting data points in time order. A control chart contains a central line for the average, and upper and lower control limits determined from historical data. There are variable control charts that measure things like weight, and attribute control charts that count outcomes like defects. Control charts help determine whether a process is stable or experiencing unusual variations so quality can be ensured. While useful, control charts have been criticized for how they model processes and compare performance.
The document discusses control charts and run charts. Control charts were first developed by Walter Shewhart in 1924 to monitor process stability and control. They distinguish between common cause and special cause variation. Run charts plot process data over time to detect trends or shifts. They have seven steps: select a measure, gather minimum 10 data points, make a graph with vertical and horizontal axes, plot the data chronologically, and add a center line. Both charts aim to only address non-random variation warranting process improvement actions.
This presentation provides an overview of control charts, including what they are, their purposes and advantages, different types of control charts, and how to construct and interpret them. Control charts graphically display process data over time to determine whether a manufacturing or business process is in a state of statistical control. The presentation discusses variable and attribute control charts, and specific charts like X-bar and R-bar charts. It provides examples of how to calculate control limits and plot data on a chart, and how to interpret results to determine if a process is capable or needs improvement. A case study example analyzing wait time data from a hotel management company is also reviewed.
Control charts are used to monitor process variables over time in various industries and organizations. They tell us when a process is out of control by showing data points outside the control limits. When this occurs, those closest to the process must find and eliminate the special cause of variation to prevent it from happening again. Control charts have basic components like a centerline and upper and lower control limits. They are constructed by selecting a process, collecting data, calculating statistics and control limits, and plotting the results over time. Control charts come in two types - variables charts for continuous measurements and attributes charts for counting items. Common and special causes can lead to variations monitored by these charts.
Statistical quality control presentationSuchitra Sahu
Here are the key steps to construct a C-chart for this example:
1. Count the number of defects (misspelled words) in each sample (newspaper edition)
2. Calculate the average number of defects per unit (C=average number of defects)
3. Calculate the upper and lower control limits
4. Plot the number of defects for each sample versus the sample number
5. Analyze for points outside the control limits to identify periods where the process is out of control
Does this help explain the basic approach to constructing a C-chart? Let me know if you need any clarification or have additional questions.
Control charts and statistical process control (SPC) allow companies to monitor processes, detect issues, and enact improvements. Control charts display process data over time and help identify when processes are behaving unusually due to "special causes." SPC uses statistics to set control limits on charts and determine whether a process is in or out of statistical control. Implementing control charts involves selecting processes and variables to measure, collecting baseline data to create charts, training operators, and continuously monitoring and improving processes.
Statistical Process Control & Control ChartShekhar Verma
Statistical Process Control (SPC) uses control charts to monitor processes over time and identify sources of variation. Control charts graph key data metrics and establish control limits to determine whether the process is in a state of statistical control or if special causes are present. The benefits of SPC include early detection of quality issues, reduced waste, and improved process cycle times and customer satisfaction through a diminished likelihood of rework.
The document discusses the seven basic tools of quality control: cause and effect diagram, flowchart, checklist, control chart, Pareto chart, histogram, and scatter diagram. These tools help identify quality problems and their causes. Control charts specifically monitor whether a process is operating as expected and include variables control charts and attributes control charts. Statistical process control and acceptance sampling are also statistical quality control techniques.
Control charts are statistical tools used to determine whether a manufacturing or business process is stable and predictable or experiencing unpredictable variation. Walter Shewhart invented control charts in the 1920s at Bell Labs to monitor telephony processes. Control charts plot process data over time along with an average line and upper and lower control limits set at 3 standard deviations from the average. As long as data points remain within the control limits, the process is considered in a state of statistical control and predictable. Points outside the limits suggest an unpredictable special cause of variation that requires investigation. Control charts allow detection of changes in a process's natural variation that may require adjusting process parameters.
Control charts are a statistical tool used to determine if a process is in or out of control. There are two main types of control charts: variable control charts which deal with measurable items and attribute control charts which factor in quality attributes. Control charts help improve processes by making defects visible and determining what adjustments are needed. They are calculated by finding the average, upper control limit, and lower control limit of a sample data set and plotting the points on a chart.
This document provides a summary of a presentation on Statistical Process Control (SPC). It outlines the contents, which include an introduction to statistics, control charts, process capability, and implementing an effective SPC system. It also describes how to order the presentation and notes it will be delivered via download as a PowerPoint file licensed for a single facility. The presentation is priced at $49 and provides information to help users understand and apply SPC within their organization.
The document provides information on different types of control charts used for statistical process control, including X-bar and R charts, X-bar and S charts, and moving average-moving range (MA-MR) charts. X-bar and R charts monitor both the average value and variation in a process over time using subgroup means and ranges. The construction process, chart interpretation, and an example are described. X-bar and S charts are similar but use standard deviation instead of range. MA-MR charts are beneficial when data is collected slowly over time using moving averages and ranges to monitor process location and variation.
This document discusses various statistical quality control charts used to monitor manufacturing processes, including control charts, X-bar charts, R-charts, C-charts, P-charts, and NP-charts. A control chart is a graphical display that consists of a central line for the average and upper and lower control limits. X-bar and R-charts are used for continuous numerical data to control variations in average quality and dispersion. C-charts monitor the number of defects per unit while P-charts control the fraction defective. NP-charts simplify P-charts by plotting the number of defectives rather than the fraction. These statistical charts help maintain and improve quality throughout production.
Control charts (also called Shewhart charts) are a powerful statistical quality control tool used for online process monitoring. Control charts detect assignable causes of variation by monitoring the process for points outside the natural limits called control limits. This ensures variations are kept within specification limits, delivering more consistent quality. There are different types of control charts for variables and attributes. Control charts must be acted on if points fall outside control limits or show non-random patterns, indicating the presence of assignable causes that need investigation and elimination.
This document provides an overview of statistical quality control (SQC). It describes the three main categories of SQC as descriptive statistics, statistical process control (SPC), and acceptance sampling. Control charts are discussed as a key SPC tool used to monitor processes and identify variations. The concepts of process capability, six sigma quality levels, and acceptance sampling plans are also introduced.
Quality and statistical process control ppt @ bec domsBabasab Patil
This chapter introduces quality management tools including Deming's 14 points and Juran's 10 steps for quality improvement. It discusses the basic seven quality tools such as flowcharts, histograms and control charts. It focuses on statistical process control charts including X-bar and R charts to monitor numeric data, as well as P and C charts for attribute data. These charts are used to distinguish between common and special cause variation to determine if a process is in or out of control.
Mangt tool with statistical process control ch 18 asif jamalAsif Jamal
It is basic way to understand Total Quality Management
Tools & Procedures of CI
Varies from simple suggestion system based on brain storming to structured programs utilizing statistical process control tools (SPC Tools)
Deming wheel (PDCA) cycle
Zero defect concept
Bench Marking
Six sigma
Kaizen
The document presents information on control charts including what they are, their purpose and advantages, types of control charts, and how to construct and interpret them. Control charts are graphical representations that detect variations in a production process and warn if quality characteristics depart from specified tolerance limits. The main types discussed are X-bar and R-bar charts, with X-bar charts showing changes in the process average and R-bar charts controlling process variability. A case study example on using control charts in the hospitality industry is also included.
After World War II, Japan adopted quality as an economic strategy and selected seven statistical tools to analyze quality problems and drive continuous improvement. The seven tools - Pareto charts, cause-and-effect diagrams, histograms, control charts, scatter plots, check sheets, and flow charts - can identify up to 95% of issues. Each tool has a specific purpose, such as prioritizing problems with Pareto charts or identifying relationships between variables with scatter plots. Using these tools, Japanese companies were able to dramatically improve quality and economic performance.
Control charts are used to monitor processes and determine if they are in a state of statistical control. There are two phases to constructing control charts: Phase I establishes initial control limits using large sample sizes, while Phase II involves ongoing monitoring using smaller sample sizes. Different types of control charts (x-bar, R, p, np) can be used depending on whether the data is variable or attribute. Nelson's rules provide guidelines for interpreting patterns in control charts that may indicate a process is out of control.
Statistical Control Process - Class PresentationMillat Afridi
Statistical process control (SPC) is a method of quality
control which employs statistical methods to monitor and
control a process. This helps to ensure that the process
operates efficiently, producing more specification-conforming products with less waste (rework or scrap).
Tools Use in SPC
Pareto Analysis, Flowcharts, Checklists, Histograms,
Scatter Diagrams, Control Charts, Cause-and-Effect Diagrams
Control charts are graphs used to monitor quality during manufacturing. They allow issues to be identified and addressed early to maintain consistent product quality. Key aspects of control charts include:
- Plotting statistics like the mean or range of sample measurements over time
- Using statistical limits to identify processes that are in or out of control
- Interpreting patterns in the charts to determine if corrective action is needed
Control charts enable manufacturers to efficiently produce uniform products by catching problems early and avoiding unnecessary adjustments to processes that are performing normally.
This document provides an overview of statistical process control and control charts. It defines control charts as tools used to distinguish between common and special cause variation in a process. The document traces the history of control charts to their invention by Walter Shewhart in the 1920s. It describes different types of control charts for continuous and discrete data. It also distinguishes between control limits, which indicate a process's natural variation, and specification limits, which define customer requirements. Finally, it explains the concepts of common and special cause variation and how identifying them is important for process improvement.
This document summarizes key concepts in quality control and statistical process control. It discusses total quality management, the Malcolm Baldridge National Quality Award criteria, ISO 9000 standards, and Six Sigma methodology. It also describes different types of control charts used in statistical process control, including x-bar, R, p, and np charts. Control charts help determine whether process variation is due to common or assignable causes by comparing output to control limits. Interpreting point patterns on control charts indicates whether a process is in statistical control.
The document provides an overview of six sigma and statistical process control (SPC). It defines variation and explains the importance of understanding and controlling it. The objectives of SPC are outlined, including appreciating variation, understanding normal distribution and different types of process variation. Control charts are introduced as a tool to monitor processes and identify special causes of variation. The importance of objective data use is discussed.
This document discusses statistical process control (SPC), statistical quality control (SQC), and quality control (QC) tools. It provides descriptions of key SPC tools like control charts, run charts, Pareto charts, histograms, and scatter diagrams. For SQC, it covers sampling techniques including probability sampling methods like simple random sampling, systematic sampling, stratified sampling, and cluster sampling as well as non-probability sampling methods. Finally, it discusses quality control techniques such as the PDCA cycle, 5S, and Kaizen for process improvement.
Statistical process control technique with example - xbar chart and R chartkevin Richard
Statistical process control (SPC) uses statistical tools like control charts to monitor and control processes and ensure continuous quality improvement. Control charts, also called Shewhart charts, are tools used in SPC to determine if a process is statistically in control. The document presents data from samples of digital watches tested over eight periods. X-bar and R charts are constructed from the data and show that the process is in a state of statistical control.
The document discusses statistical process control (SPC). It provides an overview of SPC, including its history and importance in quality control. It describes the basic steps of SPC and the types of variation that can occur in processes. Common SPC tools like control charts are explained, along with how they are constructed and interpreted. The document also provides examples of how SPC was implemented at Tata Consultancy Services to reduce defects and improve process performance.
This document provides an overview of statistical process control (SPC) and design of experiments (DOE). It defines SPC as monitoring production processes to prevent poor quality using techniques like control charts. DOE is presented as a systematic approach to engineering problem solving using planned experiments and statistical analysis. Key aspects of both SPC and DOE are described, including control chart types, variables in experimentation, steps in planning a DOE, and Taguchi methods which aim to optimize robustness through orthogonal array experiments. The document serves as an introduction to these important quality control and improvement tools.
This document discusses statistical quality control and control charts. It defines statistical quality control as using statistics to monitor manufacturing processes and determine if variation is due to chance or assignable causes. The document outlines two types of control charts: variables control charts that measure continuous data like weight or temperature, and attributes control charts that count discrete data like defects. Specific variable charts discussed include X-bar and R charts, while attribute charts include P, C, U, and NP charts. Guidelines are provided on when and how to implement control charts to monitor processes and identify sources of variation.
process monitoring (statistical process control)Bindutesh Saner
Statistical Process Control (SPC) is an industry
standard methodology for measuring and controlling quality during
the manufacturing process. Attribute data (measurements)
is collected from products as they are being produced. By
establishing upper and lower control limits, variations in the
process can be detected before they result in defective product,
entirely eliminating the need for final inspection.
statistical quality control, the use of statistical methods in the monitoring and maintaining of the quality of products and services. One method, referred to as acceptance sampling, can be used when a decision must be made to accept or reject a group of parts or items based on the quality found in a sample. A second method, referred to as statistical process control, uses graphical displays known as control charts to determine whether a process should be continued or should be adjusted to achieve the desired quality.Statistical process control (SPC) or statistical quality control (SQC) is the application of statistical methods to monitor and control the quality of a production process. This helps to ensure that the process operates efficiently, producing more specification-conforming products with less waste scrap. SPC can be applied to any process where the "conforming product" (product meeting specifications) output can be measured. Key tools used in SPC include run charts, control charts, a focus on continuous improvement, and the design of experiments. An example of a process where SPC is applied is manufacturing lines.
SPC must be practiced in two phases: The first phase is the initial establishment of the process, and the second phase is the regular production use of the process. In the second phase, a decision of the period to be examined must be made, depending upon the change in 5M&E conditions (Man, Machine, Material, Method, Movement, Environment) and wear rate of parts used in the manufacturing process (machine parts, jigs, and fixtures).
An advantage of SPC over other methods of quality control, such as "inspection," is that it emphasizes early detection and prevention of problems, rather than the correction of problems after they have occurred.
In addition to reducing waste, SPC can lead to a reduction in the time required to produce the product. SPC makes it less likely the finished product will need to be reworked or scrapped.
Statistical process control was pioneered by Walter A. Shewhart at Bell Laboratories in the early 1920s. Shewhart developed the control chart in 1924 and the concept of a state of statistical control. Statistical control is equivalent to the concept of exchangeability.
Statistical process control is appropriate to support any repetitive process, and has been implemented in many settings where for example ISO 9000 quality management systems are used, including financial auditing and accounting, IT operations, health care processes, and clerical processes such as loan arrangement and administration, customer billing etc. Despite criticism of its use in design and development, it is well-placed to manage semi-automated data governance of high-volume data processing operations, for example in an enterprise data warehouse, or an enterprise data quality management system.In manufacturing, quality is defined as conformance to specification. However, no two products or characteristics are ever exactly the same.
Statistical Process Control (SPC) - QMS.pptxARUN KUMAR
This document provides an overview of statistical process control (SPC). It defines SPC as a statistical method to measure, monitor, and control processes by eliminating special causes of variation. The document discusses the key terms and benefits of SPC. It describes different types of control charts, including variables control charts (e.g., X-bar and R charts) and attributes control charts (e.g., p, np, c, and u charts). Steps for constructing each type of control chart are also outlined. Finally, the document introduces process capability and discusses the Cp and Cpk indices for measuring a process's ability to meet specifications.
Statistical Process Control,Control Chart and Process Capabilityvaidehishah25
This document provides an overview of statistical process control (SPC). It discusses the key concepts of SPC including the 5M's (man, machine, material, method, milieu), control chart basics, process variability, common SPC tools like control charts, histograms, Pareto charts, and their purposes. Control charts are described as the most important SPC tool for distinguishing common from special cause variation to monitor if a process is in control. The document also covers variable and attribute control charts and considerations for chart selection based on data type.
This document provides an overview of statistical process control (SPC). SPC uses statistical techniques to monitor processes and detect changes, helping to prevent defects and drive continuous improvement. It aims to identify problems in production as early as possible through analysis of process capability. Control charts are a key tool in SPC, monitoring the average and variation of a process over time through control limits. Being in statistical control means a process's measurements vary randomly within control limits in a predictable way. Patterns outside the limits indicate the process is out of control due to assignable causes that need correction. Benefits of SPC and control charts include reduced scrap, preventing unnecessary adjustments, and providing diagnostic information.
Statistical process control (SPC) techniques apply statistical methods to measure and analyze variation in manufacturing processes. SPC uses control charts to distinguish between common cause variation inherent to the process and special cause variation that can be assigned to a specific reason. Control charts monitor process data over time against statistical control limits. Process capability analysis compares process variation to product specifications to determine if the process is capable of meeting specifications. Key metrics like Cp, Cpk and Cpm indices quantify a process's capability relative to the specifications. For a process to have a valid capability analysis, it must meet assumptions of statistical control, normality, sufficient representative data, and independence of measurements.
Benchmarking is an improvement process where a company measures its performance against best-in-class companies to determine how they achieved high performance levels and then uses that information to improve its own performance. A Black Belt is a full-time Six Sigma project leader who is certified after extensive training and successful completion of projects under a Master Black Belt's guidance. The "Breakthrough Strategy" involves four phases - Measure, Analyze, Improve and Control - to drive data-driven Six Sigma process improvement.
Lecture 3
Statistical Process
Control (SPC)
Data collection for Six SigmaData are simply facts and figures without context or interpretation.Information refers to useful or meaningful patterns found in the data.Knowledge represents information of sufficient quality and/or quantity that actions can be taken based on the information.If data are not collected and used wisely, their vary existence can lead to activities that are ineffective and possibly even counterproductive.An organization collects data & reacts whenever an out-of-specification condition occurs.
“Common cause” & “ special cause” variation
There are two causes of process variations:
1) Common cause variation: This variation is due to the process only. It may not tell you whether the process meets the needs of the customer unless it is compared with the specification. This can be improved by focusing on the process.
2) Special cause variation: This variation is due the individual employee, if the point is beyond specification limits. In this case the focus should be about what happened relative to the individual employee as though it were a “special” condition.
Attribute versus Variable Data
Attribute data: It is a data with yes or no decision such as:whether an iten passed or failed a testpass/fail, go/no go gaging, true/false, accept/reject. There are no quantifiable values
Variable data: are related to measurements with quantifiable values such as:Diameter of a part which has been machinedlength or thickness of the machined part
The success of Six SigmaThe success of Six Sigma depends upon knowing the difference between special & common cause variations and how the organization reacts to the data.If the management focuses on wrong cause of variation, it can lead to waste of time (firefighting).It can also effect employee motivation & morale.Reacting to one data point that do not meet the specification limit can be counterproductive and very expensive.Do not use “firefighting” actions just because the data point is out of specification limits. It must first be determined whether the condition is common or special cause.
Example of variability due to common causeControl limits are calculated from the sample data.There are no data points outside the control limits therefore there are no special causes within the data.The source of variation in this case is “common cause” due to process.
Type of firefighting done by management before evaluating the cause of variabilityProduction supervisors might constantly review production output by employee, machine, product line, work shift etc.An administrative assistant’s daily output & memo’s may be monitored.The average time per call may be monitored in a call center.The efficiency of computer programmers may be monitored by tracking “lines of code produced per day”.
All of these actions would be a waste of time if the cause of variability is “common cause” and due to the process rather than individu ...
Histogram, Pareto Diagram, Ishikawa Diagram, and Control ChartNicola Ergo
The document provides information on various quality control tools including histograms, Pareto diagrams, Ishikawa diagrams, and control charts. Histograms show the distribution of numerical data by frequency. Pareto diagrams highlight the most important factors by showing variables in descending order. Ishikawa diagrams show causes of a problem in a branching diagram format. Control charts graph process data over time to determine if a process is stable or unpredictable through the use of control limits.
Training Module including 116 slides and 6 exercises covering Introduction to Statistical Process Control, The Histogram, Measure of Location and Variability, Process Control Charts, Process Control Limits, Out-of-Control Criteria, Sample Size and Frequency, and Out-of-Control Action Plan.
This document provides an overview of statistical process control (SPC). It discusses the history and key concepts of SPC, including how it can be used to monitor processes, detect sources of variation, and improve quality. Control charts are a core tool in SPC that graph data over time to identify whether a process is in or out of statistical control. When applied effectively, SPC offers advantages like improved product quality, increased productivity, and reduced waste.
The document discusses 7 quality management tools that are commonly used in quality control processes. It provides descriptions of each tool, including cause and effect diagrams, flowcharts, checksheets, Pareto diagrams, histograms, control charts, and scatter diagrams. For each tool, it explains what the tool is used for and how it can help identify issues, optimize processes, ensure consistency, prioritize problems, analyze distributions, determine if a process is stable/predictable, and determine relationships between variables. It also includes more detailed explanations and examples of checksheets, control charts, Pareto charts, scatter plots, Ishikawa diagrams, and histograms as specific quality management tools.
Statistical quality control refers to using statistical methods to monitor and maintain quality in products and services. It involves inspecting random samples from a process to determine if the process is functioning properly and producing items within specifications. Acceptance sampling determines whether to accept or reject an entire batch of items based on inspecting a random sample. Common control charts include X-bar and R charts for variables and P charts for attributes. Forecasting uses statistical techniques to predict future events and outcomes based on past and present data to help managers make informed decisions.
Basic avenues of MBA - General Specializations .pptxlubnasadiyah
Generally practiced BA specializations in India are as follows
Human resource management, Event management (Knowledge management), Production management and Marketing management are a few in the list.
The basic concepts of all these areas are highlighted and elucidated for a better understanding that can enable to help student community realizing the various scope available in MBA Discipline.
Fix or Fit to Personality Development.pptxlubnasadiyah
General Information about personality development for beginners and relevant concepts of management related to personality growth in real life situations.
Abraham Maslow Theory
POSDCORB principle, SWOT Analysis ,
SMART Techniques and JOHARI Window that enables
an individual in overall systematic progression of personality.
This in turn leads to motivational drive factor to determine the steadiness and consistency to achieve both personal and as well as organizational goals so called as Twin Benefits.
Rural Insurance plays a vita role in the economic progression. India being an agricultural backbone requires efforts to boost agrarian activities. The push and pull factors enable to go for insurance coverage that may comprise of Cattle Insurance, Crop Insurance, Vehicle Insurance, Theft, Burglary or Fire Insurance etc.
Insurance is the largest sector for meeting not only the unforeseen events but also provides proximity and morale to encounter the dangers, risks and perils associated with the business activity.
Dr. Lubna Suraiya is a former assistant professor, full-time research scholar, author, motivational speaker, and freelance trainer. She holds several degrees including an MBA, M.Com, M.Phil, and PhD. She has received numerous awards for her academic and professional achievements. These include gold medals for best outgoing student and individual performance, as well as best paper awards. She has also been recognized in publications and television for her community service and public speaking. Her career has involved teaching at several colleges and universities, as well as serving as a resource person to provide training and guidance.
1) Financial management involves planning, organizing, and controlling a company's monetary resources and their efficient use.
2) Common long-term sources of financing include equity shares, preference shares, debentures, and bonds which provide capital for fixed assets and long-term working capital needs.
3) Short-term financing needs are met through short-term loans and trade credit that support daily operations and expenses.
Personality Development has been the talk of the town and is the most important aspect in one's life. The students tend to develop the attitude when they approach for an interview but it is not so. This is a self-motivated task and the reflection of an individual towards his or her behaviour, character building, intelligence and perception. SWOT Analysis and Johari Window plays a crucial role in determining the potential of the individual in bringing out the backdrop and reflecting the strengths for the career advancement.
The document appears to be a program for an event held at St. John's College in Palayamkottai. It includes a welcome address by the Head of the Department of Commerce, a presidential address by the Principal of St. John's College, a keynote address by a speaker from Holy Cross College, and a vote of thanks by an Assistant Professor and Department Head from St. John's College. The event concluded with the singing of the national anthem.
This Presentation outlines the origin of trade from paleolithic age to stock exchange and how it has impacted global scenario, keeping the currency rates, economic cycles, demand and supply, competition, factors of production etc. This had an adverse effect on the entrepreneurial culture to set up a business venture.
Role of higher education in Women Empowerment : An insight on the rural mot...lubnasadiyah
Women have fiercely competing men and have excelled in various fields and education proves to be the backbone of women empowerment. Besides facing many personal, family, societal and work place issues yet their achievements gets unrecognized particularly of rural women. This presentation helps in determining the rural mother's awareness and the perceptional factors to significantly understand the importance of education.
The document presents a thought experiment about a group of children playing on train tracks, where the reader must decide whether to divert an oncoming train to a disused track in order to save most of the children, but sacrifice one child, or to let the train proceed on its track. It analyzes this decision and argues that diverting the train would be making the wrong decision, as the lone child playing safely did nothing wrong, and diverting the train could endanger passengers. The document encourages taking time to consider decisions carefully rather than acting hastily.
Monte Carl Simulation is a powerful and effective tool when used properly helps to navigate the expected Net Present Value NPV. This presentation helps to improve the pattern to ackowlege onthe Odessa Investment by Decision Dres.
The upcoming generation may have the chances of using more robotics and this advancement is taking a rapid fire glow among the heavy work culture and monotonous jobs.
Human Resource Management is very important in the daily prospects of the organizations. Out of 5 M's the prior most cadre is for Man / Men ./ Manpower leading to training improving performance appraisal and endowing the full growth of the individual as well as of the organizations helping to achieve twin benefits.
FMCG is highly focused and is currently the soul of the consumer in the market. S Target ting is the key and dynamic measurement with innovation model leading towards growth
This document provides an overview of entrepreneurs and entrepreneurship. It begins with defining the etymology of the term "entrepreneur" dating back to the 13th century French verb "entreprendre." It then discusses key economists like Jean Baptiste Say, Richard Cantillon, John Stuart Mill, and Joseph Schumpeter who further developed the concept. The document defines a simple meaning of an entrepreneur as someone who initiates a venture while taking on financial risks and innovating. It lists several reasons for the importance of entrepreneurship such as job creation, innovation, community development, and economic growth. Overall, the summary provides a high-level view of the history and definitions of entrepreneurship as well as its significance.
Problems faced by Transgender Entrepreneurs lubnasadiyah
This document discusses issues faced by transgender entrepreneurs in India. It provides an overview of problems transgender people face socially and economically in Indian society. It then discusses 7 notable transgender entrepreneurs in India. The document outlines various problems transgender entrepreneurs face, including social, economic, marketing, bureaucratic, financial, knowledge, and entrepreneurial challenges. It also discusses institutions and funding agencies available to support transgender entrepreneurs.
This document summarizes a study on the marketing strategies adopted by transgender entrepreneurs in Coimbatore, India. The study objectives were to examine the various marketing strategies used, motivational factors, effectiveness of strategies, and provide suggestions. A sample of 70 transgender entrepreneurs were surveyed. Key findings include direct marketing being the most common strategy, quality being the top product priority, and location being a major challenge. The study found a positive correlation between strategies and business factors. Suggestions include addressing legal and social issues, expanding skill training and business types, and improving access to resources.
Strategies for Effective Upskilling is a presentation by Chinwendu Peace in a Your Skill Boost Masterclass organisation by the Excellence Foundation for South Sudan on 08th and 09th June 2024 from 1 PM to 3 PM on each day.
This slide is special for master students (MIBS & MIFB) in UUM. Also useful for readers who are interested in the topic of contemporary Islamic banking.
How to Setup Warehouse & Location in Odoo 17 InventoryCeline George
In this slide, we'll explore how to set up warehouses and locations in Odoo 17 Inventory. This will help us manage our stock effectively, track inventory levels, and streamline warehouse operations.
Exploiting Artificial Intelligence for Empowering Researchers and Faculty, In...Dr. Vinod Kumar Kanvaria
Exploiting Artificial Intelligence for Empowering Researchers and Faculty,
International FDP on Fundamentals of Research in Social Sciences
at Integral University, Lucknow, 06.06.2024
By Dr. Vinod Kumar Kanvaria
ISO/IEC 27001, ISO/IEC 42001, and GDPR: Best Practices for Implementation and...PECB
Denis is a dynamic and results-driven Chief Information Officer (CIO) with a distinguished career spanning information systems analysis and technical project management. With a proven track record of spearheading the design and delivery of cutting-edge Information Management solutions, he has consistently elevated business operations, streamlined reporting functions, and maximized process efficiency.
Certified as an ISO/IEC 27001: Information Security Management Systems (ISMS) Lead Implementer, Data Protection Officer, and Cyber Risks Analyst, Denis brings a heightened focus on data security, privacy, and cyber resilience to every endeavor.
His expertise extends across a diverse spectrum of reporting, database, and web development applications, underpinned by an exceptional grasp of data storage and virtualization technologies. His proficiency in application testing, database administration, and data cleansing ensures seamless execution of complex projects.
What sets Denis apart is his comprehensive understanding of Business and Systems Analysis technologies, honed through involvement in all phases of the Software Development Lifecycle (SDLC). From meticulous requirements gathering to precise analysis, innovative design, rigorous development, thorough testing, and successful implementation, he has consistently delivered exceptional results.
Throughout his career, he has taken on multifaceted roles, from leading technical project management teams to owning solutions that drive operational excellence. His conscientious and proactive approach is unwavering, whether he is working independently or collaboratively within a team. His ability to connect with colleagues on a personal level underscores his commitment to fostering a harmonious and productive workplace environment.
Date: May 29, 2024
Tags: Information Security, ISO/IEC 27001, ISO/IEC 42001, Artificial Intelligence, GDPR
-------------------------------------------------------------------------------
Find out more about ISO training and certification services
Training: ISO/IEC 27001 Information Security Management System - EN | PECB
ISO/IEC 42001 Artificial Intelligence Management System - EN | PECB
General Data Protection Regulation (GDPR) - Training Courses - EN | PECB
Webinars: https://pecb.com/webinars
Article: https://pecb.com/article
-------------------------------------------------------------------------------
For more information about PECB:
Website: https://pecb.com/
LinkedIn: https://www.linkedin.com/company/pecb/
Facebook: https://www.facebook.com/PECBInternational/
Slideshare: http://www.slideshare.net/PECBCERTIFICATION
Walmart Business+ and Spark Good for Nonprofits.pdfTechSoup
"Learn about all the ways Walmart supports nonprofit organizations.
You will hear from Liz Willett, the Head of Nonprofits, and hear about what Walmart is doing to help nonprofits, including Walmart Business and Spark Good. Walmart Business+ is a new offer for nonprofits that offers discounts and also streamlines nonprofits order and expense tracking, saving time and money.
The webinar may also give some examples on how nonprofits can best leverage Walmart Business+.
The event will cover the following::
Walmart Business + (https://business.walmart.com/plus) is a new shopping experience for nonprofits, schools, and local business customers that connects an exclusive online shopping experience to stores. Benefits include free delivery and shipping, a 'Spend Analytics” feature, special discounts, deals and tax-exempt shopping.
Special TechSoup offer for a free 180 days membership, and up to $150 in discounts on eligible orders.
Spark Good (walmart.com/sparkgood) is a charitable platform that enables nonprofits to receive donations directly from customers and associates.
Answers about how you can do more with Walmart!"
This presentation includes basic of PCOS their pathology and treatment and also Ayurveda correlation of PCOS and Ayurvedic line of treatment mentioned in classics.
The simplified electron and muon model, Oscillating Spacetime: The Foundation...RitikBhardwaj56
Discover the Simplified Electron and Muon Model: A New Wave-Based Approach to Understanding Particles delves into a groundbreaking theory that presents electrons and muons as rotating soliton waves within oscillating spacetime. Geared towards students, researchers, and science buffs, this book breaks down complex ideas into simple explanations. It covers topics such as electron waves, temporal dynamics, and the implications of this model on particle physics. With clear illustrations and easy-to-follow explanations, readers will gain a new outlook on the universe's fundamental nature.
How to Manage Your Lost Opportunities in Odoo 17 CRMCeline George
Odoo 17 CRM allows us to track why we lose sales opportunities with "Lost Reasons." This helps analyze our sales process and identify areas for improvement. Here's how to configure lost reasons in Odoo 17 CRM
A review of the growth of the Israel Genealogy Research Association Database Collection for the last 12 months. Our collection is now passed the 3 million mark and still growing. See which archives have contributed the most. See the different types of records we have, and which years have had records added. You can also see what we have for the future.
This presentation was provided by Steph Pollock of The American Psychological Association’s Journals Program, and Damita Snow, of The American Society of Civil Engineers (ASCE), for the initial session of NISO's 2024 Training Series "DEIA in the Scholarly Landscape." Session One: 'Setting Expectations: a DEIA Primer,' was held June 6, 2024.
3. 1. Statistical tool used in quality control.
2. Chronological recording of data.
3. Presented in a graphical form.
4. How a process is performing over time.
5. To analyze and understand process variables.
6. Determine process capabilities.
7. Difference between target and actual performance.
8. Upper and lower limits helps the process should operate.
4. Definition
A graphical technique for determining whether a
process is or is not in a state of statistical control the
extent of variation of the output of the process does
not exceed that which is expected based on the
natural statistical variability of the process.
5. Salient Features
Points representing a statistic - a mean, range, proportion of
measurements in samples are taken at different time.
Any statistical data can be calculated by using samples.
Upper + lower control limit = "natural process limits“.
Control charts focus on stability by statistical fluctuations.
6. Where are Control Charts used?
Project Works
Cyclical activities - Manufacturing / Production
Scientific Space crafts
Logistics
Mathematics and Statistics
Industrial aspects
Research and Development
Sample & Data collections ( Demography)
8. Act – Apply the change or
abandon it, or run
through the cycle again
under different
conditions.
Check – The results
of your action. What
did you learn?
Do – Implement a
change or test a small
scale
Plan - Aimed at
improvement –
Collect Data –
Establish timeframe.
9. Advantages
Sign whether is in control or out of control
Particular level of quality.
Investigate on unusual variations.
Explore on cause & effect relationship.
Warning limits - before the process is out of control.
Diagnosing on process improvements.
No knowledge about the underlying distribution of the variable.
Identify the presence of an assignable cause of variation.
10. Drawbacks
Insufficient explanation on "WHY” it is out of control.
Difficult to identify a subgroup
Greater risk without experts.
Non-verification on adverse event.
Non accuracy on forecasting.
Multivariate, seasonal data – inflexible.
Inadaptable to complexities.
11. Maximization Concept
Improves product quality
Raise in productivity
Restructure process
Expansion
Diversification
Reduce wastages
Enhance customer service
20. X-bar chart - In this chart the sample means are plotted in order to
control the mean value of a variable (e.g., size of piston rings, strength of
materials, etc.).
R chart - In this chart, the sample ranges are plotted in order to control
the variability of a variable.
S chart - In this chart, the sample standard deviations are plotted in order
to control the variability of a variable.
C chart - In this chart we assumes that defects of the quality attribute are
rare, and the control limits in this chart are computed based on the Poisson
Distribution (distribution of rare events).
21. U chart - In this chart we plot the rate of defectives, this chart does
not require a constant number of units, and it can be used, for example,
when the batches (samples) are of different sizes.
Np chart - The control limits in this chart are not based on the
distribution of rare events, but rather on the binomial distribution. We
may use this chart to control the number of units produced with minor
flaws.
P chart - This chart is most applicable to situations where the
occurrence of defectives is not rare (e.g., we expect the percent of
defectives to be more than 5% of the total number of units produced).
22. Process Capability
Process capability expressed as a ratio of parts or items
produced by the current process that fall within user-specified
limits (e.g., engineering tolerances).
For example, the so-called Cp index is computed as:
Cp = (USL-LSL)/(6*sigma)