Downloaded 160 times


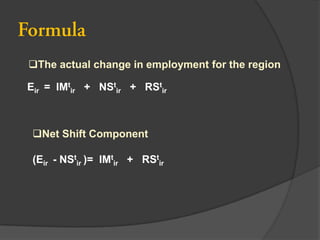
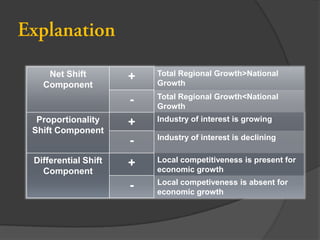
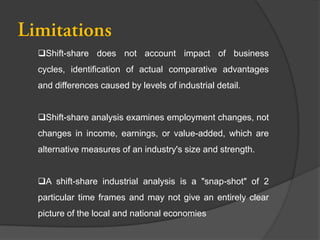
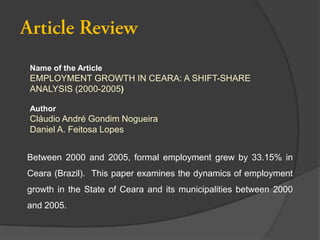


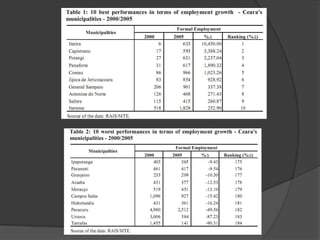
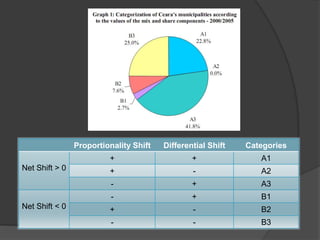
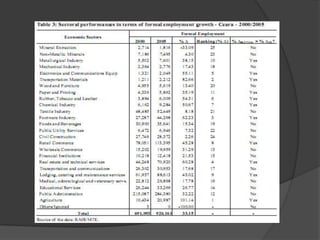
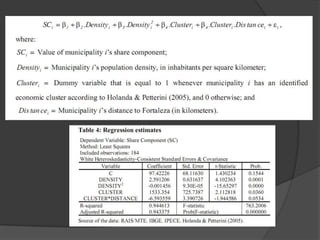
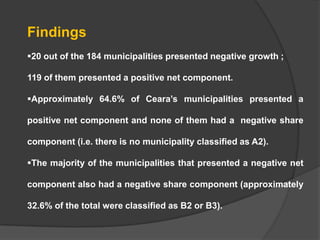
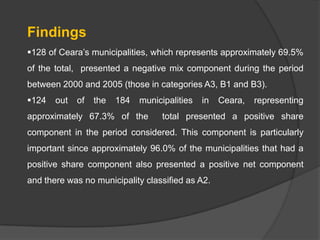

The document presents a shift-share analysis of employment growth in Ceará, Brazil, from 2000 to 2005, detailing how regional, national, and industry factors contribute to job changes. Key findings indicate that population density positively correlates with employment growth, while agglomeration diseconomies in the capital, Fortaleza, hinder its job creation. The analysis categorizes municipalities based on their growth dynamics, revealing that many regions experienced positive net employment change despite a significant number showing negative industry mix components.