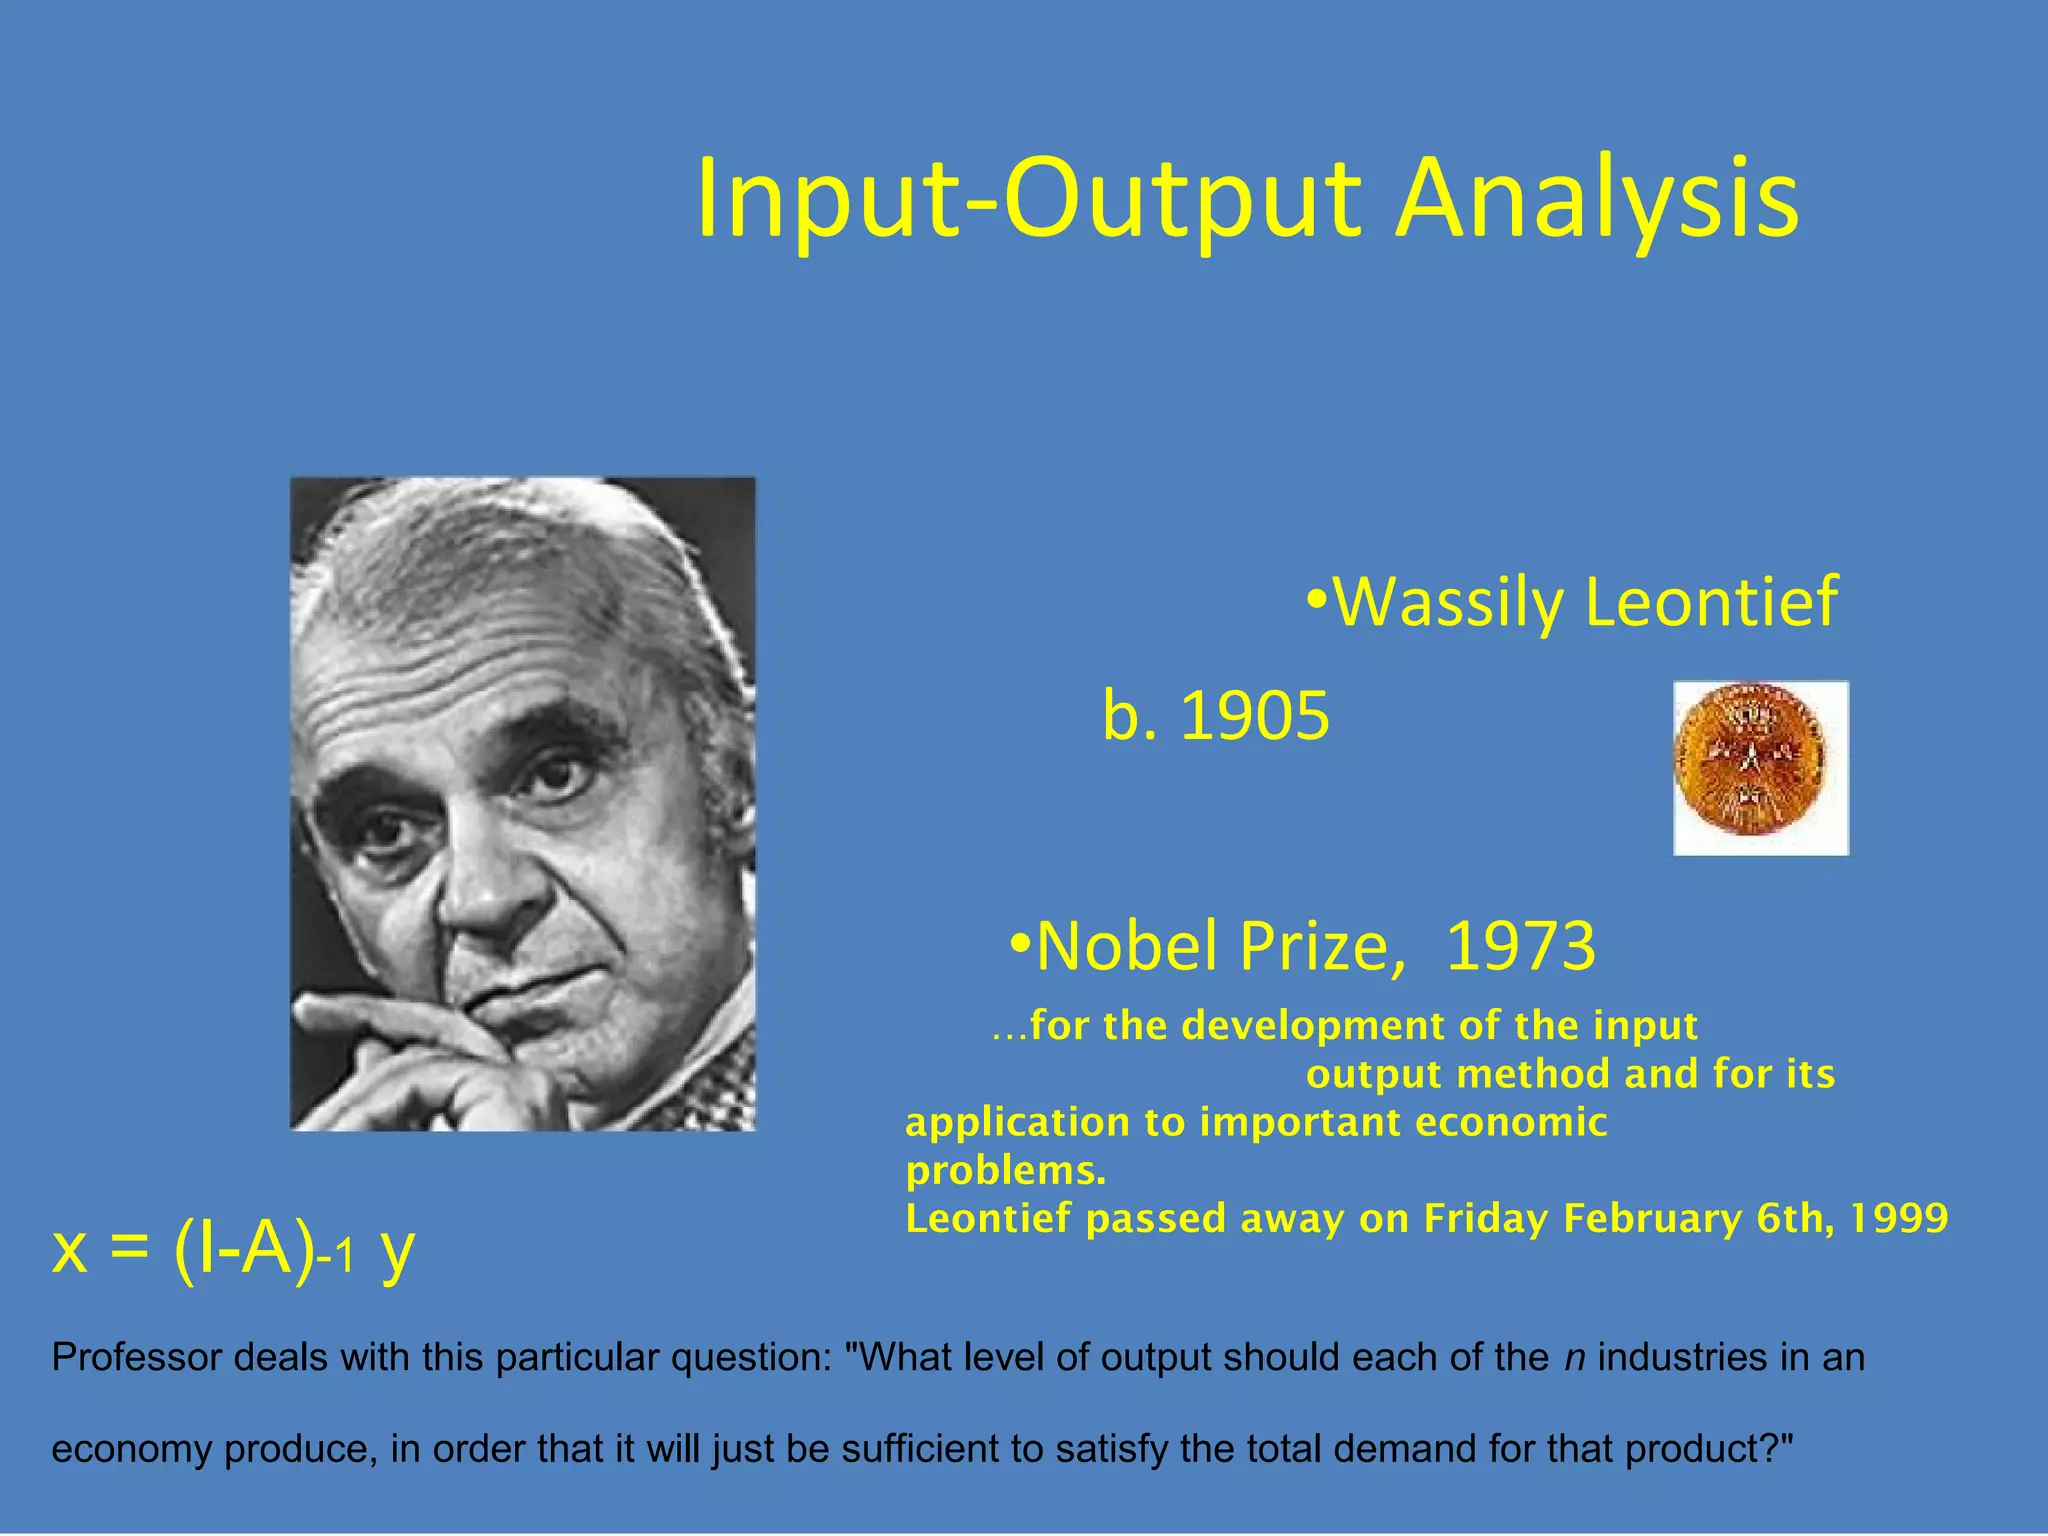
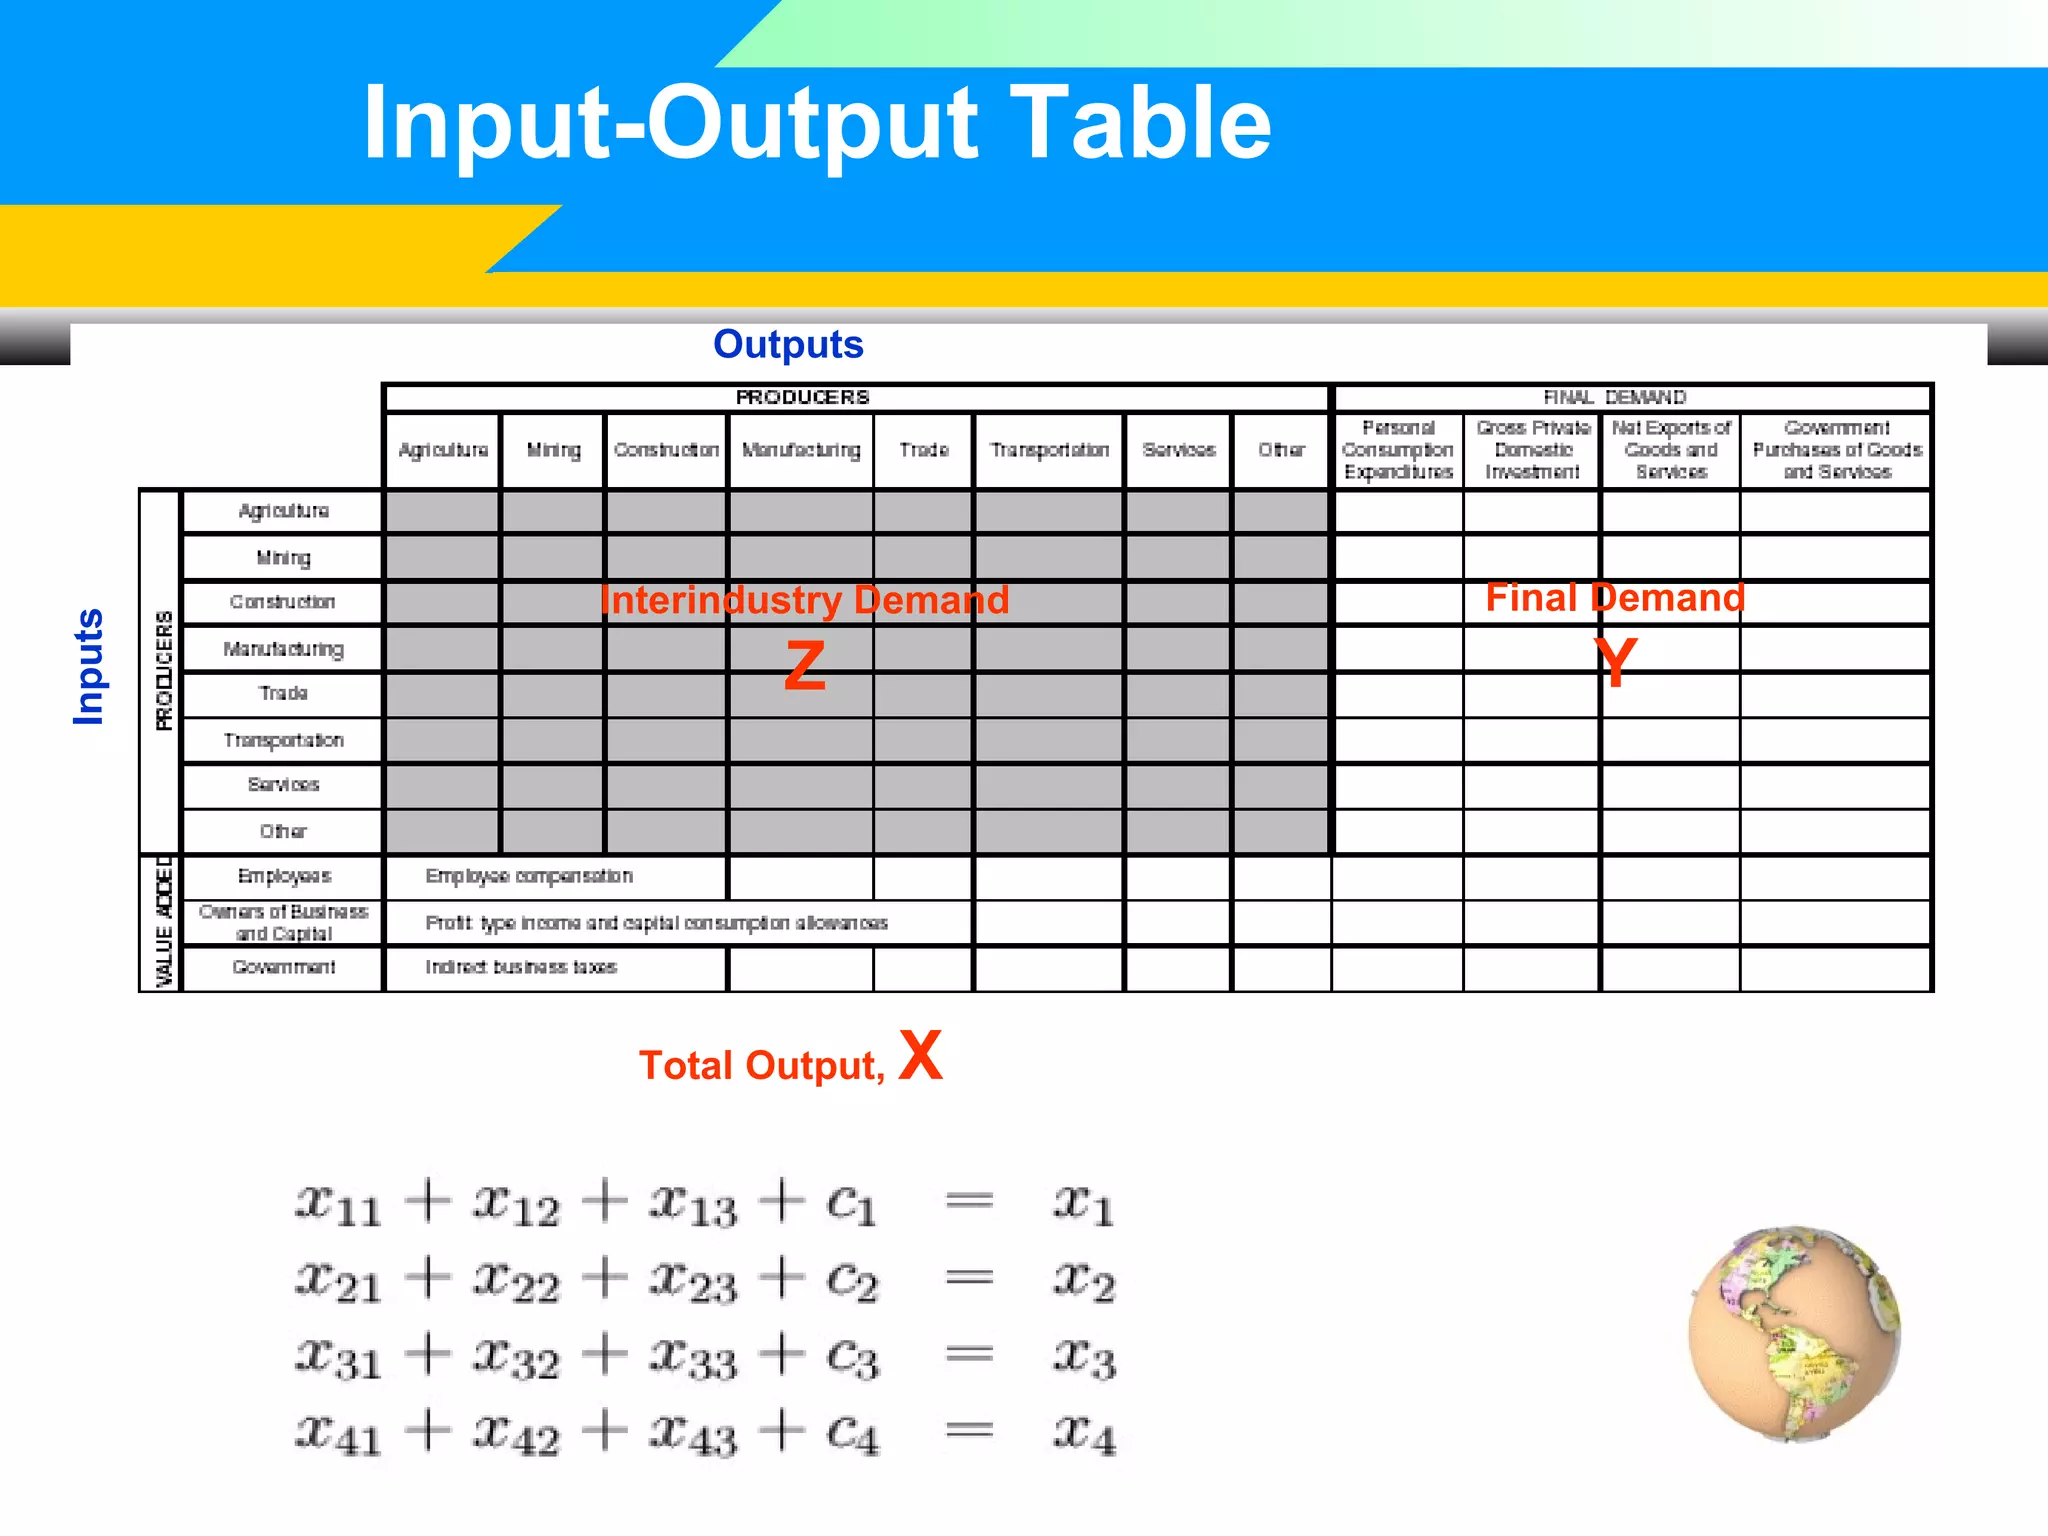
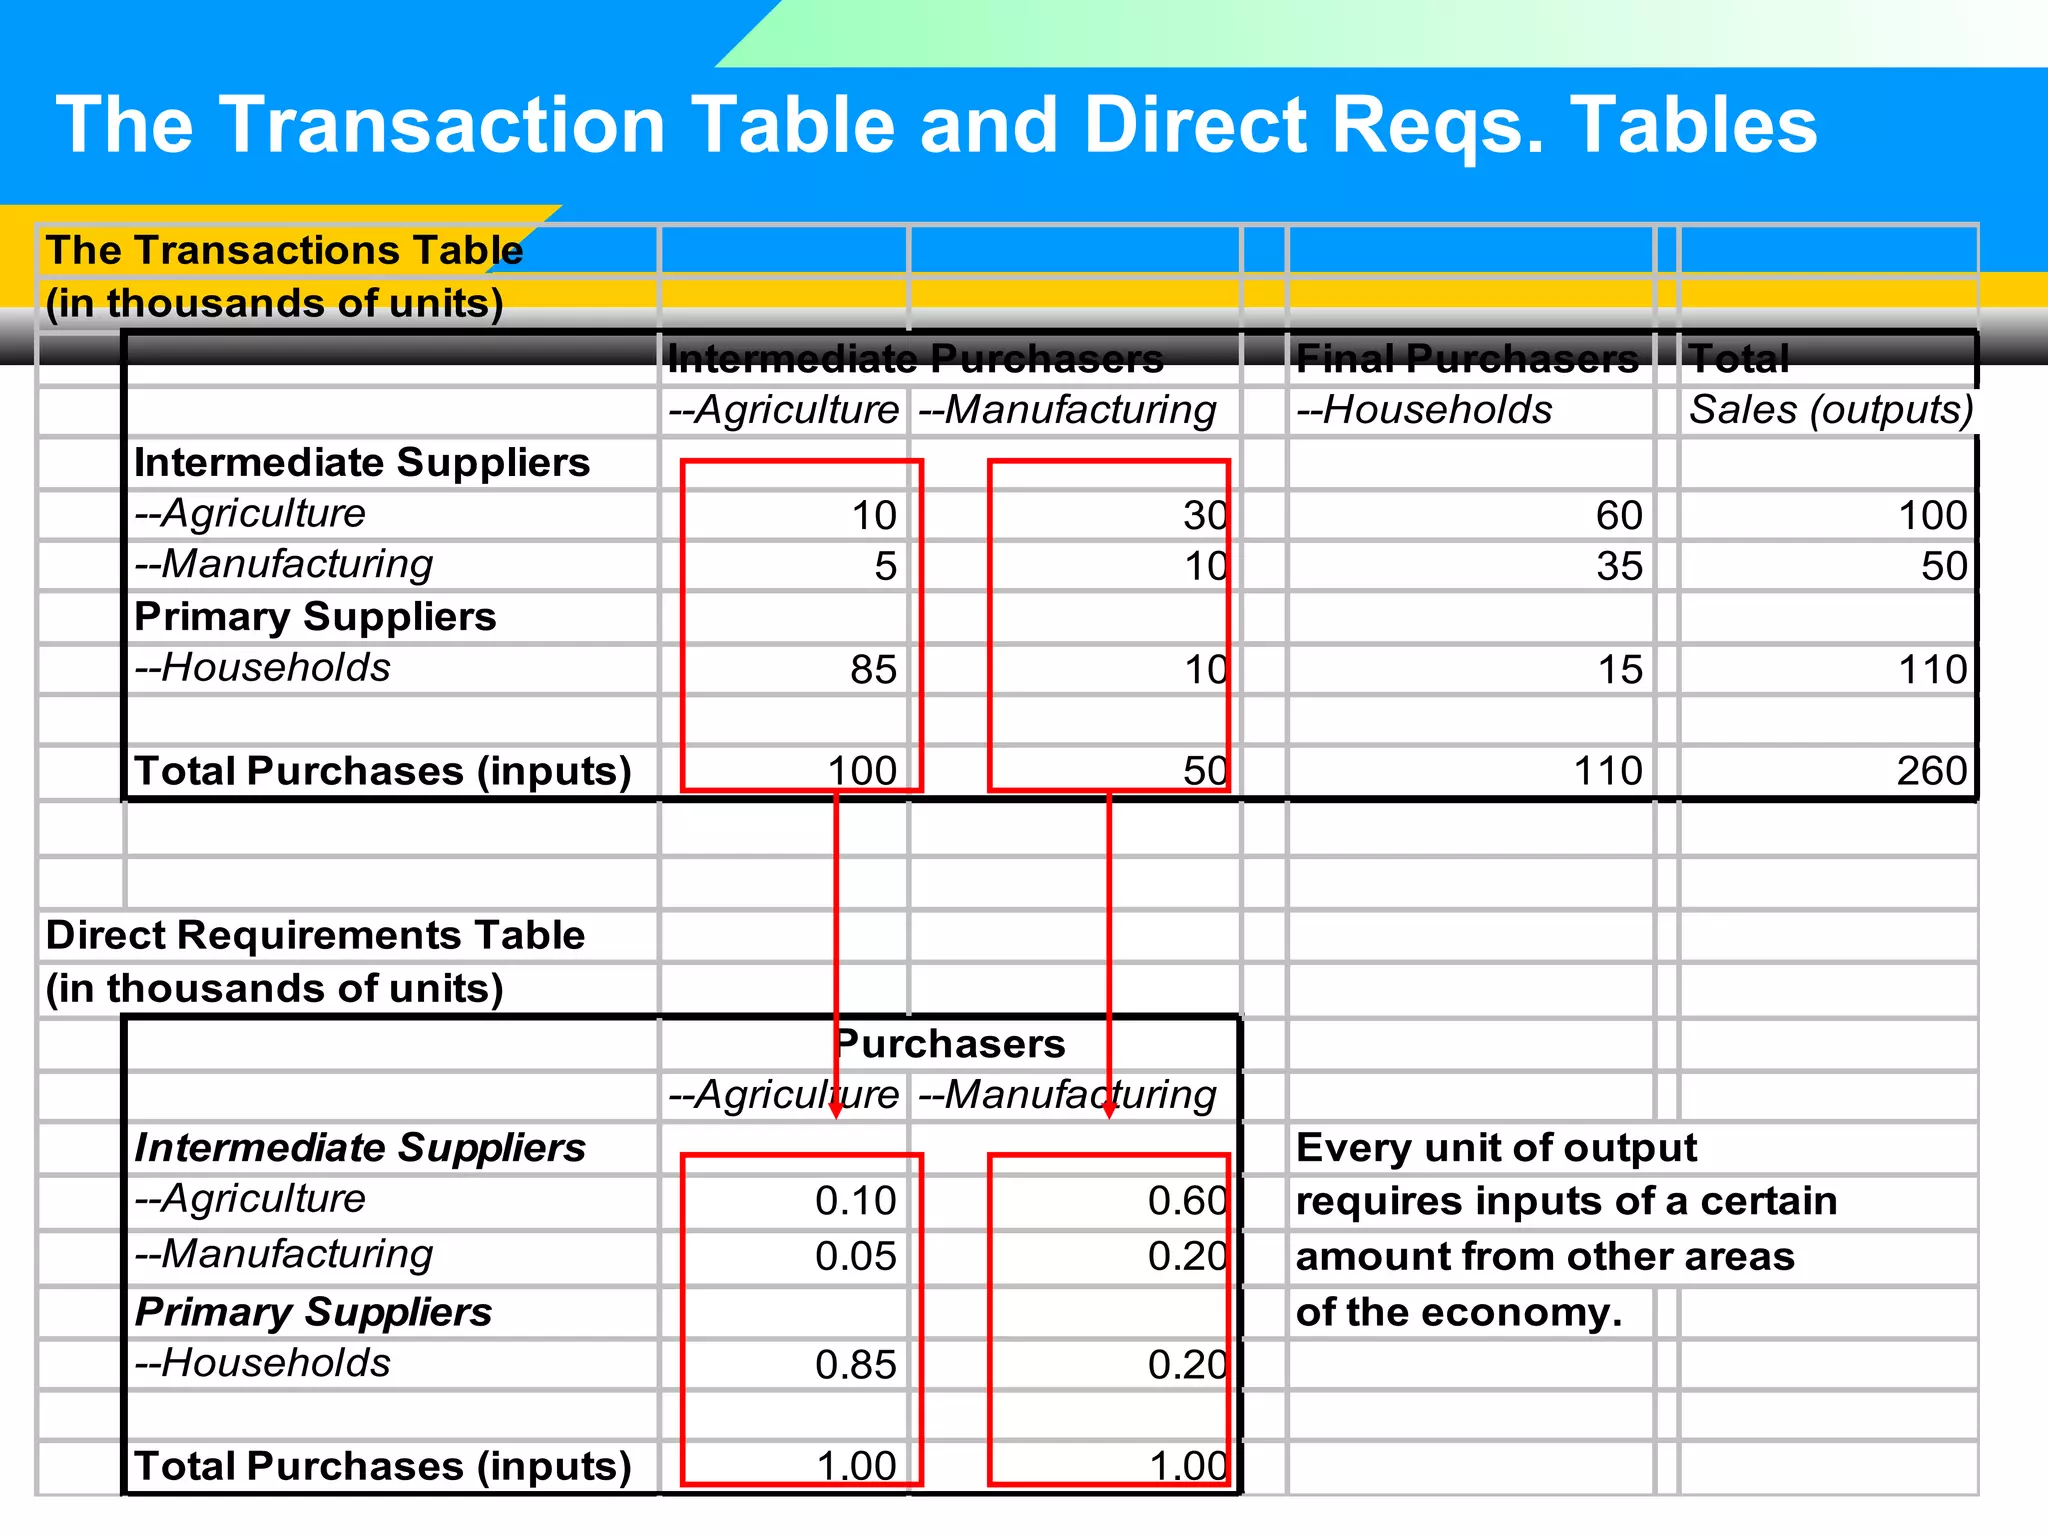
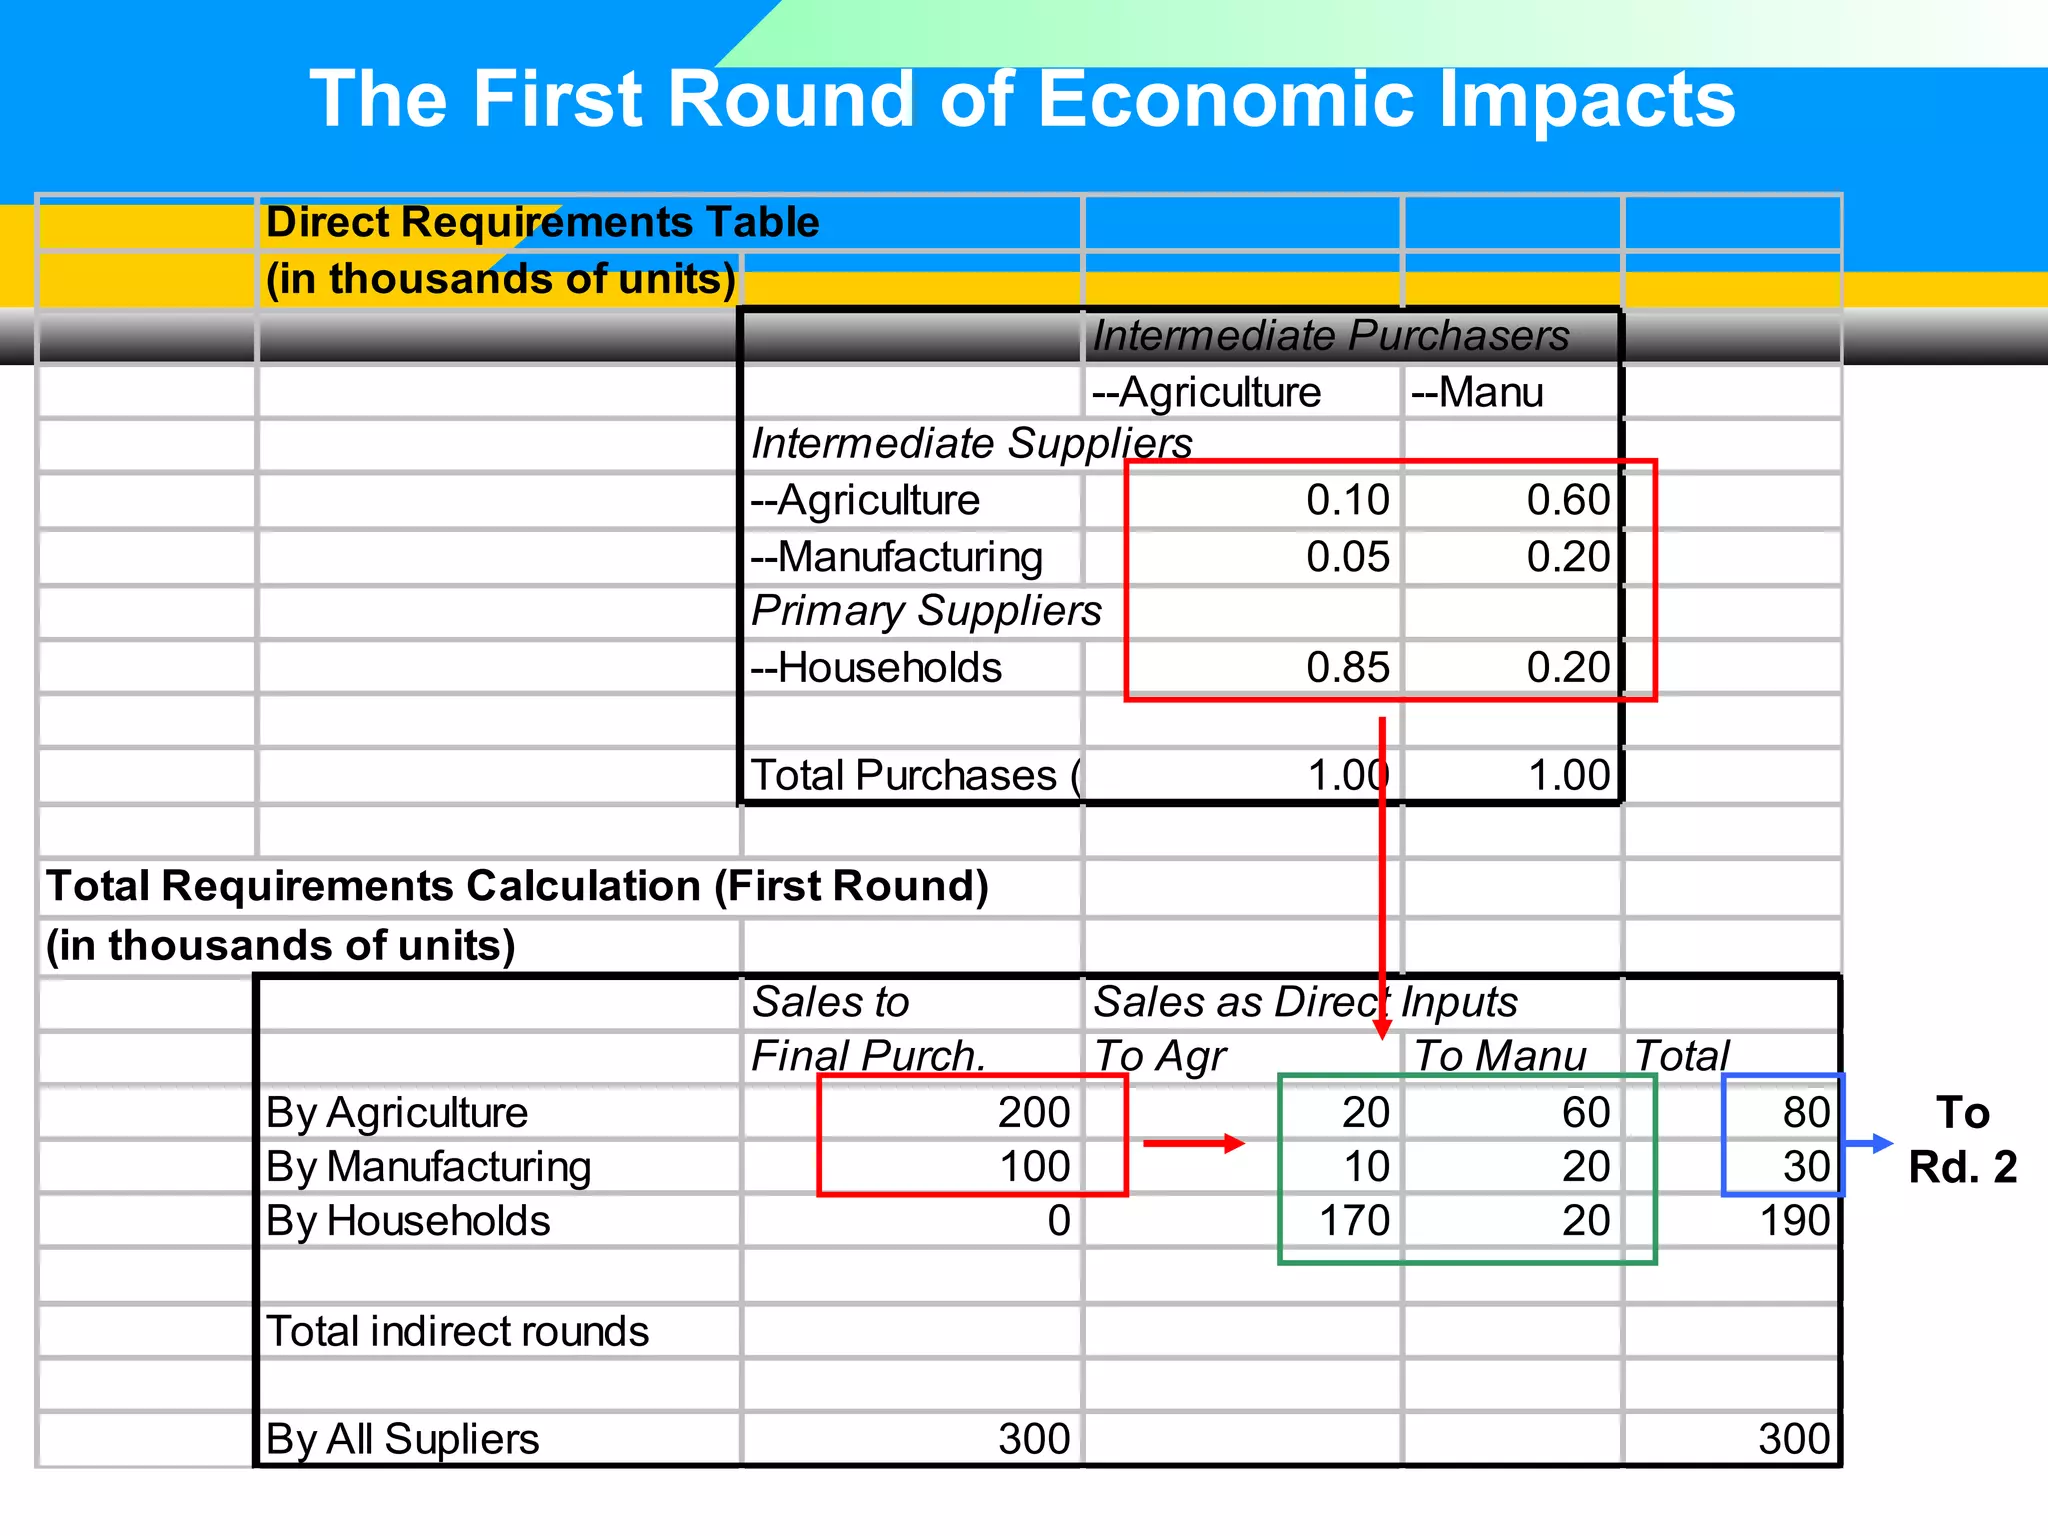
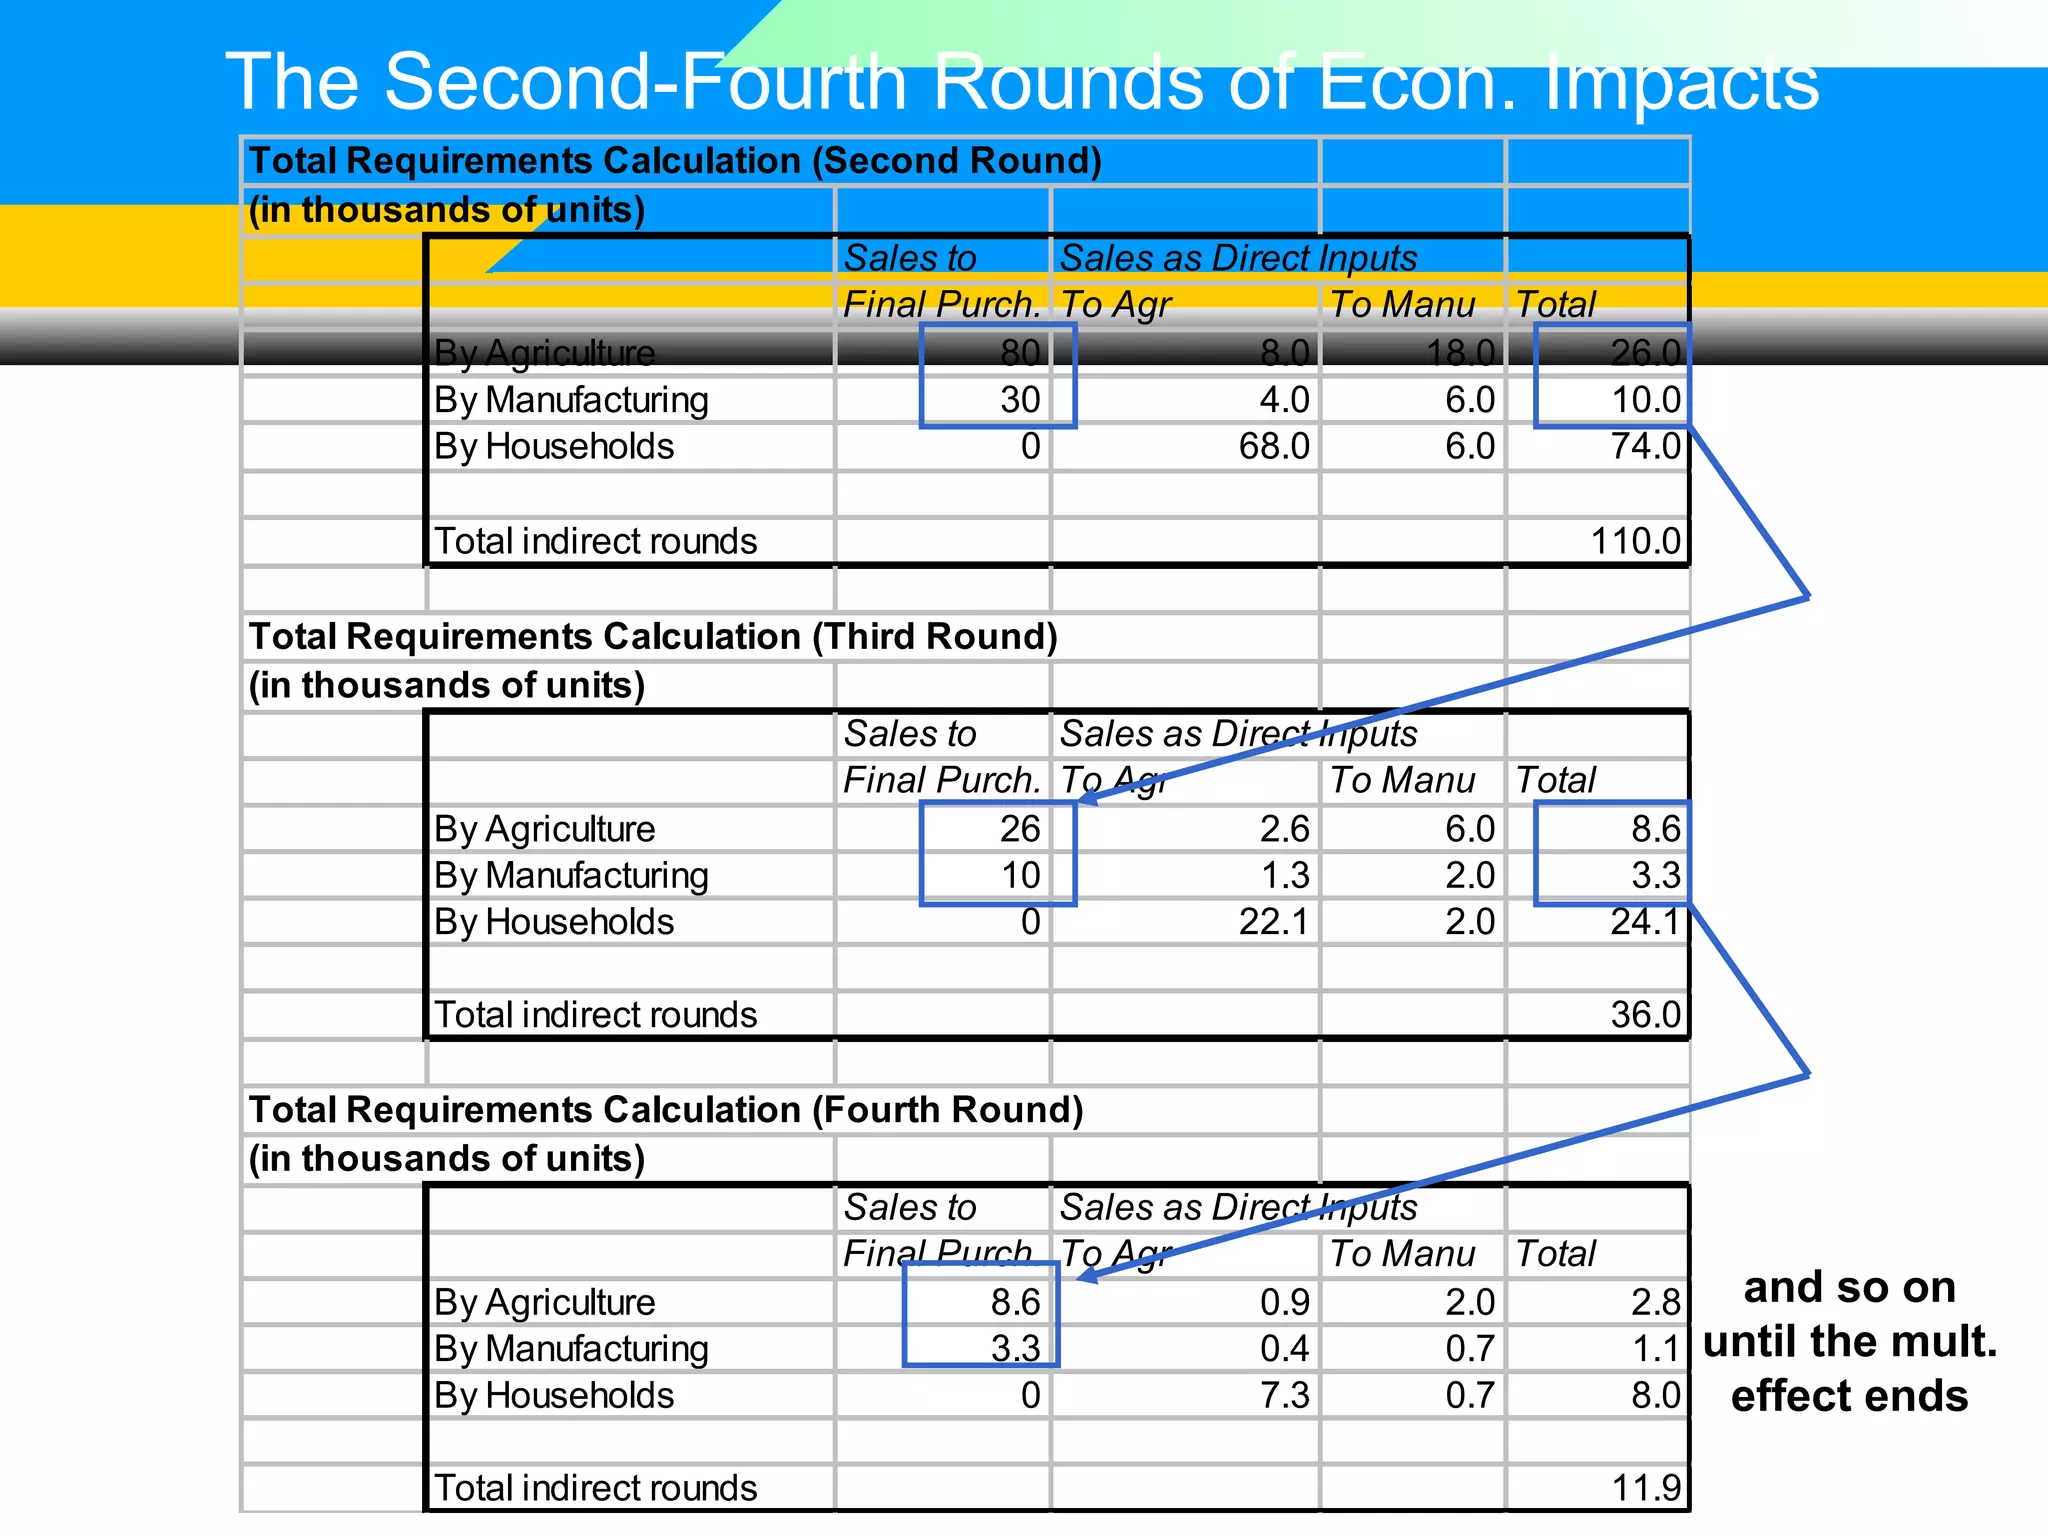
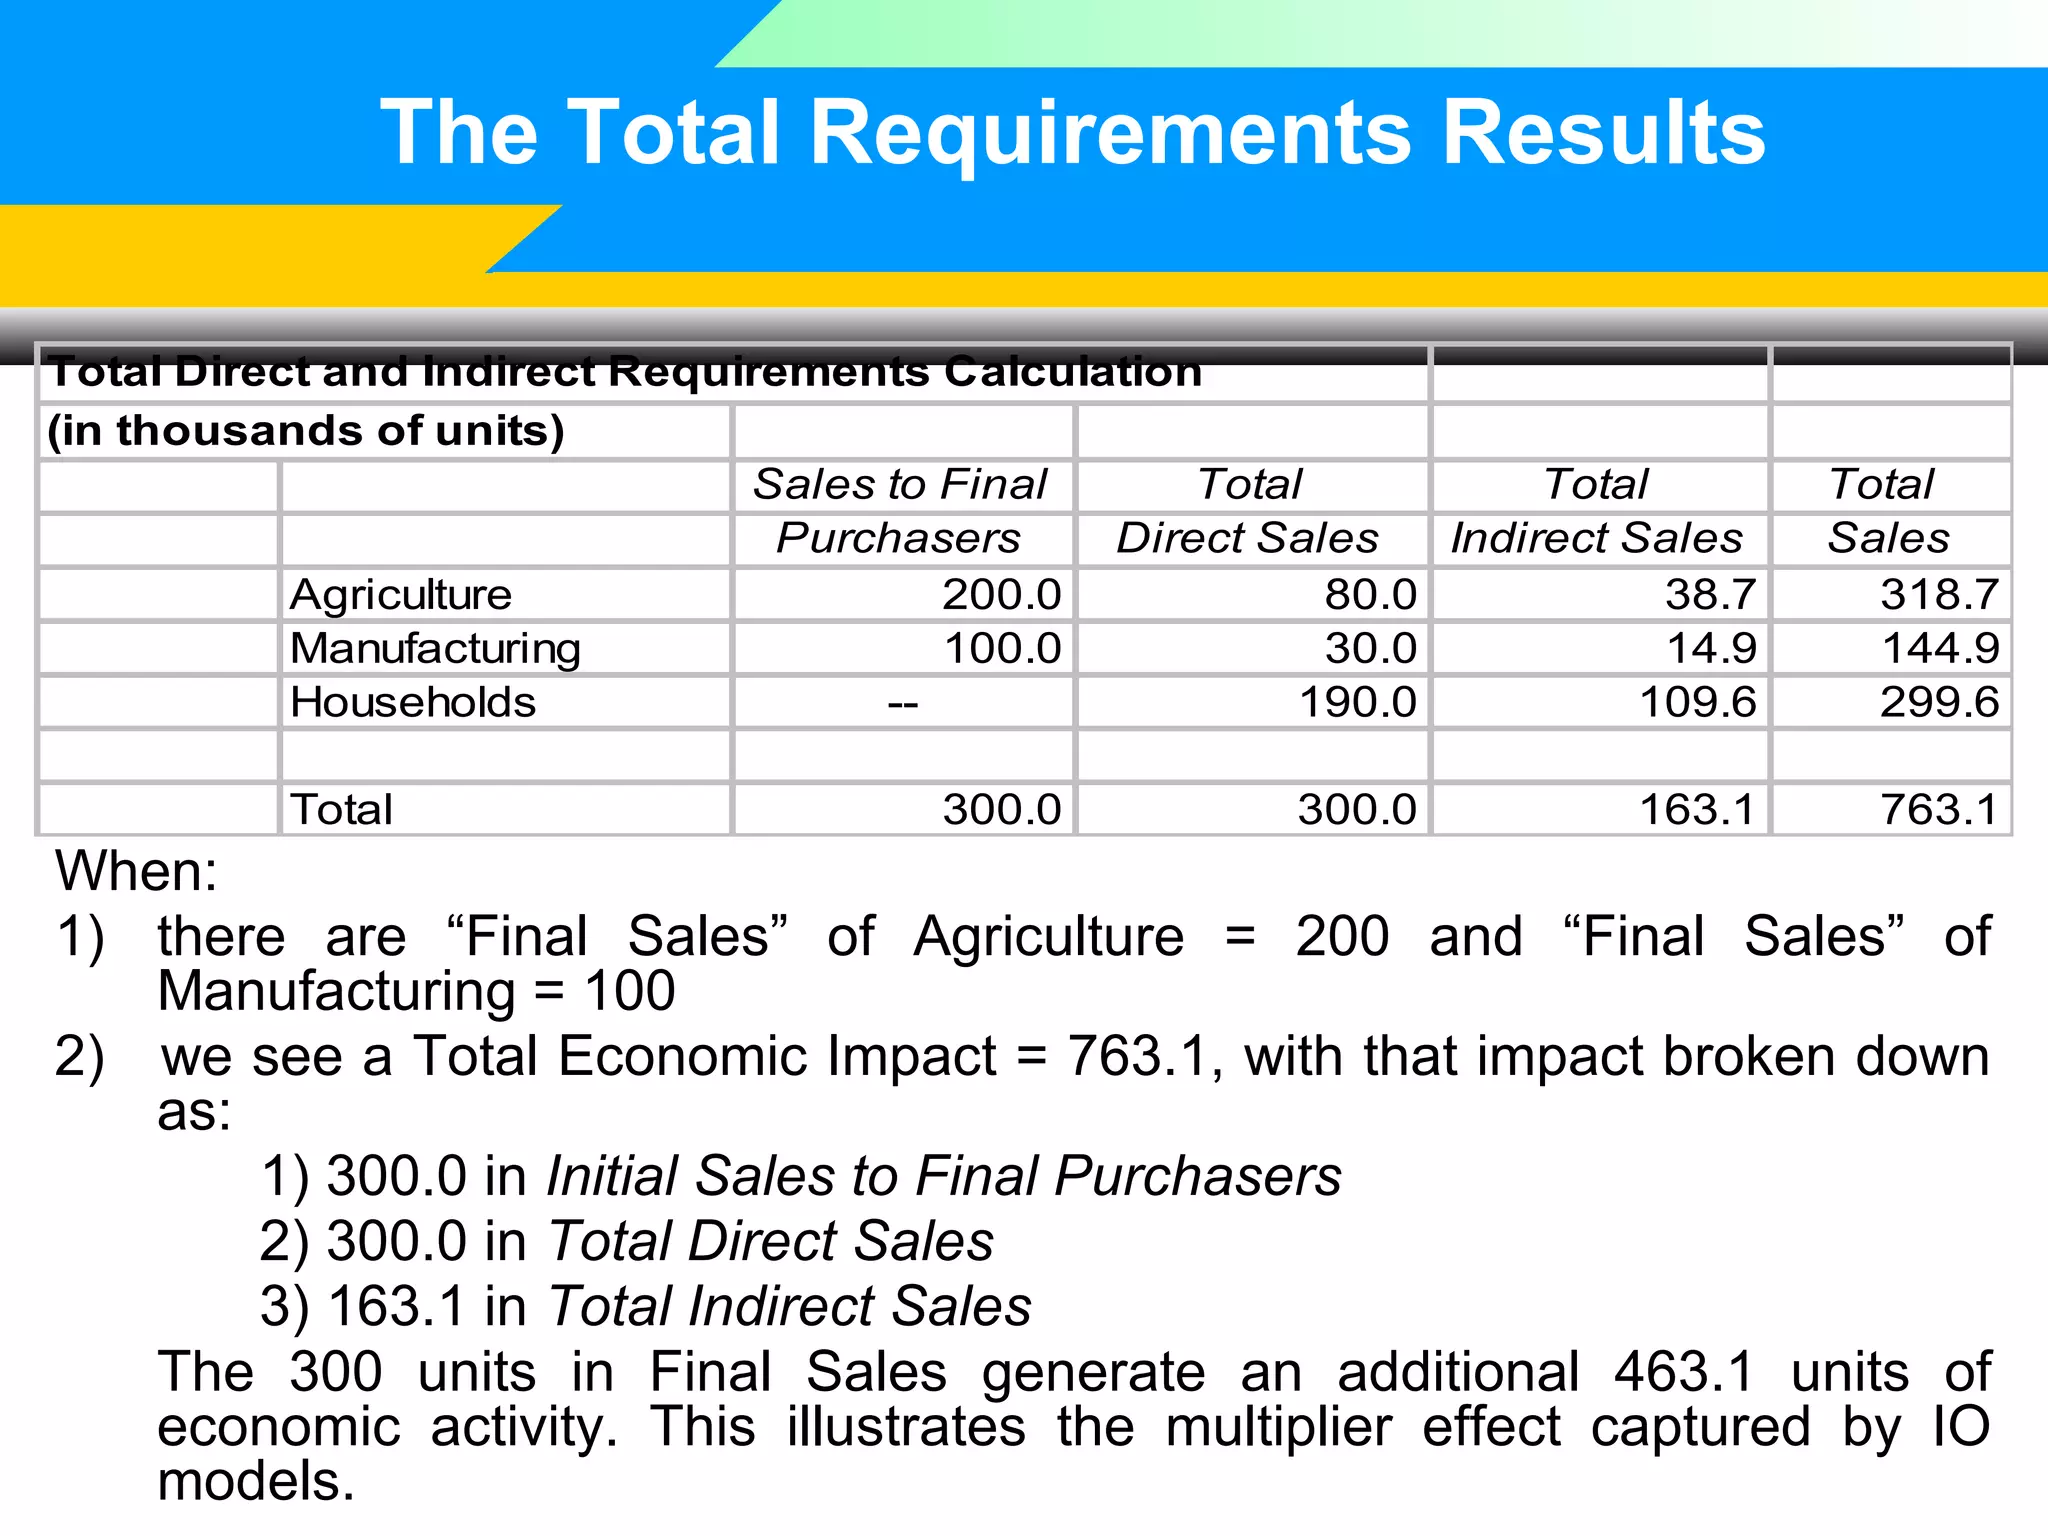
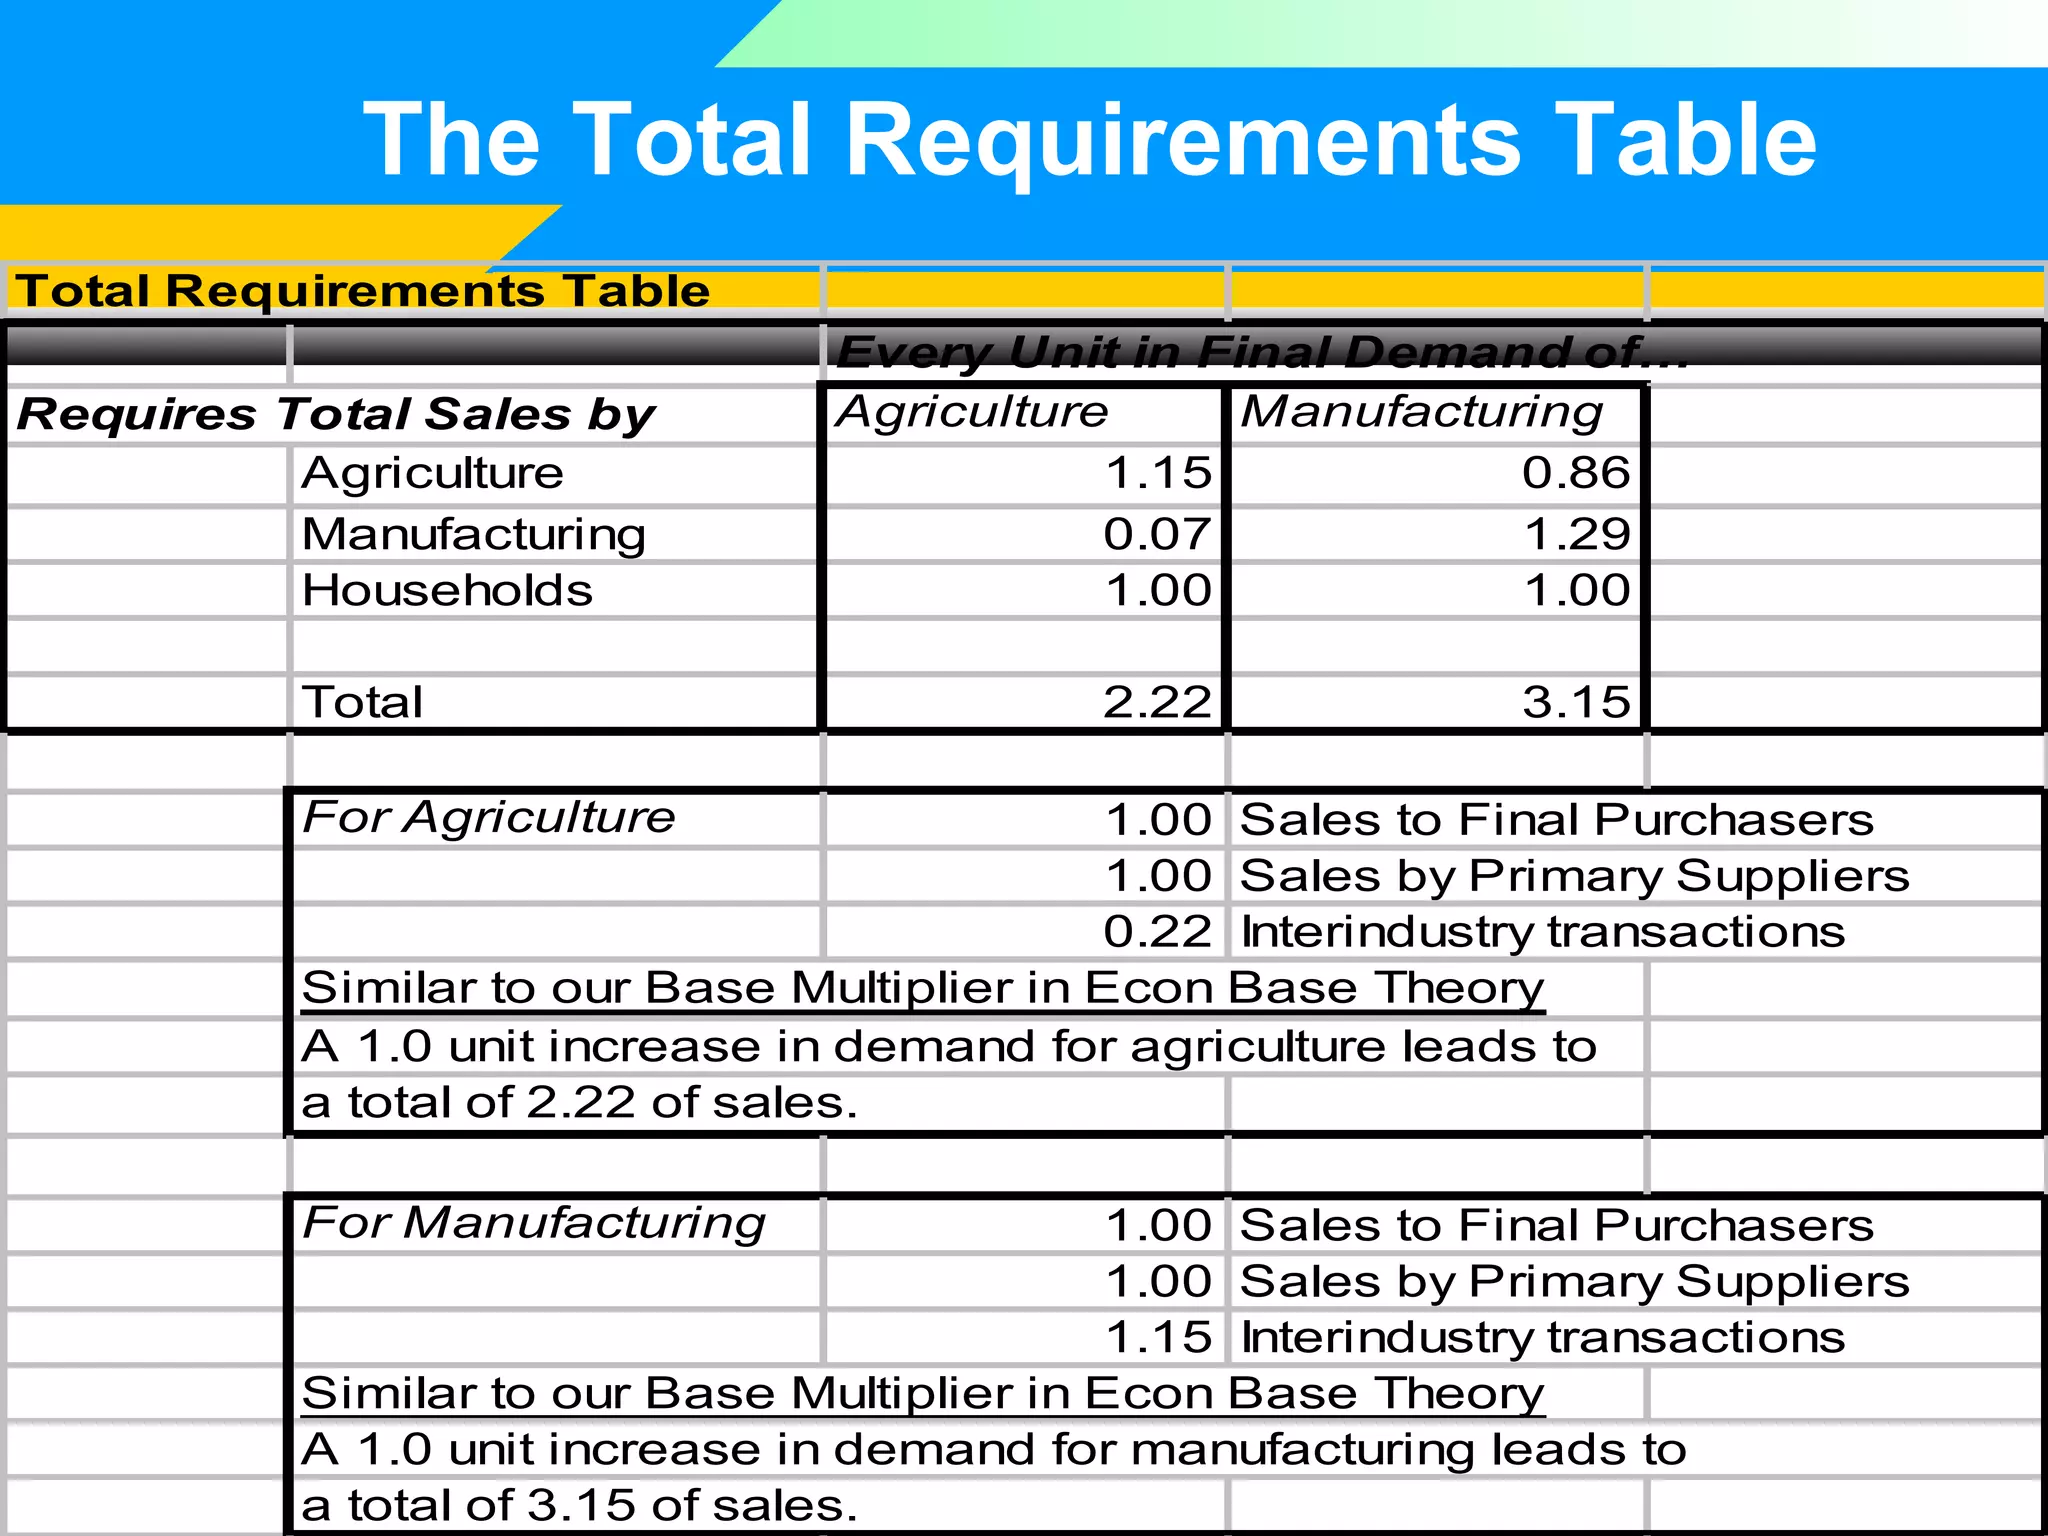
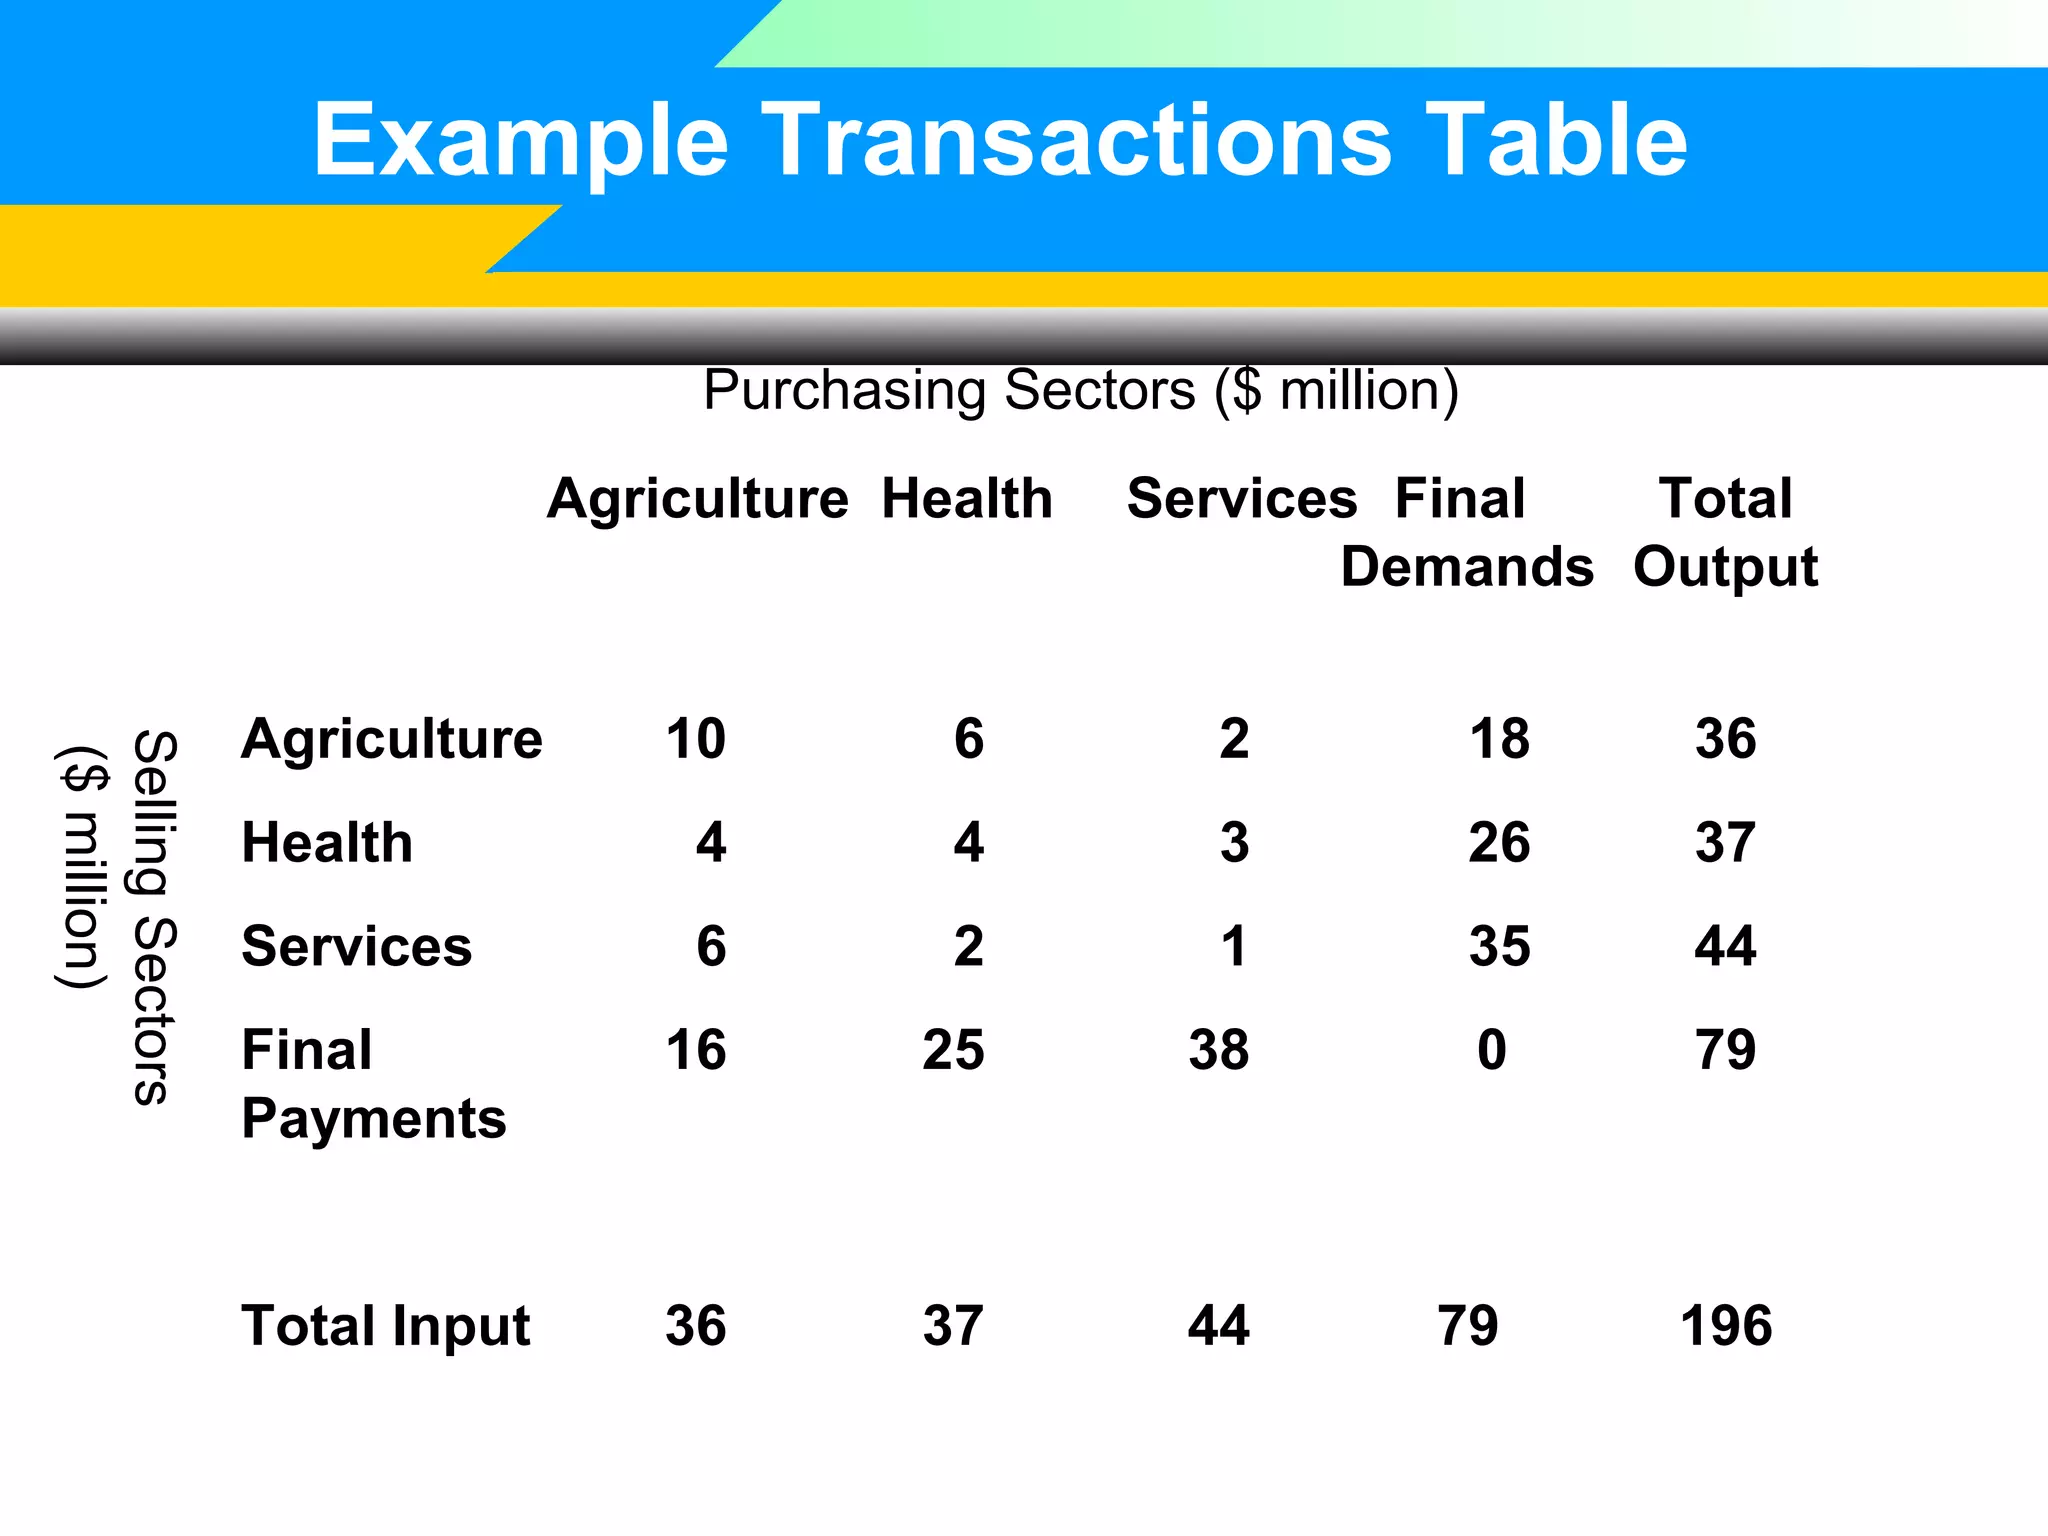
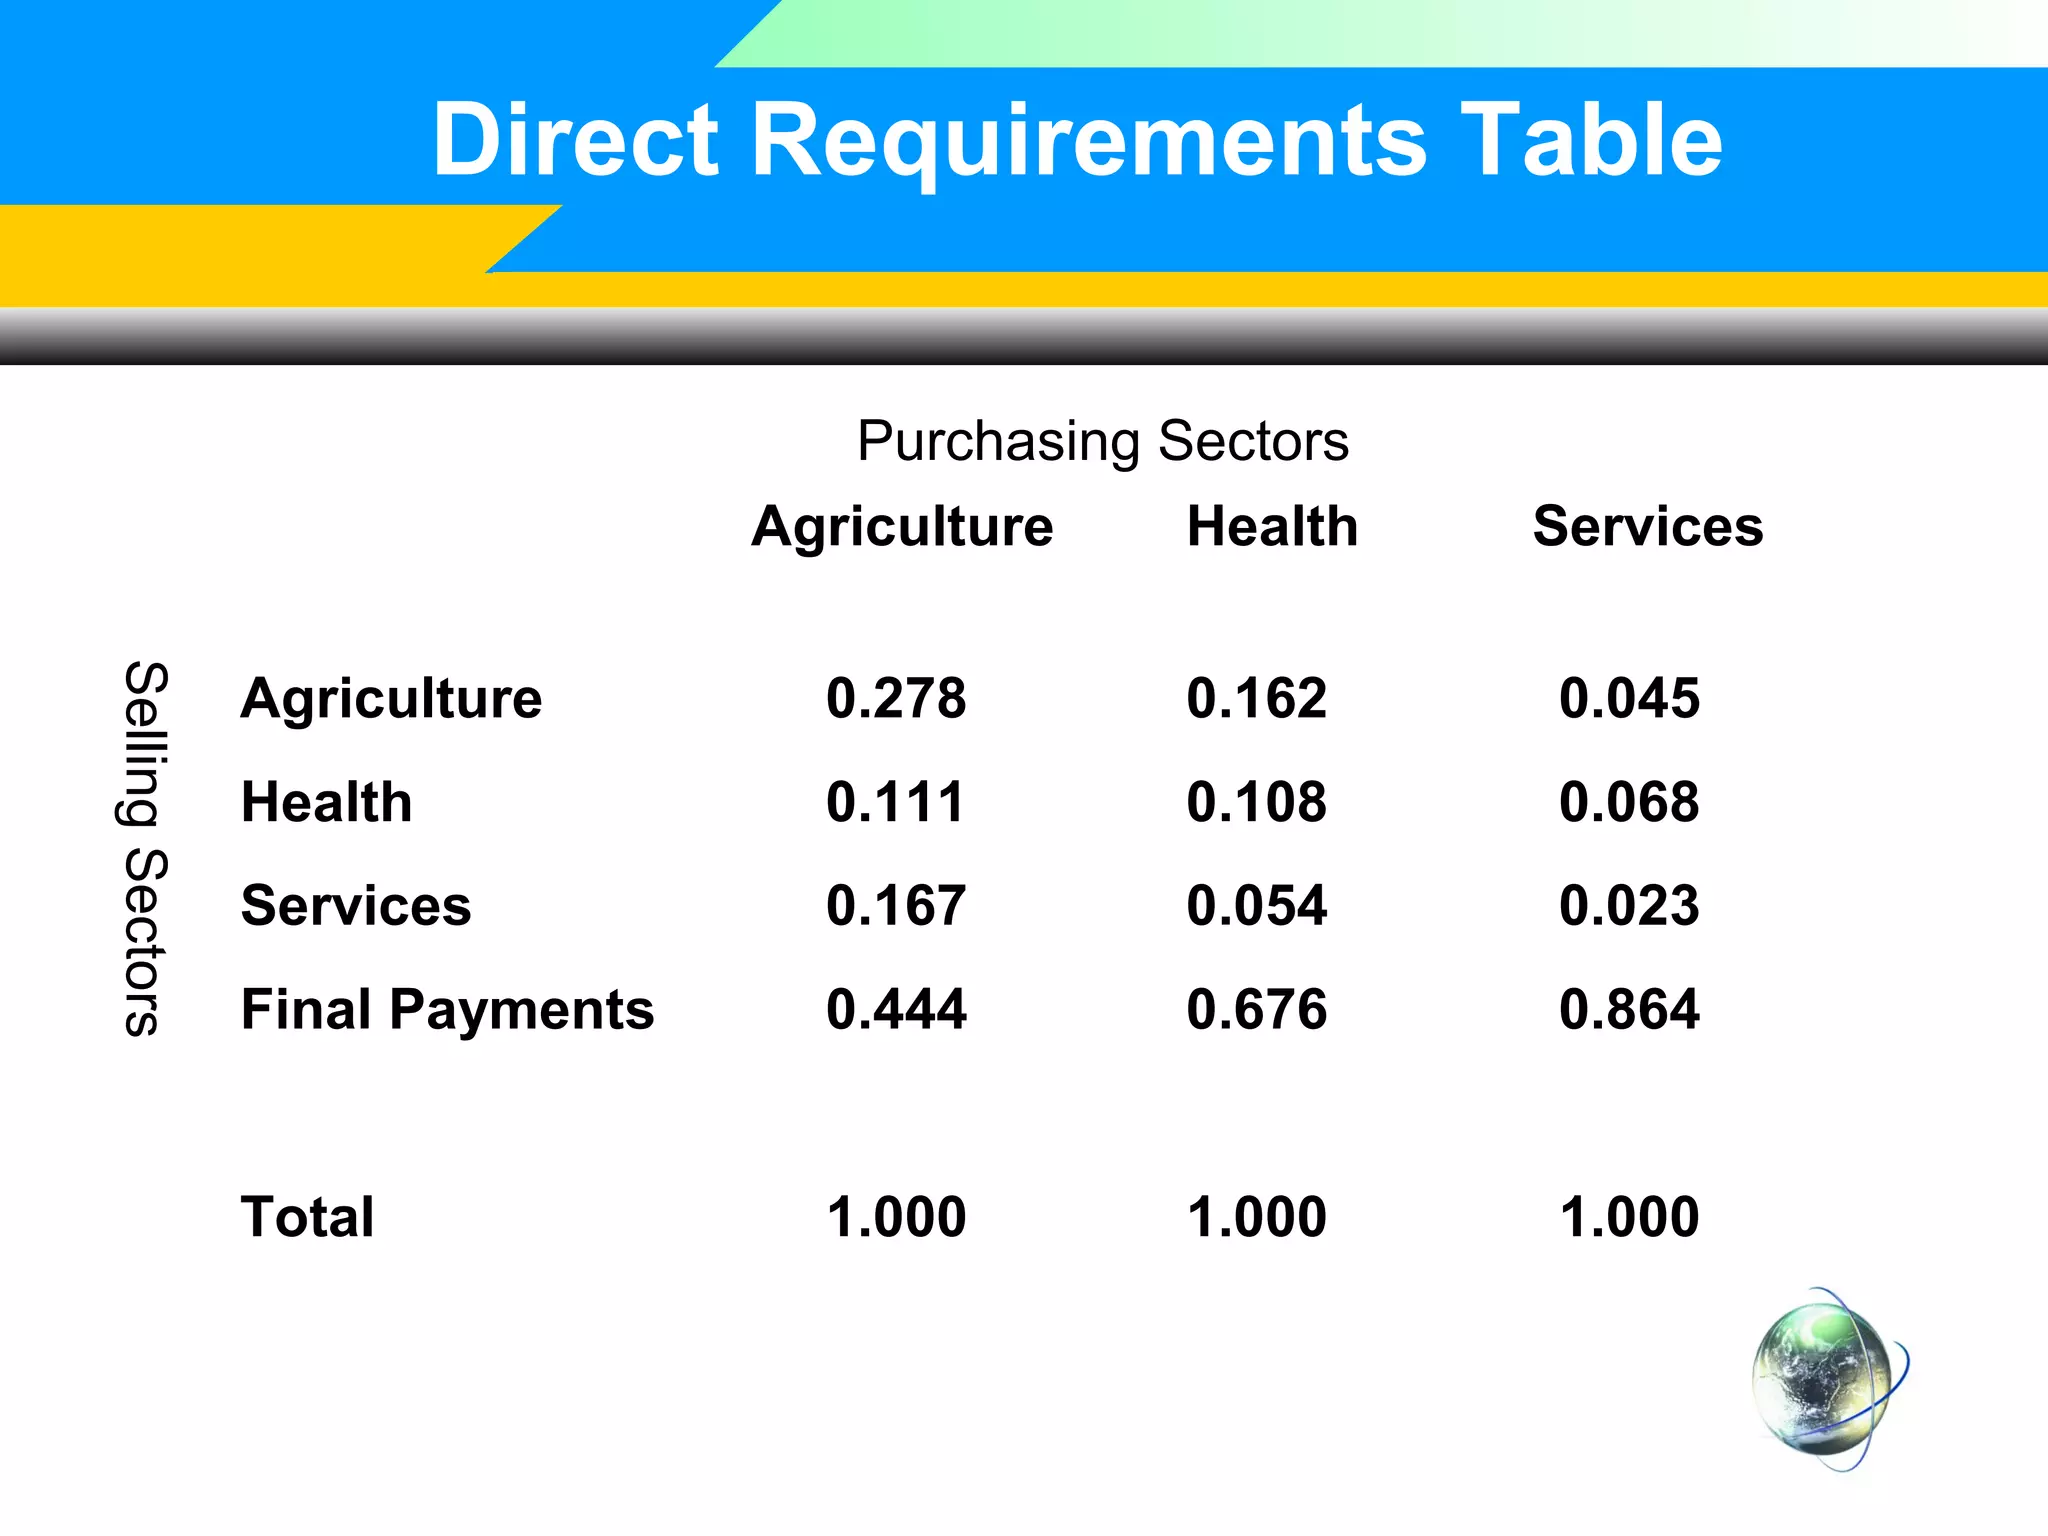
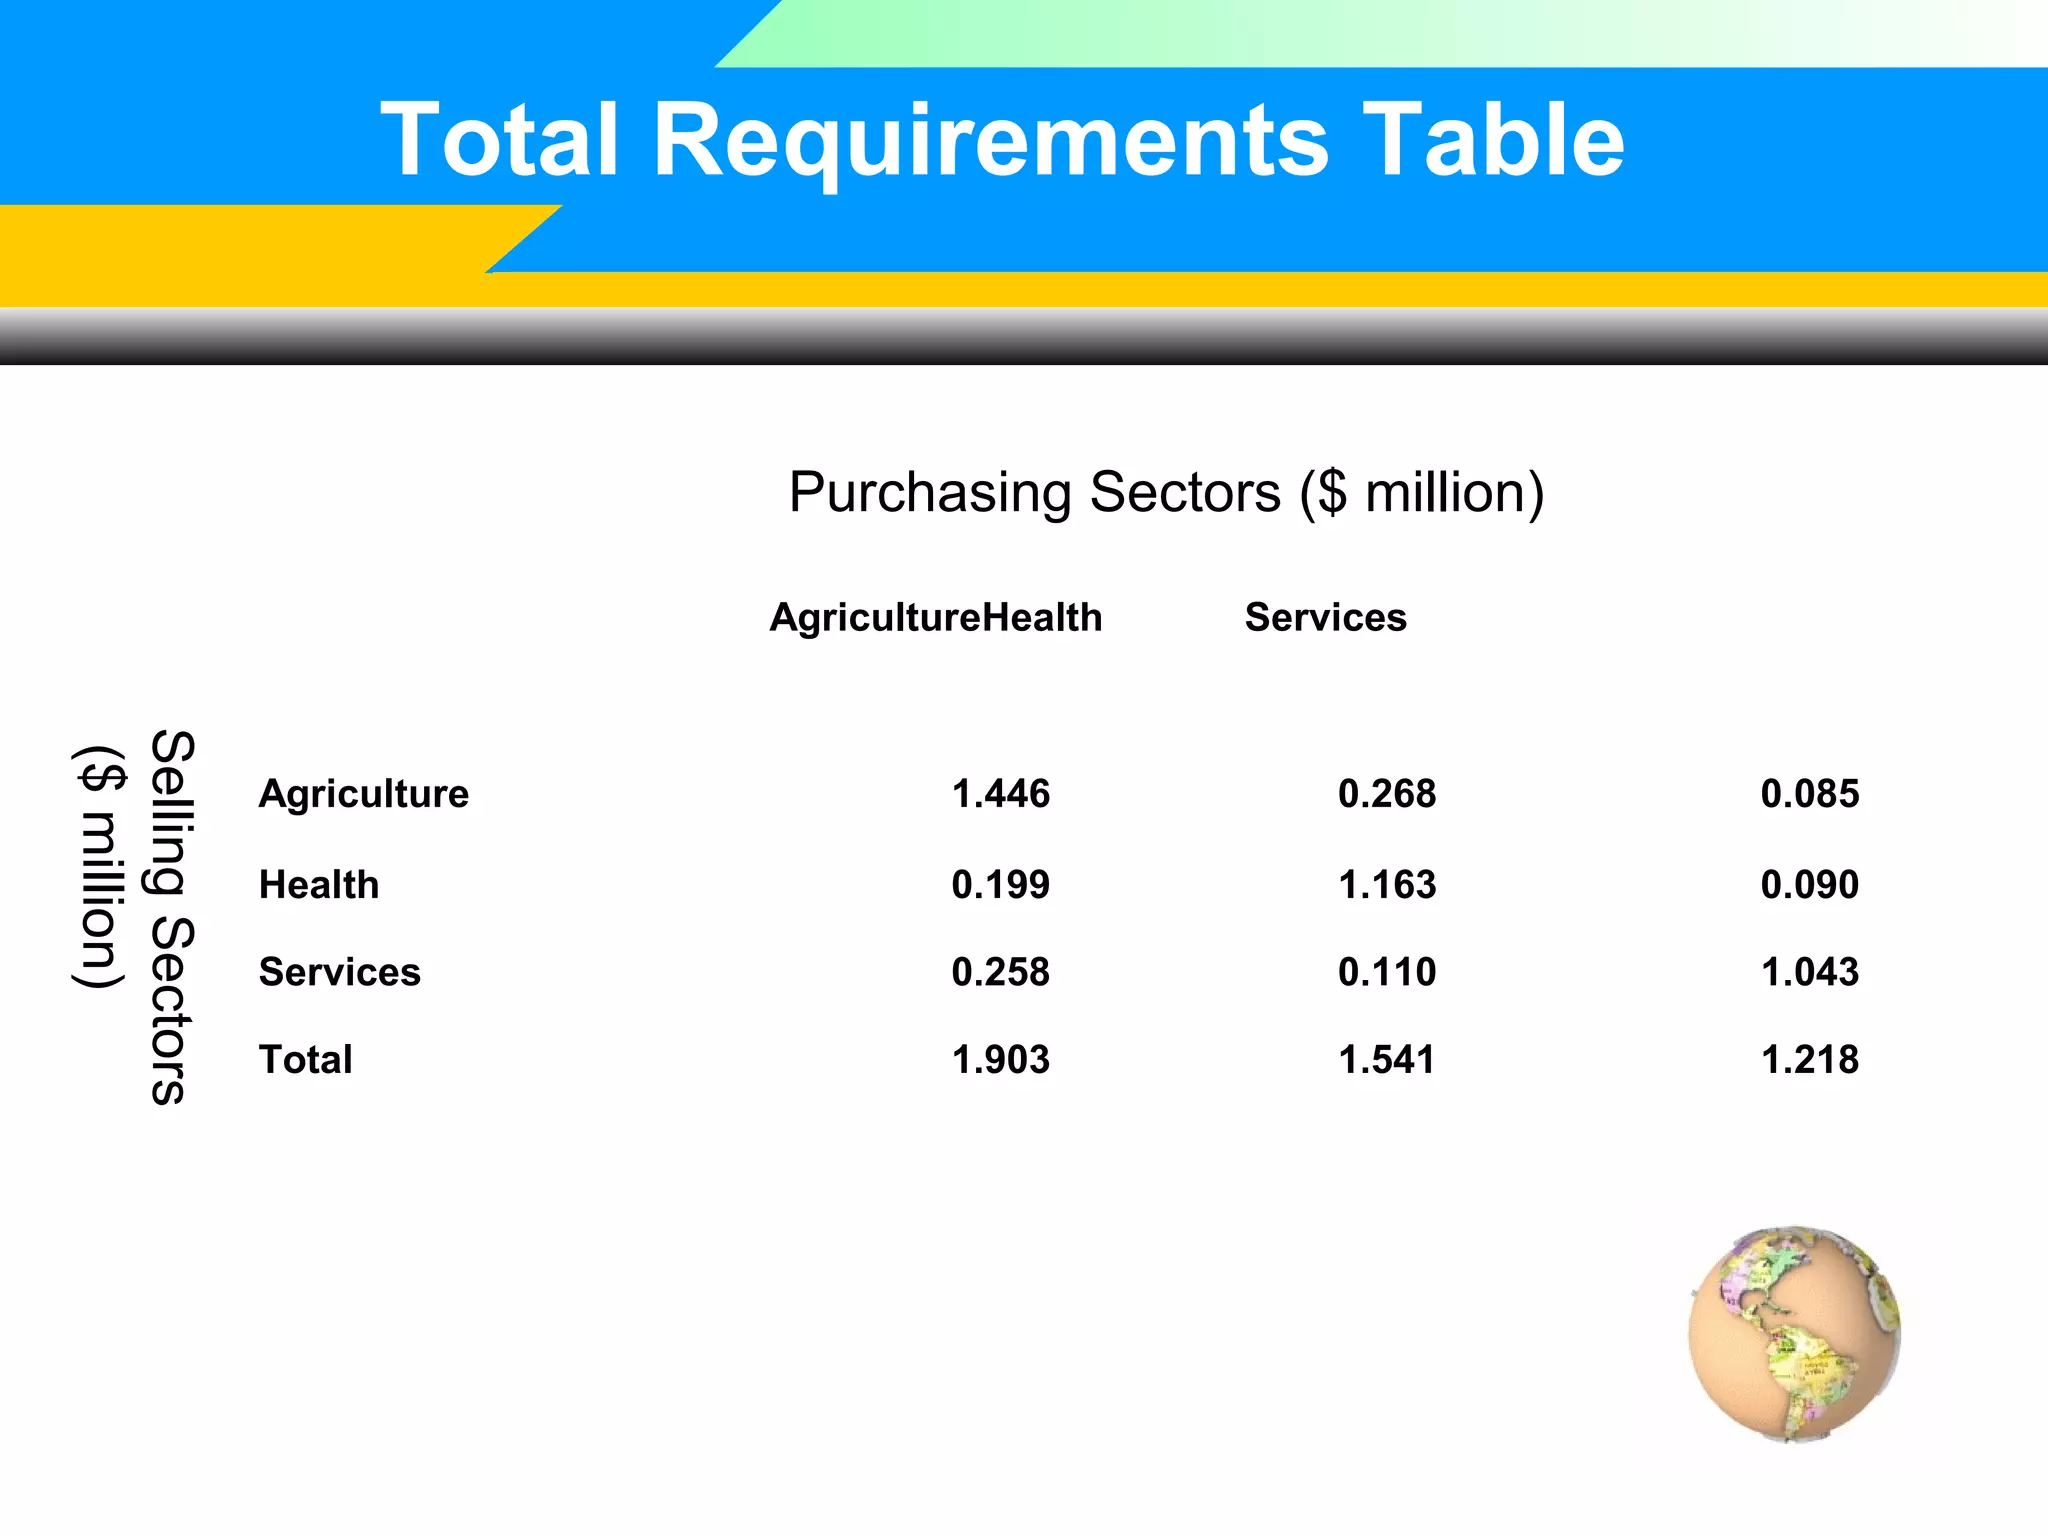
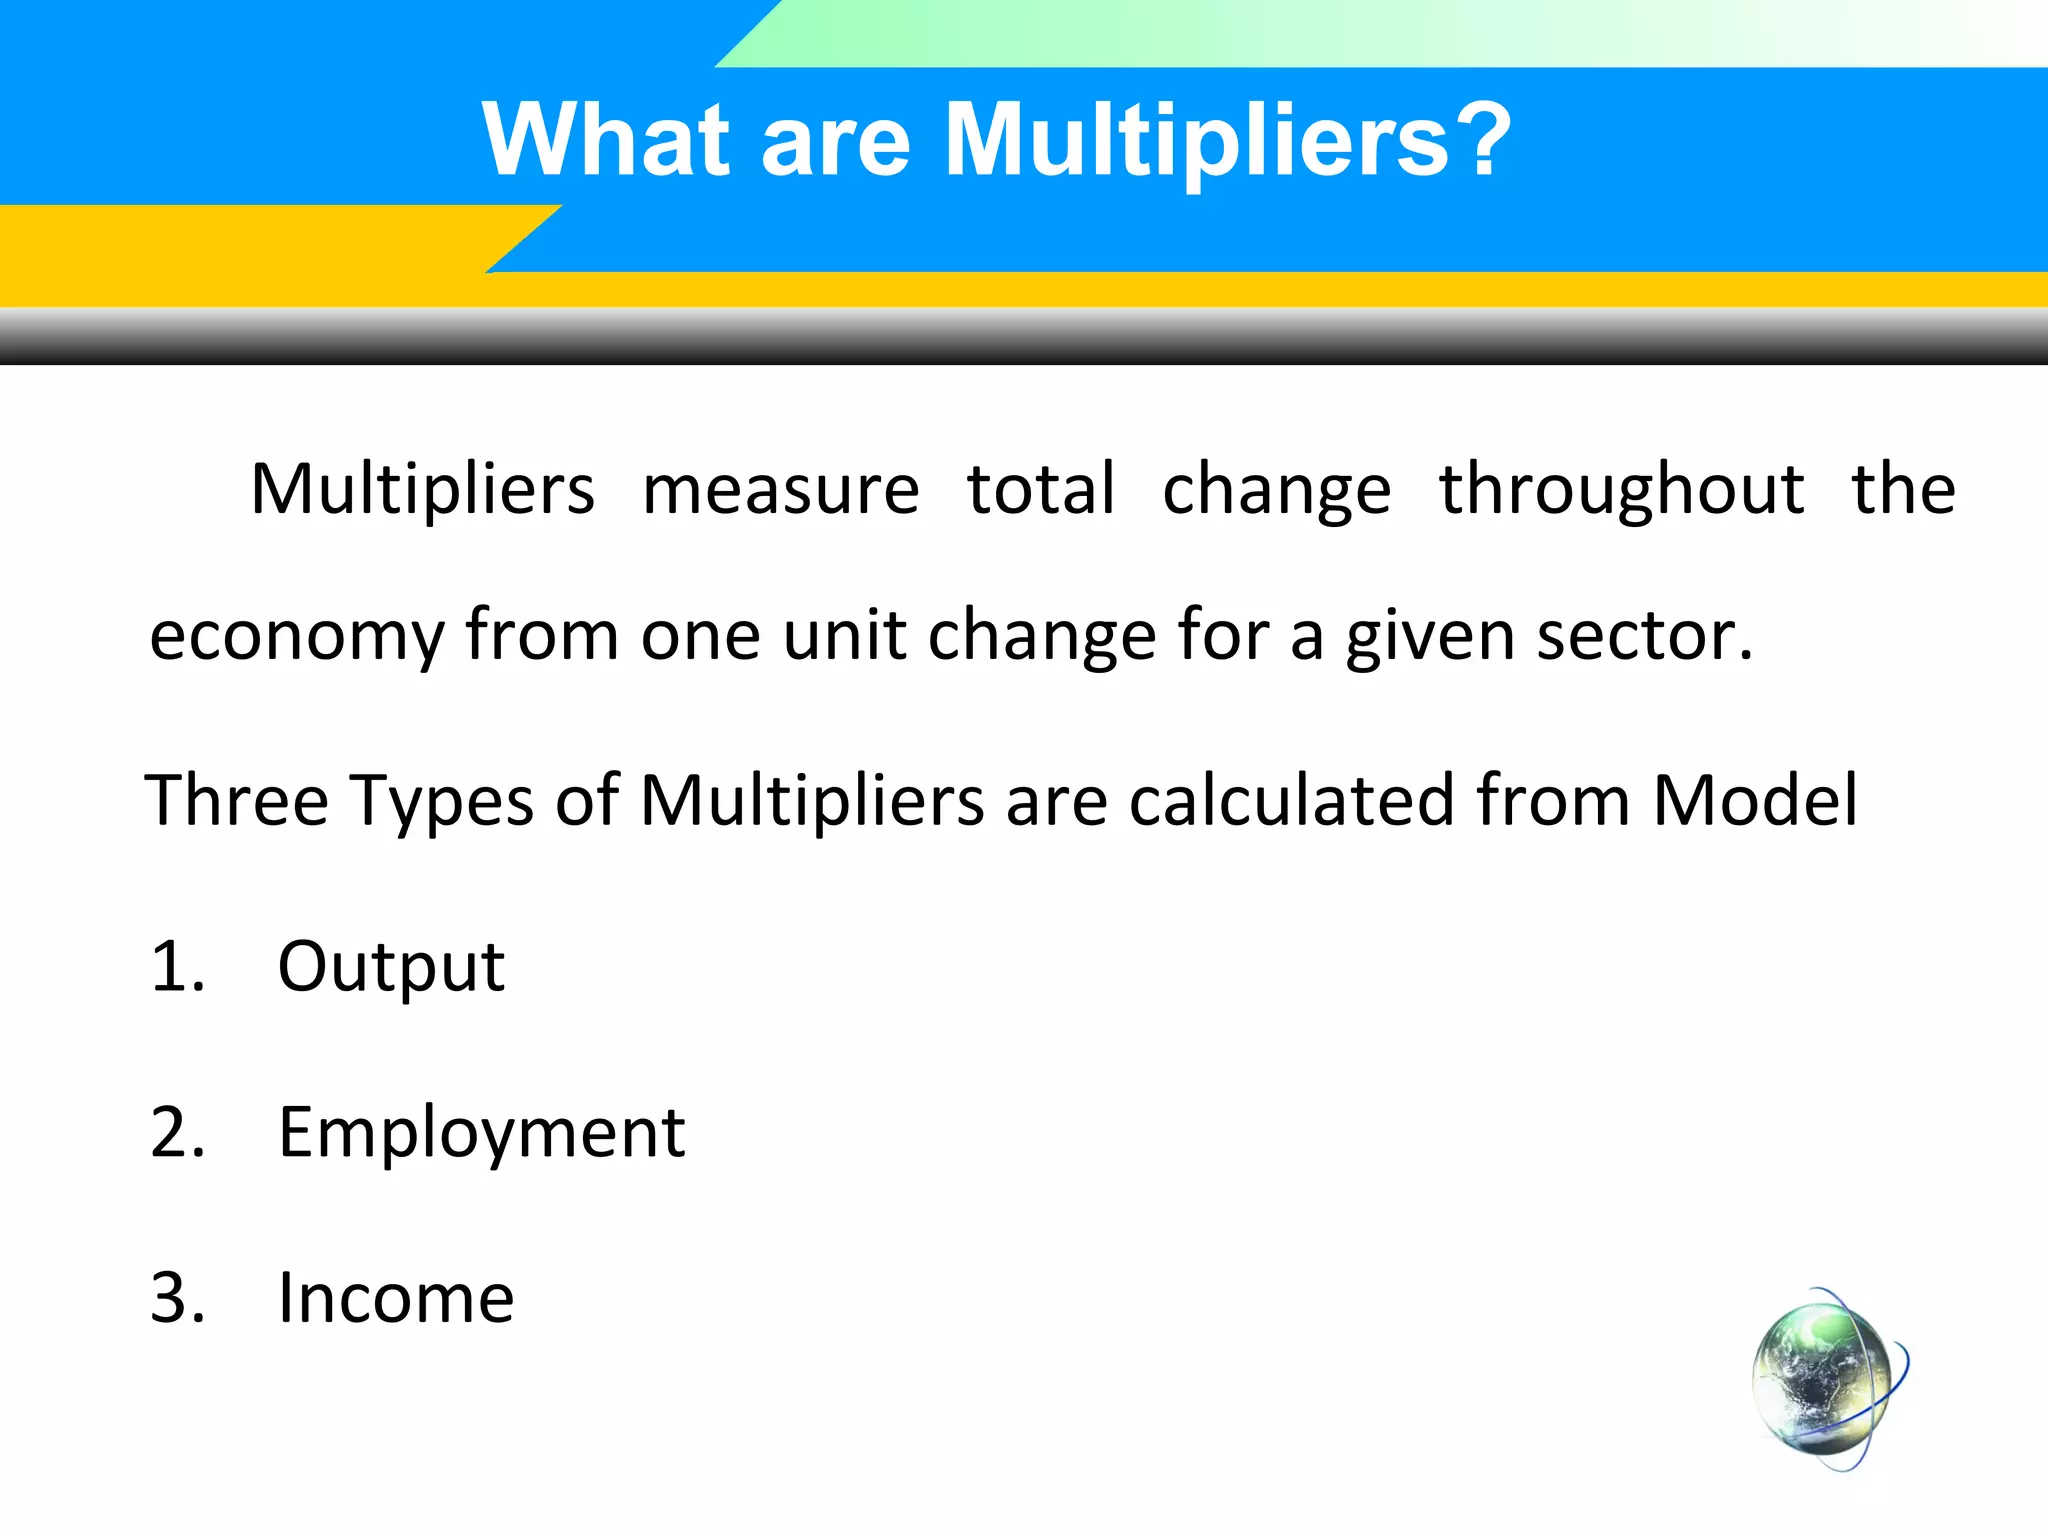
Input Output
Analysis
Welcome to my

Presentation
On November 17, 2013

University of Chinese Academy of Sciences
Presented By

Roni Bhowmik
ID: 2013A8000212129
PhD Student
Academy of Mathematics And Systems Science,
University of Chinese Academy of Sciences
DISSERTATION TITLE
ON
Input Output Analysis.
( 输入输出分析 .)
Bangladesh… at a Glance









Name: People’s Republic of Bangladesh
Area: 147,570 sq. km.
Capital: Dhaka
Government System: Parliamentary
Population: 150 million
Currency: Taka (৳)
Main Export: Garments Product
Official Language: English
Cox’s Bazar (World longest sea beach)
Sundarbans (World largest mangroves
Forest)
Modern Bangladesh

Bangladesh present 2nd position the
Garment Industries in the world

Parliament House * designed by
Louis I. Kahn

Jamuna Bridge * 11th
bridge in the whole world

longest
Honor…The Nobel Peace Prize 2006

Dr. Muhammad Yunus (Banker for the poor) and Grameen Bank
Objective

1. What we have learned about input-output
2.
3.

analysis
One example of the usefulness of inputoutput analysis
The possible ways to improve the inputoutput model
Input-Output Analysis
•Wassily Leontief
b. 1905
•Nobel Prize, 1973

x = (I-A)-1 y

…for the development of the input
output method and for its
application to important economic
problems.
Leontief passed away on Friday February 6th, 1999

Professor deals with this particular question: "What level of output should each of the n industries in an
economy produce, in order that it will just be sufficient to satisfy the total demand for that product?"
Examples of Interrelationships Between Sectors








Sectors
Sectors
Sectors
Sectors
Sectors
Sectors

purchase from other sectors
sell to other sectors
sell outside the local economy
buy outside the local economy
pay their employees
pay taxes

Input-Output analysis creates a picture of a
regional economy describing flows to and
from industries and institutions.
Overview of Community Economic System
Inputs

$

$

Products

Basic
Industry
Labor

$

$

Inputs

Goods &
Services
Households

$

$

Services

$
What Input-Output Analysis Can Do?

 Input-Output Analysis is an accounting framework
(Physical or in Monetary terms)

 Input-Output analysis can be used to predict changes
in overall economic activity as a result of some
change in the local economy
Uses of Input-Output Analysis

 Provides a description of a local economy
 Predictive model to estimate impacts
Input-Output Table
 Producers listed on the left
 Purchasers listed across the top

 From the column point of view, these show each sector’s

inputs; from the row point of view the figures are each
sector’s outputs; hence the name input–output table. These
figures are the core of input–output analysis.
“competitive” and “noncompetitive”

 Competitive imports are goods that have a
domestic counterpart (that is, are also produced
in the Bangladesh).

 Non-competitive
counterpart.

imports

have

no

domestic
The Price Model
Input-Output Models
An input/output table quantifies the transactions
between sectors in an economy.

It’s a “snap-shot” of the economy for a one-year period.
By understanding these linkages, we are able to predict
how a change in one sector will affect the other sectors.

Multipliers can be estimated.
Input-Output Table

Inputs

Outputs

Interindustry Demand

Final Demand

Z

Y

Total Output,

X
Input-Output Models
Three basic components of Input-Output
Models

Transactions Table
Direct Requirements Table
Total Requirements Table
Transactions Table

A transactions table shows the monetary flows of
goods and services in a local economy

Represents monetary flows for a given time period,
usually one year
Transactions Table Flows
Total outlays = Total output
Intermediate purchases are goods and services
purchased and used in the local production process

Final demands are purchases for final consumption
Final payments are payments for factors or inputs
outside intermediate production process
Direct Requirements Table

Direct requirements are the purchases of resources
(inputs) by a sector from all sectors to produce one
dollar of output

Creates a production recipe
The Transaction Table and Direct Reqs. Tables
The Transactions Table
(in thousands of units)
Intermediate Purchasers
--Agriculture --Manufacturing
Intermediate Suppliers
--Agriculture
--Manufacturing
Primary Suppliers
--Households
Total Purchases (inputs)

Final Purchasers
--Households

Total
Sales (outputs)

10
5

30
10

60
35

100
50

85

10

15

110

100

50

110

260

Direct Requirements Table
(in thousands of units)
Purchasers
--Agriculture --Manufacturing
Intermediate Suppliers
--Agriculture
--Manufacturing
Primary Suppliers
--Households
Total Purchases (inputs)

0.10
0.05

0.60
0.20

0.85

0.20

1.00

1.00

Every unit of output
requires inputs of a certain
amount from other areas
of the economy.
The First Round of Economic Impacts
Direct Requirements Table
(in thousands of units)
Intermediate Purchasers
--Agriculture
--Manu
Intermediate Suppliers
--Agriculture
0.10
0.60
--Manufacturing
0.05
0.20
Primary Suppliers
--Households
0.85
0.20
Total Purchases (inputs)

1.00

1.00

Total Requirements Calculation (First Round)
(in thousands of units)
Sales to
Sales as Direct Inputs
Final Purch.
To Agr
To Manu Total
By Agriculture
200
20
60
80
By Manufacturing
100
10
20
30
By Households
0
170
20
190
Total indirect rounds
By All Supliers

300

300

To
Rd. 2
The Second-Fourth Rounds of Econ. Impacts
Total Requirements Calculation (Second Round)
(in thousands of units)
Sales to
Sales as Direct Inputs
Final Purch. To Agr
To Manu Total
By Agriculture
80
8.0
18.0
26.0
By Manufacturing
30
4.0
6.0
10.0
By Households
0
68.0
6.0
74.0
Total indirect rounds

110.0

Total Requirements Calculation (Third Round)
(in thousands of units)
Sales to
Sales as Direct Inputs
Final Purch. To Agr
To Manu Total
By Agriculture
26
2.6
6.0
8.6
By Manufacturing
10
1.3
2.0
3.3
By Households
0
22.1
2.0
24.1
Total indirect rounds

36.0

Total Requirements Calculation (Fourth Round)
(in thousands of units)
Sales to
Sales as Direct Inputs
Final Purch. To Agr
To Manu Total
By Agriculture
8.6
0.9
2.0
2.8
By Manufacturing
3.3
0.4
0.7
1.1
By Households
0
7.3
0.7
8.0
Total indirect rounds

11.9

and so on
until the mult.
effect ends
The Total Requirements Results
Total Direct and Indirect Requirements Calculation
(in thousands of units)
Sales to Final
Total
Total
Purchasers
Direct Sales
Indirect Sales
Agriculture
200.0
80.0
38.7
Manufacturing
100.0
30.0
14.9
Households
-190.0
109.6
Total

300.0

300.0

163.1

Total
Sales
318.7
144.9
299.6
763.1

When:
1) there are “Final Sales” of Agriculture = 200 and “Final Sales” of
Manufacturing = 100
2) we see a Total Economic Impact = 763.1, with that impact broken down
as:
1) 300.0 in Initial Sales to Final Purchasers
2) 300.0 in Total Direct Sales
3) 163.1 in Total Indirect Sales
The 300 units in Final Sales generate an additional 463.1 units of
economic activity. This illustrates the multiplier effect captured by IO
models.
The Total Requirements Table
Total Requirements Table
Requires Total Sales by
Agriculture
Manufacturing
Households
Total

Every Unit in Final Demand of…
Agriculture
Manufacturing
1.15
0.86
0.07
1.29
1.00
1.00
2.22

3.15

For Agriculture

1.00 Sales to Final Purchasers
1.00 Sales by Primary Suppliers
0.22 Interindustry transactions
Similar to our Base Multiplier in Econ Base Theory
A 1.0 unit increase in demand for agriculture leads to
a total of 2.22 of sales.
For Manufacturing

1.00 Sales to Final Purchasers
1.00 Sales by Primary Suppliers
1.15 Interindustry transactions
Similar to our Base Multiplier in Econ Base Theory
A 1.0 unit increase in demand for manufacturing leads to
a total of 3.15 of sales.
Example Transactions Table
Purchasing Sectors ($ million)
Agriculture Health

Selling Sectors
($ million)

Agriculture

Services Final
Total
Demands Output

10

6

2

18

36

Health

4

4

3

26

37

Services

6

2

1

35

44

Final
Payments

16

25

38

0

79

Total Input

36

37

44

79

196
Predictive Use of Input-Output Analysis

Impacts are tracked throughout the economy
The multipliers are derived from regional economic
accounts

Only local transactions are used to create the
multiplier effect
Direct Requirements Table
Purchasing Sectors
Agriculture
Health

Services

Selling Sectors

Agriculture

0.278

0.162

0.045

Health

0.111

0.108

0.068

Services

0.167

0.054

0.023

Final Payments

0.444

0.676

0.864

Total

1.000

1.000

1.000
Total Requirements Table

Purchasing Sectors ($ million)
AgricultureHealth

Services

Selling Sectors
($ million)

Agriculture

1.446

0.268

0.085

Health

0.199

1.163

0.090

Services

0.258

0.110

1.043

Total

1.903

1.541

1.218
What are Multipliers?
Multipliers measure total change throughout the
economy from one unit change for a given sector.
Three Types of Multipliers are calculated from Model
1. Output
2. Employment
3. Income
Three levels of Multipliers

Type I Multipliers
Type II Multipliers
Type III Multipliers
Type I Multipliers
Include direct or initial spending
Include indirect spending or businesses buying and
selling to each other

The multiplier is direct plus indirect effect divided by
direct effect
Type II Multipliers

Includes Type I Multiplier effects
Plus household spending based on the income earned
from the direct and indirect effects – the induced
effects
TYPE III MULTIPLIERS
Type III Multipliers are modified Type II multipliers.
Therefore, Type III Multipliers also include the direct,
indirect, and induced effects.

Type III Multipliers adjust Type II Multipliers based on
spending patterns amongst different income groups.
Caution When Using Multipliers

Multiplier values include direct effects
Do not aggregate sector multipliers to derive an
aggregate multiplier

Be cautious of large multipliers
Be cautious in using a multiplier from another study
area
The Economic Base Theoretical Model
The EB model assumes that the basic sector is the
primary cause of local economic growth; that is, it is the
economic
base
of
the
local
economy.
Non-Local $$$’s

Basic Sector
Employment

Local
$$$’s

Non-Basic Sector
Employment

The Local Economy
How can we use I-O Model?
Example: The effect of fuel tax on Bangladesh economy.
Fuel tax

Demand system

Weight

Income (GDP)
Final demand

I-O Model
Output

Emissions

EIO Model
GDP
Basic Input-Output Problem
The main problem of input-output analysis is the following:
Consider an economy with several industries. Each
industry has a demand for products from other
instructress (internal demand). Because each industry has
homogenous, and only one, production function. There are
also external demands from the outside. Find a production
level for the industries that will meet both internal and
external demands.
Example to show the usefulness of input-output analysis

 IO tables serve primarily statistical purposes and provide an
integrated framework for checking consistency and completeness of
national accounts data.

 IO tables provide the main macroeconomic aggregates such as GDP,
components of value added and output by industry, import, final
consumption, gross capital formation and export.

 IO table describes the supply of goods and services, which are either
produced in the domestic industry or imported.
Simplicity I follow only one product in my
example: Garments Sector
Input-Output
A product by product input-output gtable shows how
much of each product is being used as input for the
production of another product. Similarly, it also shows
how much of each product is consumed by different
user categories (production, households, government,
non-profit institutions serving households, investment
and foreign trade)
Conclusion

 The possible ways to improve the
input-output
situation

model

depend

on
Input output analysis by roni bhowmik

Input output analysis by roni bhowmik

  • 1.
  • 3.
    Welcome to my Presentation OnNovember 17, 2013 University of Chinese Academy of Sciences
  • 4.
    Presented By Roni Bhowmik ID:2013A8000212129 PhD Student Academy of Mathematics And Systems Science, University of Chinese Academy of Sciences
  • 5.
    DISSERTATION TITLE ON Input OutputAnalysis. ( 输入输出分析 .)
  • 6.
    Bangladesh… at aGlance         Name: People’s Republic of Bangladesh Area: 147,570 sq. km. Capital: Dhaka Government System: Parliamentary Population: 150 million Currency: Taka (৳) Main Export: Garments Product Official Language: English
  • 7.
    Cox’s Bazar (Worldlongest sea beach)
  • 8.
    Sundarbans (World largestmangroves Forest)
  • 9.
    Modern Bangladesh Bangladesh present2nd position the Garment Industries in the world Parliament House * designed by Louis I. Kahn Jamuna Bridge * 11th bridge in the whole world longest
  • 10.
    Honor…The Nobel PeacePrize 2006 Dr. Muhammad Yunus (Banker for the poor) and Grameen Bank
  • 11.
    Objective 1. What wehave learned about input-output 2. 3. analysis One example of the usefulness of inputoutput analysis The possible ways to improve the inputoutput model
  • 12.
    Input-Output Analysis •Wassily Leontief b.1905 •Nobel Prize, 1973 x = (I-A)-1 y …for the development of the input output method and for its application to important economic problems. Leontief passed away on Friday February 6th, 1999 Professor deals with this particular question: "What level of output should each of the n industries in an economy produce, in order that it will just be sufficient to satisfy the total demand for that product?"
  • 13.
    Examples of InterrelationshipsBetween Sectors       Sectors Sectors Sectors Sectors Sectors Sectors purchase from other sectors sell to other sectors sell outside the local economy buy outside the local economy pay their employees pay taxes Input-Output analysis creates a picture of a regional economy describing flows to and from industries and institutions.
  • 14.
    Overview of CommunityEconomic System Inputs $ $ Products Basic Industry Labor $ $ Inputs Goods & Services Households $ $ Services $
  • 15.
    What Input-Output AnalysisCan Do?  Input-Output Analysis is an accounting framework (Physical or in Monetary terms)  Input-Output analysis can be used to predict changes in overall economic activity as a result of some change in the local economy
  • 16.
    Uses of Input-OutputAnalysis  Provides a description of a local economy  Predictive model to estimate impacts
  • 17.
    Input-Output Table  Producerslisted on the left  Purchasers listed across the top  From the column point of view, these show each sector’s inputs; from the row point of view the figures are each sector’s outputs; hence the name input–output table. These figures are the core of input–output analysis.
  • 18.
    “competitive” and “noncompetitive” Competitive imports are goods that have a domestic counterpart (that is, are also produced in the Bangladesh).  Non-competitive counterpart. imports have no domestic
  • 19.
  • 20.
    Input-Output Models An input/outputtable quantifies the transactions between sectors in an economy. It’s a “snap-shot” of the economy for a one-year period. By understanding these linkages, we are able to predict how a change in one sector will affect the other sectors. Multipliers can be estimated.
  • 21.
  • 22.
    Input-Output Models Three basiccomponents of Input-Output Models Transactions Table Direct Requirements Table Total Requirements Table
  • 23.
    Transactions Table A transactionstable shows the monetary flows of goods and services in a local economy Represents monetary flows for a given time period, usually one year
  • 24.
    Transactions Table Flows Totaloutlays = Total output Intermediate purchases are goods and services purchased and used in the local production process Final demands are purchases for final consumption Final payments are payments for factors or inputs outside intermediate production process
  • 25.
    Direct Requirements Table Directrequirements are the purchases of resources (inputs) by a sector from all sectors to produce one dollar of output Creates a production recipe
  • 26.
    The Transaction Tableand Direct Reqs. Tables The Transactions Table (in thousands of units) Intermediate Purchasers --Agriculture --Manufacturing Intermediate Suppliers --Agriculture --Manufacturing Primary Suppliers --Households Total Purchases (inputs) Final Purchasers --Households Total Sales (outputs) 10 5 30 10 60 35 100 50 85 10 15 110 100 50 110 260 Direct Requirements Table (in thousands of units) Purchasers --Agriculture --Manufacturing Intermediate Suppliers --Agriculture --Manufacturing Primary Suppliers --Households Total Purchases (inputs) 0.10 0.05 0.60 0.20 0.85 0.20 1.00 1.00 Every unit of output requires inputs of a certain amount from other areas of the economy.
  • 27.
    The First Roundof Economic Impacts Direct Requirements Table (in thousands of units) Intermediate Purchasers --Agriculture --Manu Intermediate Suppliers --Agriculture 0.10 0.60 --Manufacturing 0.05 0.20 Primary Suppliers --Households 0.85 0.20 Total Purchases (inputs) 1.00 1.00 Total Requirements Calculation (First Round) (in thousands of units) Sales to Sales as Direct Inputs Final Purch. To Agr To Manu Total By Agriculture 200 20 60 80 By Manufacturing 100 10 20 30 By Households 0 170 20 190 Total indirect rounds By All Supliers 300 300 To Rd. 2
  • 28.
    The Second-Fourth Roundsof Econ. Impacts Total Requirements Calculation (Second Round) (in thousands of units) Sales to Sales as Direct Inputs Final Purch. To Agr To Manu Total By Agriculture 80 8.0 18.0 26.0 By Manufacturing 30 4.0 6.0 10.0 By Households 0 68.0 6.0 74.0 Total indirect rounds 110.0 Total Requirements Calculation (Third Round) (in thousands of units) Sales to Sales as Direct Inputs Final Purch. To Agr To Manu Total By Agriculture 26 2.6 6.0 8.6 By Manufacturing 10 1.3 2.0 3.3 By Households 0 22.1 2.0 24.1 Total indirect rounds 36.0 Total Requirements Calculation (Fourth Round) (in thousands of units) Sales to Sales as Direct Inputs Final Purch. To Agr To Manu Total By Agriculture 8.6 0.9 2.0 2.8 By Manufacturing 3.3 0.4 0.7 1.1 By Households 0 7.3 0.7 8.0 Total indirect rounds 11.9 and so on until the mult. effect ends
  • 29.
    The Total RequirementsResults Total Direct and Indirect Requirements Calculation (in thousands of units) Sales to Final Total Total Purchasers Direct Sales Indirect Sales Agriculture 200.0 80.0 38.7 Manufacturing 100.0 30.0 14.9 Households -190.0 109.6 Total 300.0 300.0 163.1 Total Sales 318.7 144.9 299.6 763.1 When: 1) there are “Final Sales” of Agriculture = 200 and “Final Sales” of Manufacturing = 100 2) we see a Total Economic Impact = 763.1, with that impact broken down as: 1) 300.0 in Initial Sales to Final Purchasers 2) 300.0 in Total Direct Sales 3) 163.1 in Total Indirect Sales The 300 units in Final Sales generate an additional 463.1 units of economic activity. This illustrates the multiplier effect captured by IO models.
  • 30.
    The Total RequirementsTable Total Requirements Table Requires Total Sales by Agriculture Manufacturing Households Total Every Unit in Final Demand of… Agriculture Manufacturing 1.15 0.86 0.07 1.29 1.00 1.00 2.22 3.15 For Agriculture 1.00 Sales to Final Purchasers 1.00 Sales by Primary Suppliers 0.22 Interindustry transactions Similar to our Base Multiplier in Econ Base Theory A 1.0 unit increase in demand for agriculture leads to a total of 2.22 of sales. For Manufacturing 1.00 Sales to Final Purchasers 1.00 Sales by Primary Suppliers 1.15 Interindustry transactions Similar to our Base Multiplier in Econ Base Theory A 1.0 unit increase in demand for manufacturing leads to a total of 3.15 of sales.
  • 31.
    Example Transactions Table PurchasingSectors ($ million) Agriculture Health Selling Sectors ($ million) Agriculture Services Final Total Demands Output 10 6 2 18 36 Health 4 4 3 26 37 Services 6 2 1 35 44 Final Payments 16 25 38 0 79 Total Input 36 37 44 79 196
  • 32.
    Predictive Use ofInput-Output Analysis Impacts are tracked throughout the economy The multipliers are derived from regional economic accounts Only local transactions are used to create the multiplier effect
  • 33.
    Direct Requirements Table PurchasingSectors Agriculture Health Services Selling Sectors Agriculture 0.278 0.162 0.045 Health 0.111 0.108 0.068 Services 0.167 0.054 0.023 Final Payments 0.444 0.676 0.864 Total 1.000 1.000 1.000
  • 34.
    Total Requirements Table PurchasingSectors ($ million) AgricultureHealth Services Selling Sectors ($ million) Agriculture 1.446 0.268 0.085 Health 0.199 1.163 0.090 Services 0.258 0.110 1.043 Total 1.903 1.541 1.218
  • 35.
    What are Multipliers? Multipliersmeasure total change throughout the economy from one unit change for a given sector. Three Types of Multipliers are calculated from Model 1. Output 2. Employment 3. Income
  • 36.
    Three levels ofMultipliers Type I Multipliers Type II Multipliers Type III Multipliers
  • 37.
    Type I Multipliers Includedirect or initial spending Include indirect spending or businesses buying and selling to each other The multiplier is direct plus indirect effect divided by direct effect
  • 38.
    Type II Multipliers IncludesType I Multiplier effects Plus household spending based on the income earned from the direct and indirect effects – the induced effects
  • 39.
    TYPE III MULTIPLIERS TypeIII Multipliers are modified Type II multipliers. Therefore, Type III Multipliers also include the direct, indirect, and induced effects. Type III Multipliers adjust Type II Multipliers based on spending patterns amongst different income groups.
  • 40.
    Caution When UsingMultipliers Multiplier values include direct effects Do not aggregate sector multipliers to derive an aggregate multiplier Be cautious of large multipliers Be cautious in using a multiplier from another study area
  • 41.
    The Economic BaseTheoretical Model The EB model assumes that the basic sector is the primary cause of local economic growth; that is, it is the economic base of the local economy. Non-Local $$$’s Basic Sector Employment Local $$$’s Non-Basic Sector Employment The Local Economy
  • 42.
    How can weuse I-O Model? Example: The effect of fuel tax on Bangladesh economy. Fuel tax Demand system Weight Income (GDP) Final demand I-O Model Output Emissions EIO Model GDP
  • 43.
    Basic Input-Output Problem Themain problem of input-output analysis is the following: Consider an economy with several industries. Each industry has a demand for products from other instructress (internal demand). Because each industry has homogenous, and only one, production function. There are also external demands from the outside. Find a production level for the industries that will meet both internal and external demands.
  • 44.
    Example to showthe usefulness of input-output analysis  IO tables serve primarily statistical purposes and provide an integrated framework for checking consistency and completeness of national accounts data.  IO tables provide the main macroeconomic aggregates such as GDP, components of value added and output by industry, import, final consumption, gross capital formation and export.  IO table describes the supply of goods and services, which are either produced in the domestic industry or imported.
  • 46.
    Simplicity I followonly one product in my example: Garments Sector
  • 47.
    Input-Output A product byproduct input-output gtable shows how much of each product is being used as input for the production of another product. Similarly, it also shows how much of each product is consumed by different user categories (production, households, government, non-profit institutions serving households, investment and foreign trade)
  • 48.
    Conclusion  The possibleways to improve the input-output situation model depend on