The document discusses various methods and techniques of regional analysis, including:
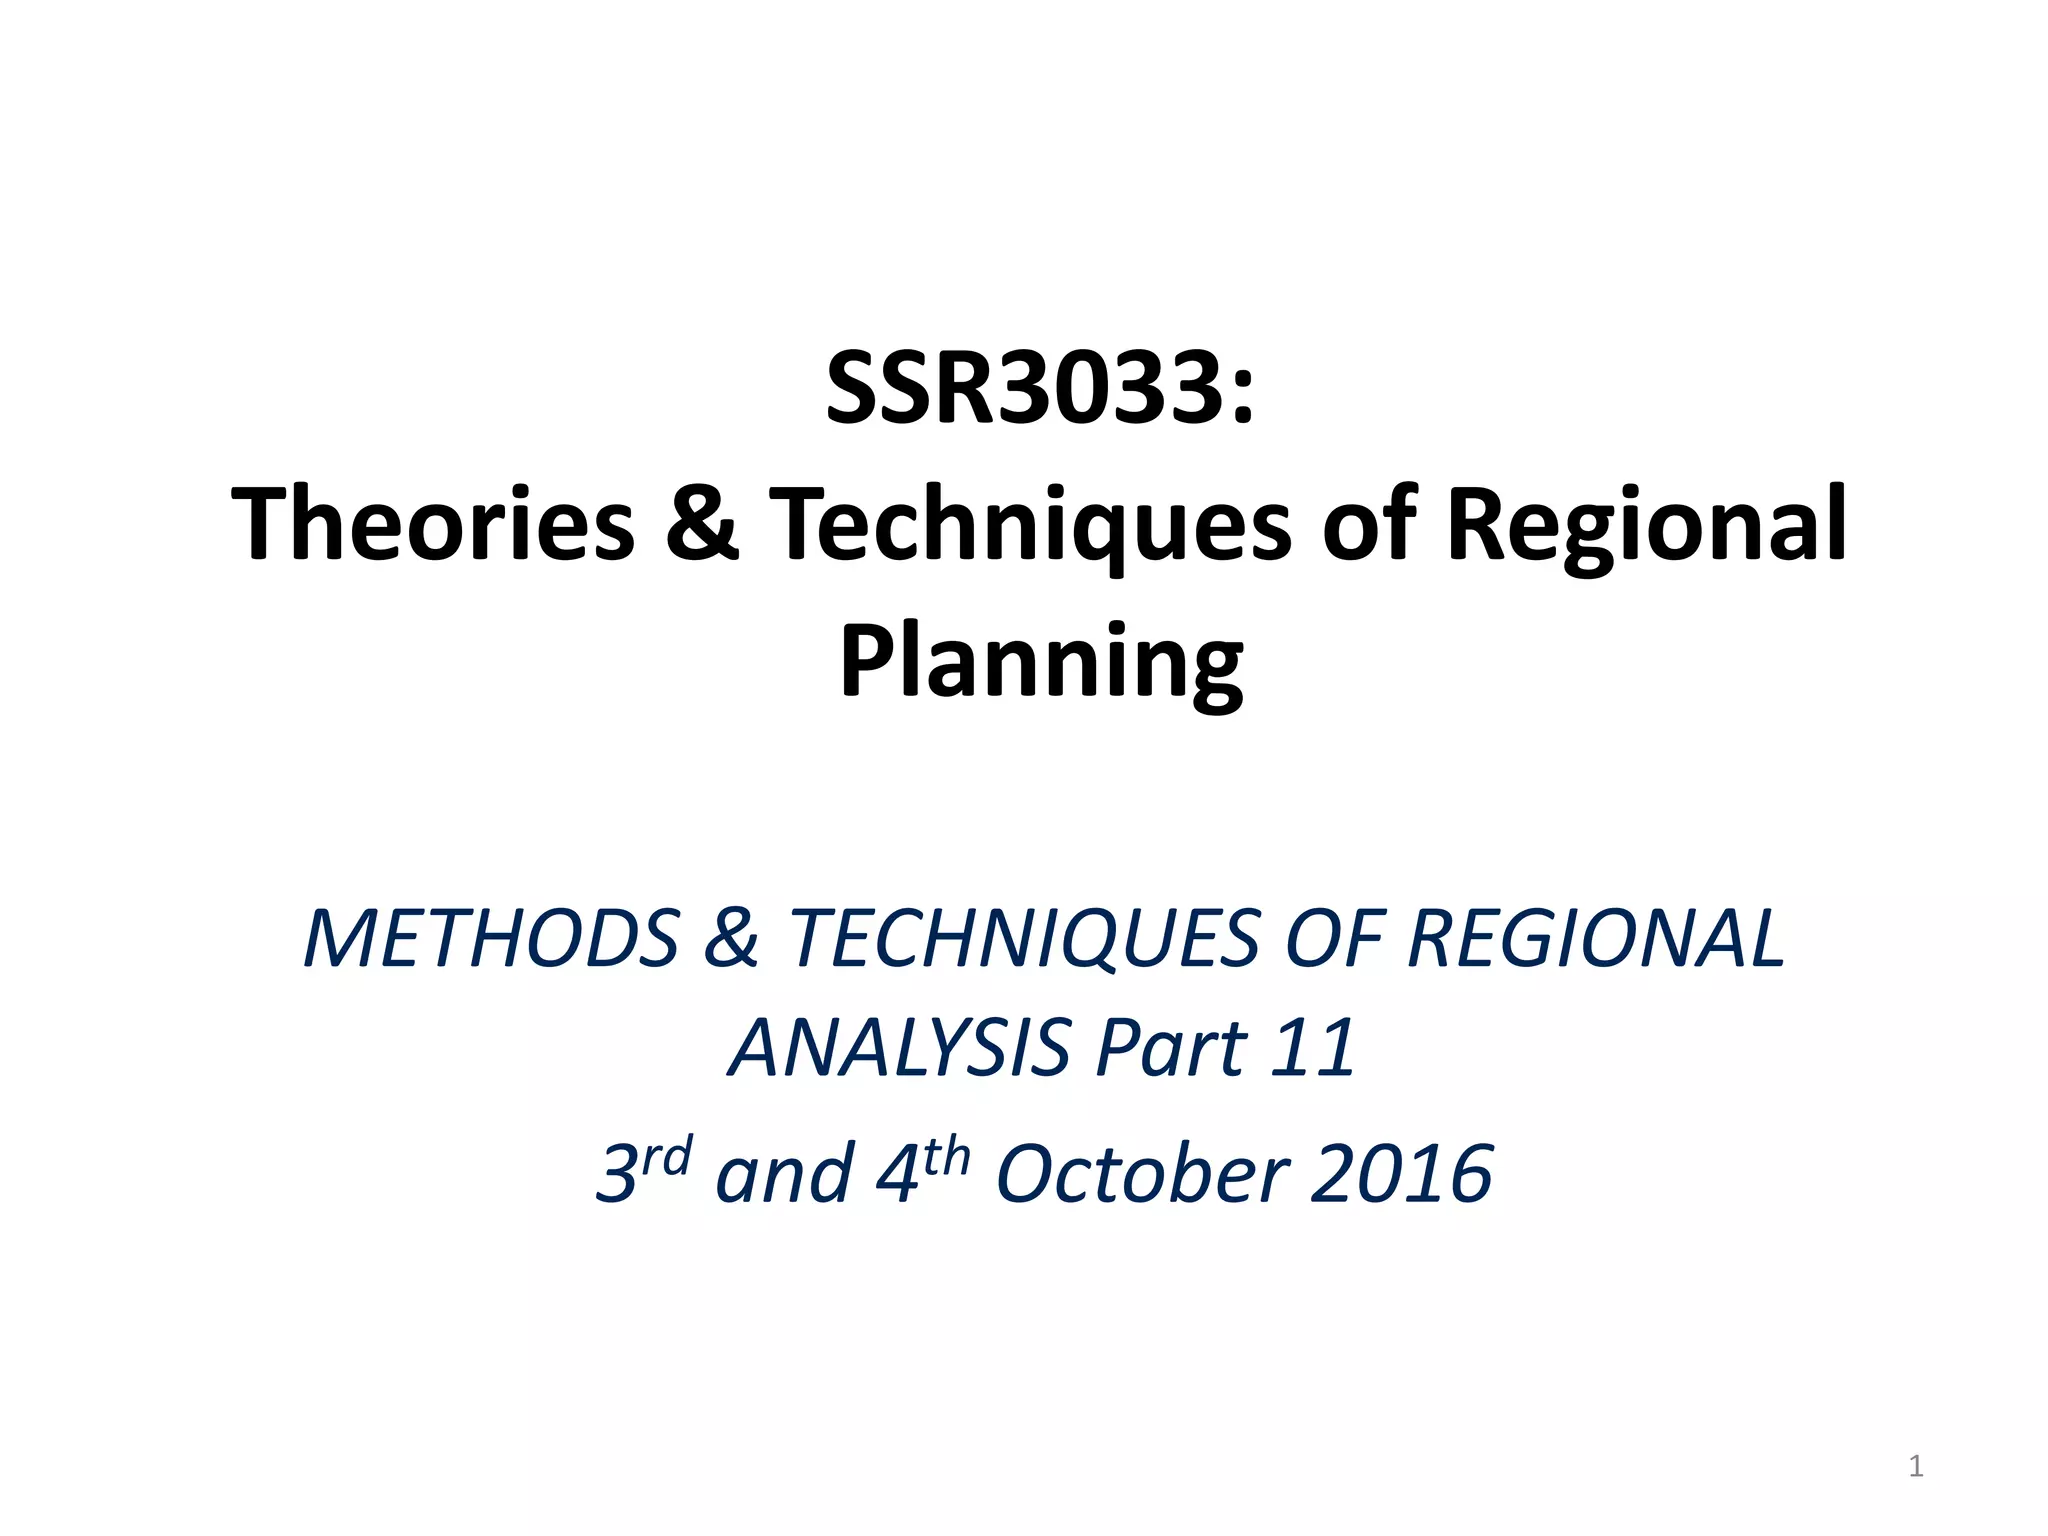
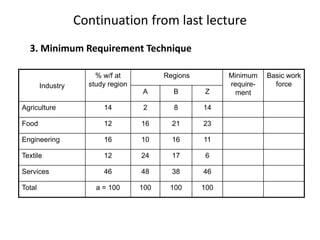
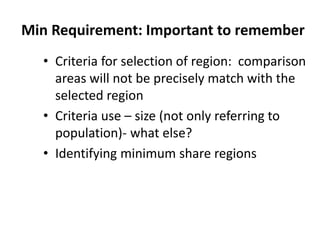
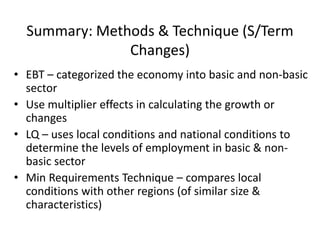
1. The minimum requirement technique, which compares a region's economic structure to other similar regions.
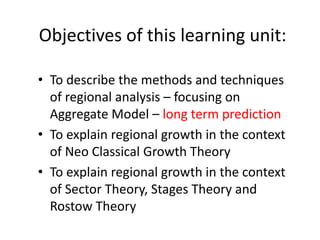
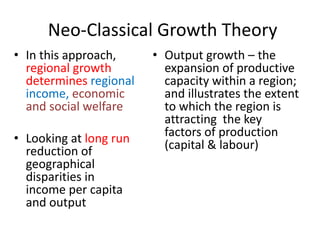
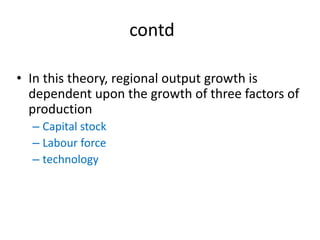
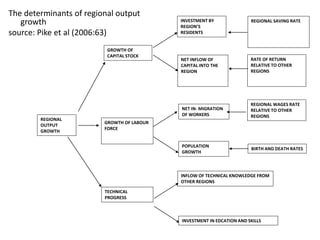
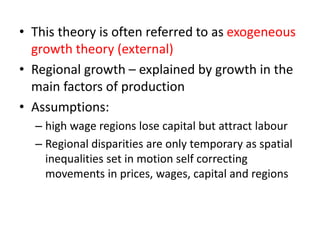
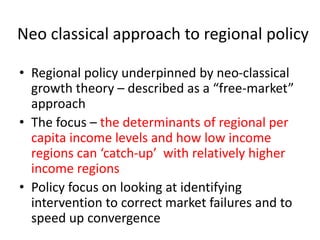
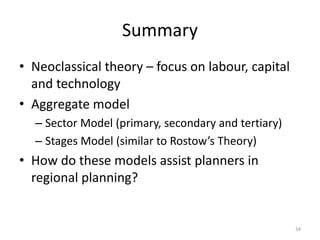
2. Neoclassical growth theory, which sees regional growth as dependent on growth in capital stock, labor force, and technology.
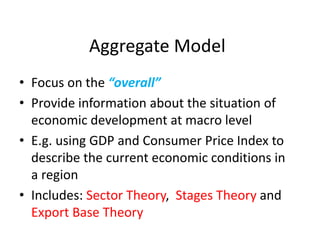
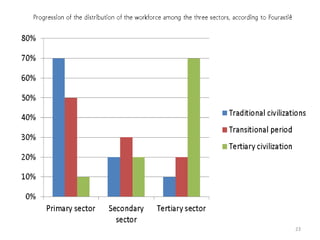
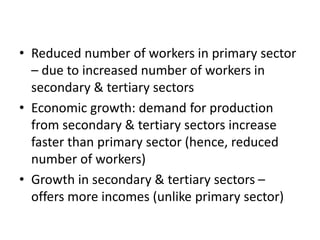
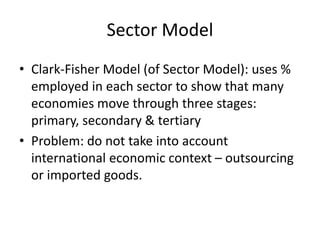
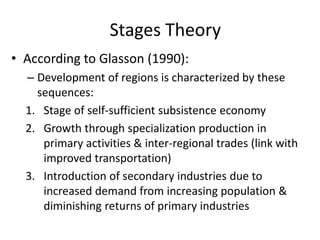
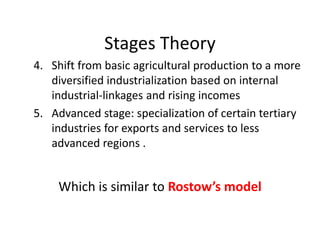
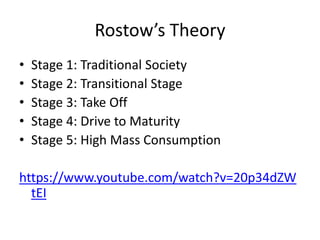
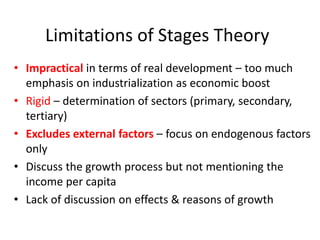
3. Aggregate models like sector theory and stages theory, which divide economies into primary, secondary, tertiary sectors and see regions developing through stages from subsistence to specialized industries.
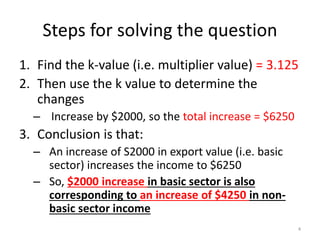
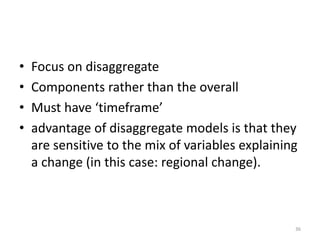
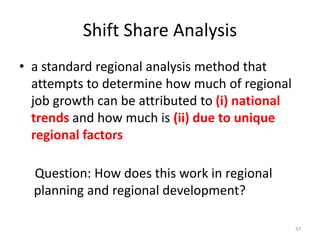
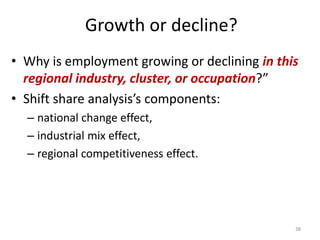
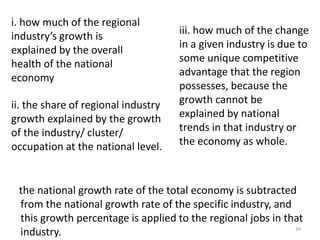
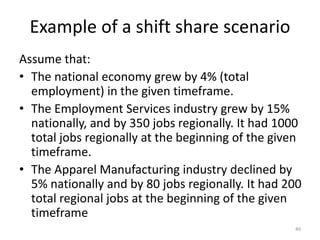
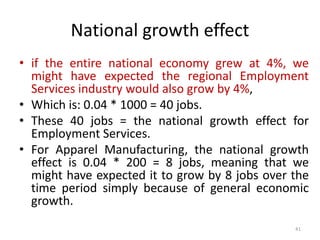
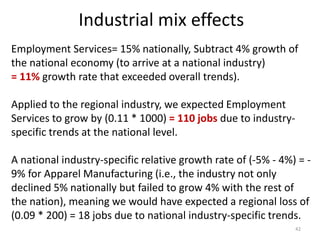
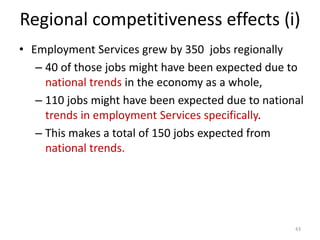
It also covers disaggregate models like shift-share analysis, which examine individual industries and attributes regional growth or decline to national trends and regional competitiveness factors. These techniques help planners understand regional economic changes.