Downloaded 110 times
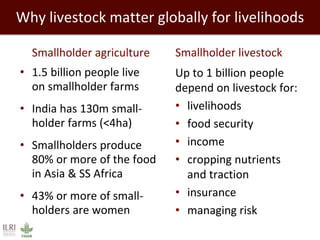


Smallholder farmers in India produce much of the country's livestock and dairy, contributing significantly to agricultural GDP and livelihoods. Rising global and domestic demand for livestock products presents opportunities but also risks. If met through imports or industrialization, it could harm the Indian economy, environment, and many livelihoods. However, transforming smallholder livestock systems sustainably could help millions improve production and livelihoods, maintaining India's economic growth. The conference aimed to discuss actions supporting smallholders to meet future demand for animal-source foods in an equitable and sustainable manner.