Downloaded 2,193 times


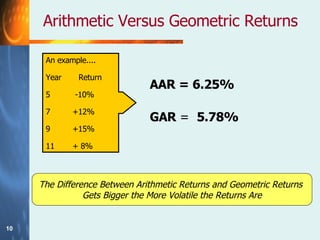
![Arithmetic Versus Geometric Returns Arithmetic return the simple average of annual returns: best estimate of expected return each year. Geometric average return the compound annual return to an investor who bought and held a stock t years: Geometric avg return= (1+R 1 )(1+R 2 )(1+R 3 )….(1+R t )] 1/t – 1 The Difference Between Arithmetic Returns and Geometric Returns Gets Bigger the More Volatile the Returns Are](https://image.slidesharecdn.com/risk-and-return-1208138814078124-8/85/Risk-And-Return-9-320.jpg)
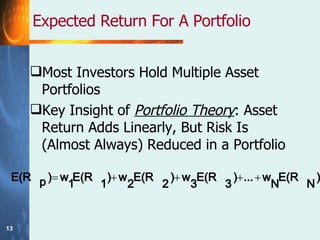
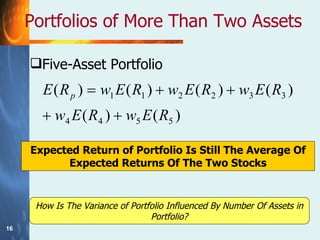
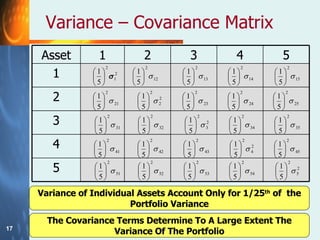
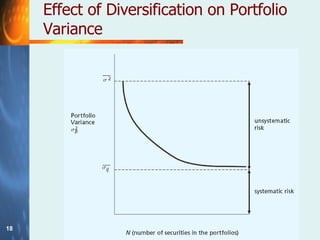
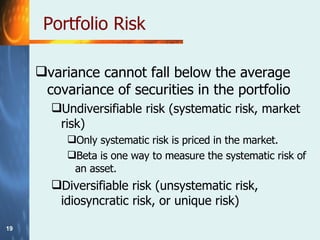
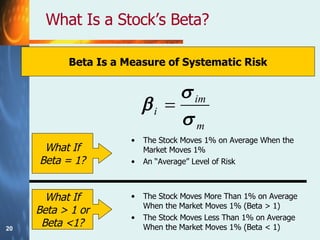
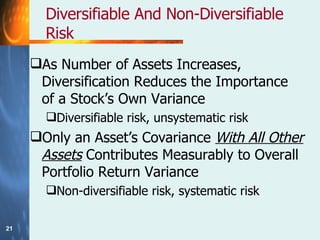
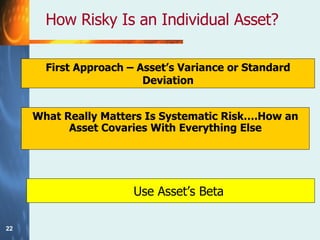
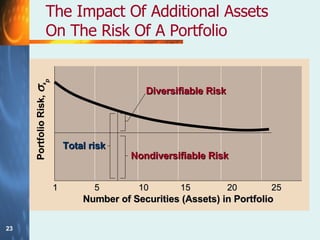

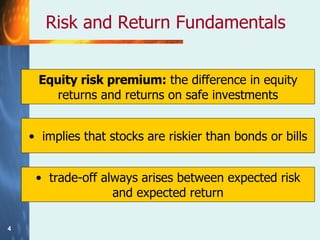
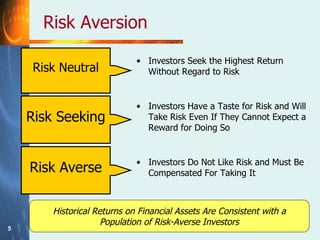
The document discusses the relationship between risk and return when investing. It states that there is a trade-off between expected risk and expected return, with higher risk investments typically offering higher returns to compensate investors for taking on more risk. It also discusses how diversification across multiple assets can reduce the non-systematic/diversifiable risk in a portfolio, but not the systematic/market risk that is related to movements in the overall market. The document defines beta as a measure of a stock's systematic risk relative to the market.