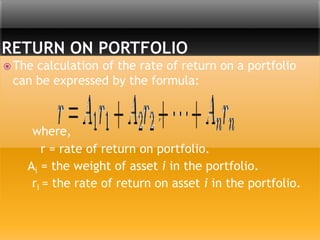
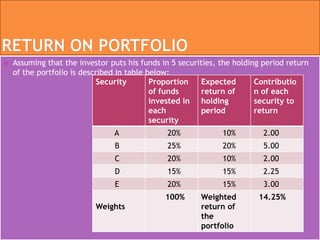
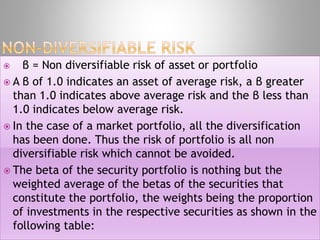
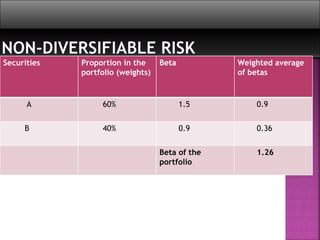
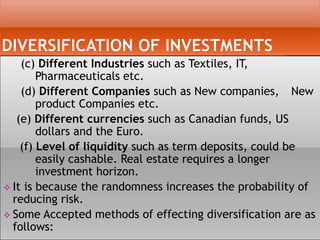
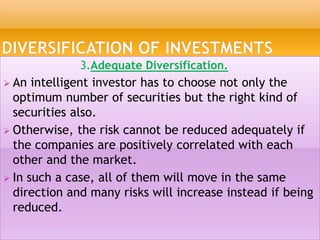
by,
VIVEK G KRISHNAN
 Deals with the analysis of securities within the
framework of return and risk.
 It is the analysis of tradable financial instruments
called securities i.e. Debt securities, equities, or
some hybrid of the two.
 More broadly, future contracts and the credit
derivatives are sometimes included.
 It is divided into:
1. Fundamental analysis: which relies upon the
examination of fundamental business factors such as
financial statements, current interest rates as well as
competitor’s products and financial market.
2. Technical Analysis: analysis of securities and helps
the finance professionals to forecast the price trends
through past price trends and market data.
 Portfolio analysis begins where security analysis ends.
 Portfolio refers to invest in a group of securities
rather to invest in a single security.
 “Don’t put all your eggs in one basket”.
 Portfolio analysis is the determination of the future
risk and return in holding various combinations of
individual securities.
 Portfolio analysis helps to make the investment
activity more rewarding and less risky.
 Portfolio analysis is broadly carried out for each asset at
two levels:
*Risk aversion: This method analyzes the portfolio
composition while considering the risk appetite of an
investor. Some investors may prefer to play safe and
accept low profits rather than invest in risky assets that
can generate high returns.
*Analyzing returns: While performing portfolio
analysis, prospective returns are calculated through the
average and compound return methods. An average return
is simply the arithmetic average of returns from individual
assets. However, compound return is the arithmetic mean
that considers the cumulative effect on overall returns.
 The concept of diversification goes side by side with
the portfolio analysis.
 Diversification aims at reduction and even elimination
of non systematic risk and achieving the specific
objective of the investors.
 An investor can even estimate his expected return
and expected risk level of a given portfolio of assets
from proper diversification.
TRADITIONAL PORTFOLIO ANALYSIS
 Traditional theory analysis the individual securities
under the constraint of risk and return.
 This theory assumes that the selection of securities
should be on the basis of lowest risk as measured by
its standard deviation from the mean of expected
returns.
 There exists a direct relationship between the
variability of returns and risk under this approach.
 The greater is the variability of returns, the greater is
the risk and the vice versa.
 Thus, the investor chooses assets with lowest
variability of returns.
 The method of finding the return on an individual
security is by finding out
* the amounts of dividend that have been
given by the company.
*the price earnings ratio.
* the common holding period, and
* the estimation of market value of shares.
MODERN PORTFOLIO ANALYSIS
 Modern Portfolio theory (MPT) a hypothesis put forth by
Harry Markowitz in his paper "Portfolio Selection,"
(published in 1952 by the Journal of Finance).
 It is an investment theory based on the idea that risk-
averse investors can construct portfolios to optimize or
maximize expected return based on a given level of
market risk, emphasizing that risk is an inherent part of
higher reward.
 The modern portfolio theory emphasis the need for
maximization of returns through a combination of
securities whose total variability is lower.
 It is not necessary that the success could be achieved by
trying to get all securities of minimum risk.
 By combining a security of low risk with another
security of high risk, success can be achieved by an
investor in making a choice of investments.
 As per the modern theory, expected returns, the
variance of these returns and covariance of the
returns of the securities within the portfolio are to be
considered for the choice of the portfolio.
 A portfolio is said to be efficient, if it is expected to
yield the highest return possible for the lower risk or
a given level of risk.
 The return on portfolio measures the rate of return
on a portfolio measured over a period of time.
 Each security in a portfolio contributes returns in the
proportion of its investment in security.
 The rate of return on a portfolio can be calculated by
Weighted Average Rate of return on the various assets
within the portfolio.
 This method is particularly useful for projecting into
the future the rate of return on a portfolio, given
projections of the rates of return on the constituents
of the portfolio.
 The calculation of the rate of return on a portfolio
can be expressed by the formula:
where,
r = rate of return on portfolio.
Ai = the weight of asset i in the portfolio.
ri = the rate of return on asset i in the portfolio.
 Assuming that the investor puts his funds in 5 securities, the holding period return
of the portfolio is described in table below:
Security Proportion
of funds
invested in
each
security
Expected
return of
holding
period
Contributio
n of each
security to
return
A 20% 10% 2.00
B 25% 20% 5.00
C 20% 10% 2.00
D 15% 15% 2.25
E 20% 15% 3.00
Weights
100% Weighted
return of
the
portfolio
14.25%
 The risk on a portfolio is not the same as risk on
individual securities.
 The risk on a portfolio is reflected in the
variability of returns from zero to infinity.
 The expected return from probability depends
on the probability and their weighted
contribution to the risk of the portfolio.
 The two measure of risk used in this context
are:
* The average or mean absolute deviation.
* The Standard deviation
Event
(1)
Probabilit
y (2)
Return
(%) (3)
Probabilit
y of
return
(4) =
(2)x(3)
Deviation
(5)
Probabilit
y of
deviation
(6) =
(2)x(5)
Probabilit
y of
absolute
Deviation
(7) = I6I
A .10 10 1.0 -5 -0.5 0.5
B .20 -10 -2.0 -25 -5.0 5.0
C .30 20 +6.0 5 1.5 1.5
D .40 25 +10.0 10 4.0 4.0
Expected
Return
15.00 Average
absolute
deviation
11.0
In the table,
 The expected return is determined. In this case it is 15%.
 Next, all possible outcomes are analysed to determine the
amount by which the value deviates from the expected
amount.
 Column 5 – shows both positive and negative values.
 Column 6 – weighted average using probabilities as
weights equal to 0.
 Column 7 – to assess the risk, the signs of deviations can
be ignored which shows the weighted average of absolute
deviations using the probabilities as weights, equal to
11%.
Event
(1)
Probability
(2)
Deviation
(3)
Deviation
square
(4) = (3)2
Probability of
squared
deviation
(5) = (2)x(4)
A .10 -5 25 2.5
B .20 -25 625 125.0
C .30 5 25 7.5
D .40 10 100 40.0
E Variation 175.0
Standard
deviation
13.2287
 It is slightly more complex but preferable.
 In this the deviations are squared, making all values
positive.
 Then the weighted average of these amounts is
taken, using the probabilities as weights.
 The result is termed as variance.
 It is converted into original units by taking the square
root. This result is termed as standard deviation.
 If an investor holds only one stock, there is no
question of diversification and his risk is therefore the
standard deviation of the stock.
 For a diversified investor, the risk of the stock is only
that portion of the total risk that cannot be
diversified away or its non diversifiable risk.
 The non diversifiable risk is generally measured by
Beta (β) coefficient.
 β measure the relative risk associated with any
individual portfolio as measured in relation to the risk
of the market portfolio
 β = Non diversifiable risk of asset or portfolio
 A β of 1.0 indicates an asset of average risk, a β greater
than 1.0 indicates above average risk and the β less than
1.0 indicates below average risk.
 In the case of a market portfolio, all the diversification
has been done. Thus the risk of portfolio is all non
diversifiable risk which cannot be avoided.
 The beta of the security portfolio is nothing but the
weighted average of the betas of the securities that
constitute the portfolio, the weights being the proportion
of investments in the respective securities as shown in the
following table:
Securities Proportion in the
portfolio (weights)
Beta Weighted average
of betas
A 60% 1.5 0.9
B 40% 0.9 0.36
Beta of the
portfolio
1.26
“Don’t put all eggs in one basket”
 Diversification is the most basic yet important tool in an
intelligent investors hand. If used correctly along with asset
allocation, it can be a powerful tool to flaunt and one of the
best ways to achieve safe returns on your investment
portfolio.
 Diversification can be defined as “A risk management
technique that mixes a wide variety of investments within a
portfolio”.
 Diversification helps in the reduction of unsystematic risks and
promotes the optimisation or maximisation of returns.
 Diversification may take any of the following forms:
(a) Different Assets: Eg- Gold, Bullion, real estate,
Government securities etc.
(b) Different instruments such as shares, debentures, Bonds
etc.
(c) Different Industries such as Textiles, IT,
Pharmaceuticals etc.
(d) Different Companies such as New companies, New
product Companies etc.
(e) Different currencies such as Canadian funds, US
dollars and the Euro.
(f) Level of liquidity such as term deposits, could be
easily cashable. Real estate requires a longer
investment horizon.
 It is because the randomness increases the probability of
reducing risk.
 Some Accepted methods of effecting diversification are as
follows:
1. Random Diversification
 Randomness is a statistical technique which involves
placing of companies in any order and picking them
up in random manner.
 reduces the probability of choosing wrong companies.
 Probability of reducing risk will be more.
 Some experts suggested that random diversification
does not bring the expected return results.
2. Optimum Number of companies.
 Investor to find out the optimum number of
companies in which to invest the money.
 If the number of companies is too small, risk cannot
be reduced adequately.
 If the number of companies is too large, there will be
diseconomies of scale.
3.Adequate Diversification.
 An intelligent investor has to choose not only the
optimum number of securities but the right kind of
securities also.
 Otherwise, the risk cannot be reduced adequately if
the companies are positively correlated with each
other and the market.
 In such a case, all of them will move in the same
direction and many risks will increase instead if being
reduced.
4. Markowitz Diversification.
 A strategy that seeks to combine assets a portfolio
with returns that are less than perfectly positively
correlated, in an effort to lower portfolio risk
(variance) without sacrificing return.
 An approach taken in order to reduce portfolio risk
that involves the use of assets that have returns that
are not positively correlated.
 According to this theory, the effects of one security
purchase over the effects of the other security
purchase is taken into consideration and then the
results are evaluated.
Portfolio analysis

Portfolio analysis

  • 1.
  • 2.
     Deals withthe analysis of securities within the framework of return and risk.  It is the analysis of tradable financial instruments called securities i.e. Debt securities, equities, or some hybrid of the two.  More broadly, future contracts and the credit derivatives are sometimes included.  It is divided into: 1. Fundamental analysis: which relies upon the examination of fundamental business factors such as financial statements, current interest rates as well as competitor’s products and financial market.
  • 3.
    2. Technical Analysis:analysis of securities and helps the finance professionals to forecast the price trends through past price trends and market data.
  • 4.
     Portfolio analysisbegins where security analysis ends.  Portfolio refers to invest in a group of securities rather to invest in a single security.  “Don’t put all your eggs in one basket”.  Portfolio analysis is the determination of the future risk and return in holding various combinations of individual securities.  Portfolio analysis helps to make the investment activity more rewarding and less risky.
  • 5.
     Portfolio analysisis broadly carried out for each asset at two levels: *Risk aversion: This method analyzes the portfolio composition while considering the risk appetite of an investor. Some investors may prefer to play safe and accept low profits rather than invest in risky assets that can generate high returns. *Analyzing returns: While performing portfolio analysis, prospective returns are calculated through the average and compound return methods. An average return is simply the arithmetic average of returns from individual assets. However, compound return is the arithmetic mean that considers the cumulative effect on overall returns.
  • 6.
     The conceptof diversification goes side by side with the portfolio analysis.  Diversification aims at reduction and even elimination of non systematic risk and achieving the specific objective of the investors.  An investor can even estimate his expected return and expected risk level of a given portfolio of assets from proper diversification.
  • 7.
    TRADITIONAL PORTFOLIO ANALYSIS Traditional theory analysis the individual securities under the constraint of risk and return.  This theory assumes that the selection of securities should be on the basis of lowest risk as measured by its standard deviation from the mean of expected returns.  There exists a direct relationship between the variability of returns and risk under this approach.  The greater is the variability of returns, the greater is the risk and the vice versa.
  • 8.
     Thus, theinvestor chooses assets with lowest variability of returns.  The method of finding the return on an individual security is by finding out * the amounts of dividend that have been given by the company. *the price earnings ratio. * the common holding period, and * the estimation of market value of shares.
  • 9.
    MODERN PORTFOLIO ANALYSIS Modern Portfolio theory (MPT) a hypothesis put forth by Harry Markowitz in his paper "Portfolio Selection," (published in 1952 by the Journal of Finance).  It is an investment theory based on the idea that risk- averse investors can construct portfolios to optimize or maximize expected return based on a given level of market risk, emphasizing that risk is an inherent part of higher reward.  The modern portfolio theory emphasis the need for maximization of returns through a combination of securities whose total variability is lower.  It is not necessary that the success could be achieved by trying to get all securities of minimum risk.
  • 10.
     By combininga security of low risk with another security of high risk, success can be achieved by an investor in making a choice of investments.  As per the modern theory, expected returns, the variance of these returns and covariance of the returns of the securities within the portfolio are to be considered for the choice of the portfolio.  A portfolio is said to be efficient, if it is expected to yield the highest return possible for the lower risk or a given level of risk.
  • 11.
     The returnon portfolio measures the rate of return on a portfolio measured over a period of time.  Each security in a portfolio contributes returns in the proportion of its investment in security.  The rate of return on a portfolio can be calculated by Weighted Average Rate of return on the various assets within the portfolio.  This method is particularly useful for projecting into the future the rate of return on a portfolio, given projections of the rates of return on the constituents of the portfolio.
  • 12.
     The calculationof the rate of return on a portfolio can be expressed by the formula: where, r = rate of return on portfolio. Ai = the weight of asset i in the portfolio. ri = the rate of return on asset i in the portfolio.
  • 13.
     Assuming thatthe investor puts his funds in 5 securities, the holding period return of the portfolio is described in table below: Security Proportion of funds invested in each security Expected return of holding period Contributio n of each security to return A 20% 10% 2.00 B 25% 20% 5.00 C 20% 10% 2.00 D 15% 15% 2.25 E 20% 15% 3.00 Weights 100% Weighted return of the portfolio 14.25%
  • 14.
     The riskon a portfolio is not the same as risk on individual securities.  The risk on a portfolio is reflected in the variability of returns from zero to infinity.  The expected return from probability depends on the probability and their weighted contribution to the risk of the portfolio.  The two measure of risk used in this context are: * The average or mean absolute deviation. * The Standard deviation
  • 15.
    Event (1) Probabilit y (2) Return (%) (3) Probabilit yof return (4) = (2)x(3) Deviation (5) Probabilit y of deviation (6) = (2)x(5) Probabilit y of absolute Deviation (7) = I6I A .10 10 1.0 -5 -0.5 0.5 B .20 -10 -2.0 -25 -5.0 5.0 C .30 20 +6.0 5 1.5 1.5 D .40 25 +10.0 10 4.0 4.0 Expected Return 15.00 Average absolute deviation 11.0
  • 16.
    In the table, The expected return is determined. In this case it is 15%.  Next, all possible outcomes are analysed to determine the amount by which the value deviates from the expected amount.  Column 5 – shows both positive and negative values.  Column 6 – weighted average using probabilities as weights equal to 0.  Column 7 – to assess the risk, the signs of deviations can be ignored which shows the weighted average of absolute deviations using the probabilities as weights, equal to 11%.
  • 17.
    Event (1) Probability (2) Deviation (3) Deviation square (4) = (3)2 Probabilityof squared deviation (5) = (2)x(4) A .10 -5 25 2.5 B .20 -25 625 125.0 C .30 5 25 7.5 D .40 10 100 40.0 E Variation 175.0 Standard deviation 13.2287
  • 18.
     It isslightly more complex but preferable.  In this the deviations are squared, making all values positive.  Then the weighted average of these amounts is taken, using the probabilities as weights.  The result is termed as variance.  It is converted into original units by taking the square root. This result is termed as standard deviation.
  • 19.
     If aninvestor holds only one stock, there is no question of diversification and his risk is therefore the standard deviation of the stock.  For a diversified investor, the risk of the stock is only that portion of the total risk that cannot be diversified away or its non diversifiable risk.  The non diversifiable risk is generally measured by Beta (β) coefficient.  β measure the relative risk associated with any individual portfolio as measured in relation to the risk of the market portfolio
  • 20.
     β =Non diversifiable risk of asset or portfolio  A β of 1.0 indicates an asset of average risk, a β greater than 1.0 indicates above average risk and the β less than 1.0 indicates below average risk.  In the case of a market portfolio, all the diversification has been done. Thus the risk of portfolio is all non diversifiable risk which cannot be avoided.  The beta of the security portfolio is nothing but the weighted average of the betas of the securities that constitute the portfolio, the weights being the proportion of investments in the respective securities as shown in the following table:
  • 21.
    Securities Proportion inthe portfolio (weights) Beta Weighted average of betas A 60% 1.5 0.9 B 40% 0.9 0.36 Beta of the portfolio 1.26
  • 22.
    “Don’t put alleggs in one basket”  Diversification is the most basic yet important tool in an intelligent investors hand. If used correctly along with asset allocation, it can be a powerful tool to flaunt and one of the best ways to achieve safe returns on your investment portfolio.  Diversification can be defined as “A risk management technique that mixes a wide variety of investments within a portfolio”.  Diversification helps in the reduction of unsystematic risks and promotes the optimisation or maximisation of returns.  Diversification may take any of the following forms: (a) Different Assets: Eg- Gold, Bullion, real estate, Government securities etc. (b) Different instruments such as shares, debentures, Bonds etc.
  • 23.
    (c) Different Industriessuch as Textiles, IT, Pharmaceuticals etc. (d) Different Companies such as New companies, New product Companies etc. (e) Different currencies such as Canadian funds, US dollars and the Euro. (f) Level of liquidity such as term deposits, could be easily cashable. Real estate requires a longer investment horizon.  It is because the randomness increases the probability of reducing risk.  Some Accepted methods of effecting diversification are as follows:
  • 24.
    1. Random Diversification Randomness is a statistical technique which involves placing of companies in any order and picking them up in random manner.  reduces the probability of choosing wrong companies.  Probability of reducing risk will be more.  Some experts suggested that random diversification does not bring the expected return results.
  • 25.
    2. Optimum Numberof companies.  Investor to find out the optimum number of companies in which to invest the money.  If the number of companies is too small, risk cannot be reduced adequately.  If the number of companies is too large, there will be diseconomies of scale.
  • 26.
    3.Adequate Diversification.  Anintelligent investor has to choose not only the optimum number of securities but the right kind of securities also.  Otherwise, the risk cannot be reduced adequately if the companies are positively correlated with each other and the market.  In such a case, all of them will move in the same direction and many risks will increase instead if being reduced.
  • 27.
    4. Markowitz Diversification. A strategy that seeks to combine assets a portfolio with returns that are less than perfectly positively correlated, in an effort to lower portfolio risk (variance) without sacrificing return.  An approach taken in order to reduce portfolio risk that involves the use of assets that have returns that are not positively correlated.  According to this theory, the effects of one security purchase over the effects of the other security purchase is taken into consideration and then the results are evaluated.