Downloaded 227 times


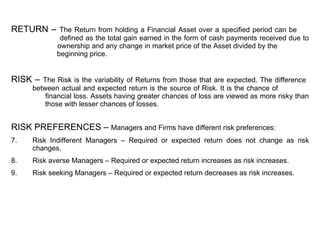
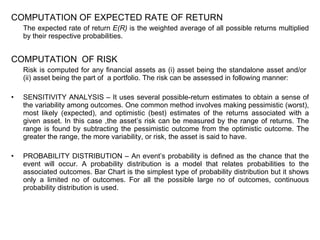
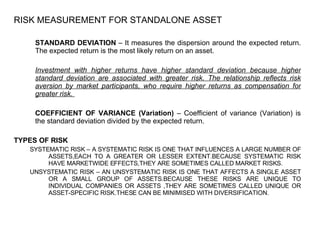
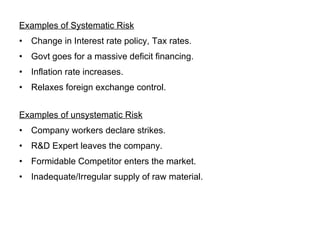

The document discusses risk and return related to financial assets. It defines return as the total gain from an asset including price changes and cash payments. Risk is the variability between actual and expected returns, with greater chances of loss seen as riskier. Managers have different risk preferences such as being risk indifferent, risk averse, or risk seeking. Risk is computed using methods like standard deviation, which measures dispersion around the expected return. There are systematic risks that influence many assets, like interest rates, and unsystematic risks that are specific to individual assets. Diversification reduces unsystematic risk. The capital asset pricing model relates risk premium to an asset's beta, or systematic risk relative to the market.


![Topic 4[1] finance](https://cdn.slidesharecdn.com/ss_thumbnails/topic41-131107182635-phpapp02-thumbnail.jpg?width=640&height=640&fit=bounds)


