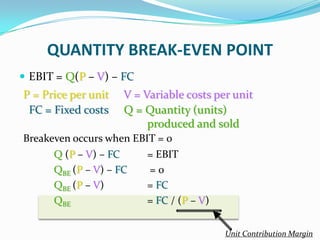
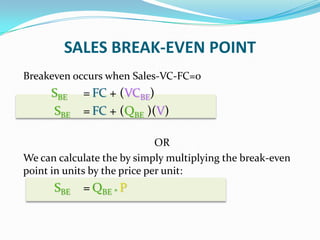
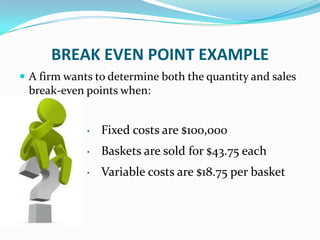
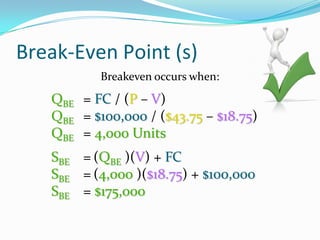
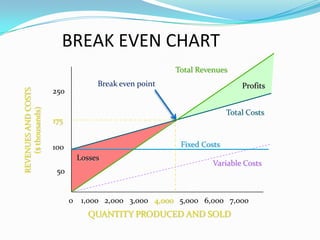
LEVERAGE
 General term for any technique to multiply gains and
losses.
 Is used to explain a firm’s ability to use fixed assets or
funds to magnify the return to its owners.
 Common ways to attain leverage are borrowing
money, buying fixed assets, and using derivatives.
 E.g. A public corporation may leverage its equity by
borrowing money. The more it borrows, the less equity
capital it needs, so any profits or losses are shared
among a smaller base and are proportionately larger.
TYPES OF LEVERAGE
 Accounting Leverage is total assets divided by total
liabilities.
 Notional Leverage is total notional amount of assets
plus total notional amount of liabilities divided by
equity.
 Economic Leverage is volatility of equity divided by
volatility of an unlevered investment in the same
assets.
E.g. If we buy $100 of crude oil with money out of
pocket. Assets are $100 ($100 of oil), there are no
liabilities, and assets minus liabilities equals owners'
equity.
 Accounting leverage is 1 to 1.
 The notional amount is $100 ($100 of oil), there are no
liabilities, and there is $100 of equity, so notional
leverage is 1 to 1.
 The volatility of the equity is equal to the volatility of
oil, since oil is the only asset and you own the same
amount as your equity, so economic leverage is 1 to 1.
OPERATING LEVERAGE
 Is defined as the impact of a
change in the revenue on profit
or cash flow and arises whenever
a firm can increase its revenues
without a proportionate increase
in its operating expenses.
 Based on the relationship
between a firm’s sales revenue
and its earnings before interest
and taxes.
DEGREE OF OPERATING LEVERAGE
 Measures the sensitivity of a firm’s operating income
to a change in sales.
 The degree of operating leverage is directly
proportional to a firm’s level of business risk, and
therefore it serves as a proxy for business risk.
 It is sales revenue less total variable cost divided by
sales revenue less total cost.
 DOL = % change in EBIT
% change in sales
= q (p-v)
(q(p-v)–f)
= (Sales-VC)
EBIT
q – quantity p – price per unit
v – variable cost per unit
f – total fixed cost
VC – variable costs
EBIT – earning before interest and tax
FINANCIAL LEVERAGE
 Reflects the debt amount used in
the capital structure of a firm.
 It is an impact on returns of a
change in the extent to which the
firm’s assets are financed with
borrowed money. Other things
remaining same, lower the amount
borrowed, lower the interest, lower
will be the profit, whereas greater
the amount borrowed, lower the
interest, greater will be the profit.
DEGREE OF FINANCIAL LEVERAGE
 Measures firm’s exposure to the financial risk.
 DFL can be defined as the percentage change in
earnings per share (EPS) that results from a given
percentage change in earnings before interest and tax.
 Measures the sensitivity of a firm’s EPS to a change in
its operating income.
 DFL = % change in EPS
% change in EBIT
= EBIT
(EBIT – I)
I – sum of all “before tax” fixed finance costs including
interest on debts , grossed up preference share
dividends
TOTAL / COMBINED LEVERAGE
 Represents maximum use of leverage.
 The product of two leverages “operating and financial”
is called the total leverage and estimates the
percentage change in the income with a change in the
revenue.
DEGREE OF TOTAL LEVERAGE
 DTL = DOL * DFL = % change in EPS
% change in sales
= q (p-v)
(q(p-v)–f – I )
By using combined leverage a small change in sales is
magnified into a larger change in earnings per share.
RISK AND ITS TYPES
 Risk is the potential that a chosen action or activity
(including the choice of inaction) will lead to a loss (an
undesirable outcome).
 General risk
 Unique risk
 Market risk
 Firm specific risk
 Technology risk
 Unsystematic risk
 Systematic risk
 Country risk
 Default risk
 Exchange rate risk
 Liquidity risk
 Political risk
 BUSINESS RISK
The variability or uncertainty of a firm’s
operating income.
EBIT  FIRM  EPS  SHAREHOLDERS
Affected by:
 Competition
 Sales volume variability
 Cost variability
 Operating leverage
 Product demand
 Product diversification
 FINANCIAL RISK
The variability of a firm’s earnings per
share and the increased probability of insolvency when
a firm uses financial leverage.
EBIT  FIRM  EPS  SHAREHOLDERS
LEVERAGE - IMPLICATIONS
 Leverage is a double-edged
sword
 The most obvious risk of
leverage is that it magnifies
profits as well as losses.
 A corporation that borrows
too much money might face
bankruptcy or default during a
business downturn, while a
less-levered corporation might
survive.
 An aggressive or highly leveraged firm has high fixed
costs (and a relatively high break-even point)
 A conservative or non-leveraged firm has low fixed
costs (and a relatively low break-even point)
 Can produce beneficial results in favorable
conditions
 Can produce highly negative results in unfavorable
conditions
BREAK-EVEN ANALYSIS
 A technique for studying the relationship among fixed
costs, variable costs, sales volume, and profits. Also
called cost/volume/profit analysis (C/V/P) analysis.
 Break-Even Point – The sales volume required so that
total revenues and total costs are equal
QUANTITY PRODUCED AND SOLD
Total Revenues
Profits
Fixed Costs
Variable Costs
Losses
REVENUESANDCOSTS
($thousands)
Total Costs
Break-Even Chart
QUANTITY BREAK-EVEN POINT
 EBIT = Q(P – V) – FC
P = Price per unit V = Variable costs per unit
FC = Fixed costs Q = Quantity (units)
produced and sold
Breakeven occurs when EBIT = 0
Q (P – V) – FC = EBIT
QBE (P – V) – FC = 0
QBE (P – V) = FC
QBE = FC / (P – V)
Unit Contribution Margin
SALES BREAK-EVEN POINT
Breakeven occurs when Sales-VC-FC=0
SBE = FC + (VCBE)
SBE = FC + (QBE )(V)
OR
We can calculate the by simply multiplying the break-even
point in units by the price per unit:
SBE = QBE * P
BREAK EVEN POINT EXAMPLE
 A firm wants to determine both the quantity and sales
break-even points when:
• Fixed costs are $100,000
• Baskets are sold for $43.75 each
• Variable costs are $18.75 per basket
Break-Even Point (s)
Breakeven occurs when:
QBE = FC / (P – V)
QBE = $100,000 / ($43.75 – $18.75)
QBE = 4,000 Units
SBE = (QBE )(V) + FC
SBE = (4,000 )($18.75) + $100,000
SBE = $175,000
QUANTITY PRODUCED AND SOLD
0 1,000 2,000 3,000 4,000 5,000 6,000 7,000
Total Revenues
Profits
Fixed Costs
Variable Costs
Losses
REVENUESANDCOSTS
($thousands)
175
250
100
50
Total Costs
BREAK EVEN CHART
Break even point

Leverage

  • 2.
    LEVERAGE  General termfor any technique to multiply gains and losses.  Is used to explain a firm’s ability to use fixed assets or funds to magnify the return to its owners.
  • 3.
     Common waysto attain leverage are borrowing money, buying fixed assets, and using derivatives.  E.g. A public corporation may leverage its equity by borrowing money. The more it borrows, the less equity capital it needs, so any profits or losses are shared among a smaller base and are proportionately larger.
  • 4.
    TYPES OF LEVERAGE Accounting Leverage is total assets divided by total liabilities.  Notional Leverage is total notional amount of assets plus total notional amount of liabilities divided by equity.  Economic Leverage is volatility of equity divided by volatility of an unlevered investment in the same assets.
  • 5.
    E.g. If webuy $100 of crude oil with money out of pocket. Assets are $100 ($100 of oil), there are no liabilities, and assets minus liabilities equals owners' equity.  Accounting leverage is 1 to 1.  The notional amount is $100 ($100 of oil), there are no liabilities, and there is $100 of equity, so notional leverage is 1 to 1.  The volatility of the equity is equal to the volatility of oil, since oil is the only asset and you own the same amount as your equity, so economic leverage is 1 to 1.
  • 6.
    OPERATING LEVERAGE  Isdefined as the impact of a change in the revenue on profit or cash flow and arises whenever a firm can increase its revenues without a proportionate increase in its operating expenses.  Based on the relationship between a firm’s sales revenue and its earnings before interest and taxes.
  • 7.
    DEGREE OF OPERATINGLEVERAGE  Measures the sensitivity of a firm’s operating income to a change in sales.  The degree of operating leverage is directly proportional to a firm’s level of business risk, and therefore it serves as a proxy for business risk.  It is sales revenue less total variable cost divided by sales revenue less total cost.
  • 8.
     DOL =% change in EBIT % change in sales = q (p-v) (q(p-v)–f) = (Sales-VC) EBIT q – quantity p – price per unit v – variable cost per unit f – total fixed cost VC – variable costs EBIT – earning before interest and tax
  • 9.
    FINANCIAL LEVERAGE  Reflectsthe debt amount used in the capital structure of a firm.  It is an impact on returns of a change in the extent to which the firm’s assets are financed with borrowed money. Other things remaining same, lower the amount borrowed, lower the interest, lower will be the profit, whereas greater the amount borrowed, lower the interest, greater will be the profit.
  • 10.
    DEGREE OF FINANCIALLEVERAGE  Measures firm’s exposure to the financial risk.  DFL can be defined as the percentage change in earnings per share (EPS) that results from a given percentage change in earnings before interest and tax.  Measures the sensitivity of a firm’s EPS to a change in its operating income.
  • 11.
     DFL =% change in EPS % change in EBIT = EBIT (EBIT – I) I – sum of all “before tax” fixed finance costs including interest on debts , grossed up preference share dividends
  • 12.
    TOTAL / COMBINEDLEVERAGE  Represents maximum use of leverage.  The product of two leverages “operating and financial” is called the total leverage and estimates the percentage change in the income with a change in the revenue.
  • 13.
    DEGREE OF TOTALLEVERAGE  DTL = DOL * DFL = % change in EPS % change in sales = q (p-v) (q(p-v)–f – I ) By using combined leverage a small change in sales is magnified into a larger change in earnings per share.
  • 14.
    RISK AND ITSTYPES  Risk is the potential that a chosen action or activity (including the choice of inaction) will lead to a loss (an undesirable outcome).  General risk  Unique risk  Market risk  Firm specific risk  Technology risk
  • 15.
     Unsystematic risk Systematic risk  Country risk  Default risk  Exchange rate risk  Liquidity risk  Political risk
  • 16.
     BUSINESS RISK Thevariability or uncertainty of a firm’s operating income. EBIT  FIRM  EPS  SHAREHOLDERS Affected by:  Competition  Sales volume variability  Cost variability  Operating leverage  Product demand  Product diversification
  • 17.
     FINANCIAL RISK Thevariability of a firm’s earnings per share and the increased probability of insolvency when a firm uses financial leverage. EBIT  FIRM  EPS  SHAREHOLDERS
  • 18.
    LEVERAGE - IMPLICATIONS Leverage is a double-edged sword  The most obvious risk of leverage is that it magnifies profits as well as losses.  A corporation that borrows too much money might face bankruptcy or default during a business downturn, while a less-levered corporation might survive.
  • 19.
     An aggressiveor highly leveraged firm has high fixed costs (and a relatively high break-even point)  A conservative or non-leveraged firm has low fixed costs (and a relatively low break-even point)  Can produce beneficial results in favorable conditions  Can produce highly negative results in unfavorable conditions
  • 20.
    BREAK-EVEN ANALYSIS  Atechnique for studying the relationship among fixed costs, variable costs, sales volume, and profits. Also called cost/volume/profit analysis (C/V/P) analysis.  Break-Even Point – The sales volume required so that total revenues and total costs are equal
  • 21.
    QUANTITY PRODUCED ANDSOLD Total Revenues Profits Fixed Costs Variable Costs Losses REVENUESANDCOSTS ($thousands) Total Costs Break-Even Chart
  • 22.
    QUANTITY BREAK-EVEN POINT EBIT = Q(P – V) – FC P = Price per unit V = Variable costs per unit FC = Fixed costs Q = Quantity (units) produced and sold Breakeven occurs when EBIT = 0 Q (P – V) – FC = EBIT QBE (P – V) – FC = 0 QBE (P – V) = FC QBE = FC / (P – V) Unit Contribution Margin
  • 23.
    SALES BREAK-EVEN POINT Breakevenoccurs when Sales-VC-FC=0 SBE = FC + (VCBE) SBE = FC + (QBE )(V) OR We can calculate the by simply multiplying the break-even point in units by the price per unit: SBE = QBE * P
  • 24.
    BREAK EVEN POINTEXAMPLE  A firm wants to determine both the quantity and sales break-even points when: • Fixed costs are $100,000 • Baskets are sold for $43.75 each • Variable costs are $18.75 per basket
  • 25.
    Break-Even Point (s) Breakevenoccurs when: QBE = FC / (P – V) QBE = $100,000 / ($43.75 – $18.75) QBE = 4,000 Units SBE = (QBE )(V) + FC SBE = (4,000 )($18.75) + $100,000 SBE = $175,000
  • 26.
    QUANTITY PRODUCED ANDSOLD 0 1,000 2,000 3,000 4,000 5,000 6,000 7,000 Total Revenues Profits Fixed Costs Variable Costs Losses REVENUESANDCOSTS ($thousands) 175 250 100 50 Total Costs BREAK EVEN CHART Break even point