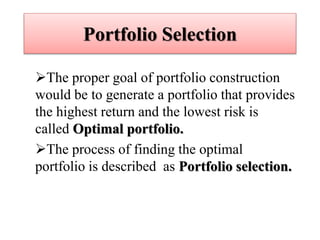
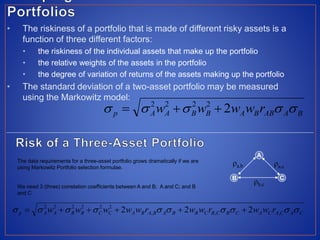
1. The document discusses portfolio selection using the Markowitz model.
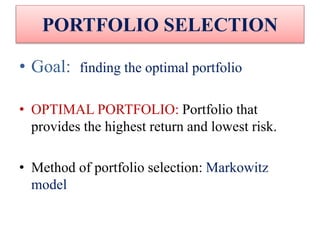
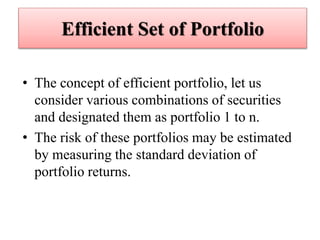
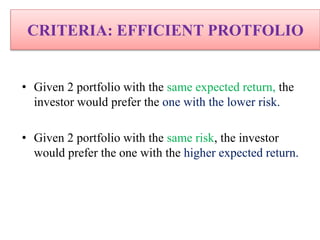
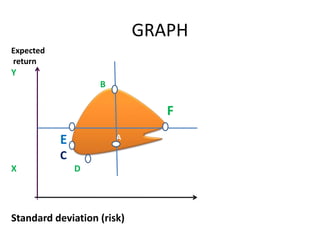
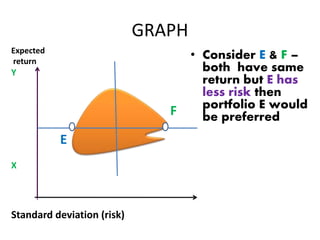
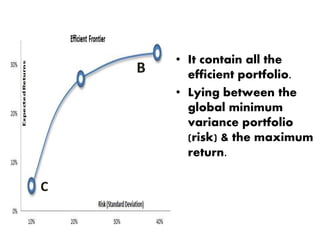
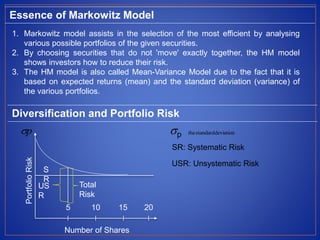
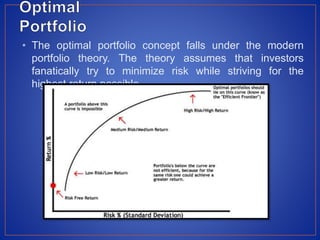
2. The Markowitz model aims to find the optimal portfolio, which provides the highest return and lowest risk. It does this by analyzing different combinations of securities to identify efficient portfolios.
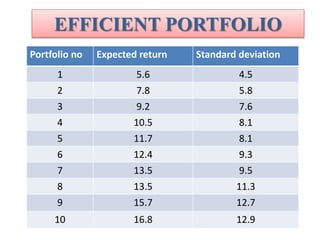
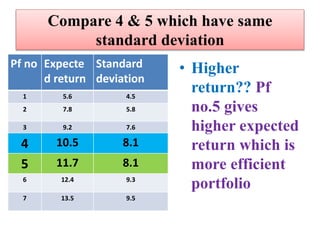
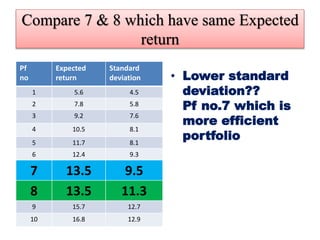
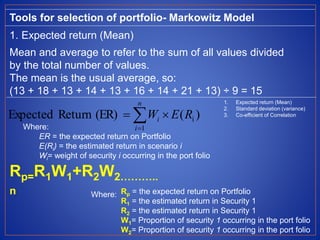
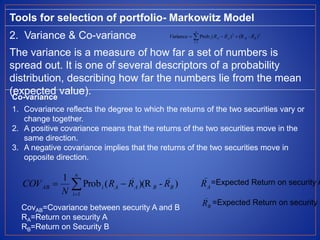
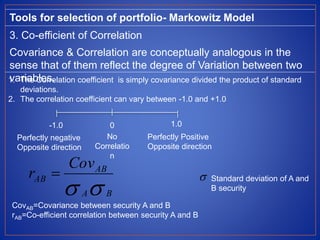
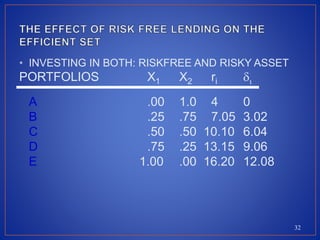
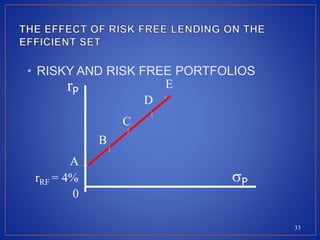
3. The document provides details on the tools and steps used in the Markowitz model for portfolio selection, including analyzing expected returns, variance, standard deviation, and coefficients of correlation between securities.