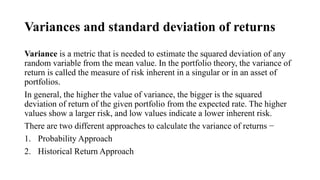
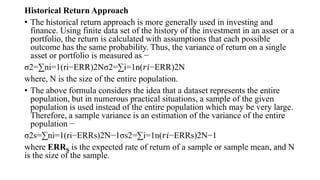
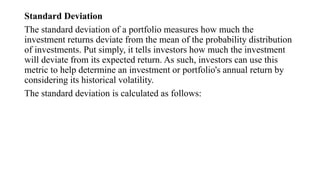
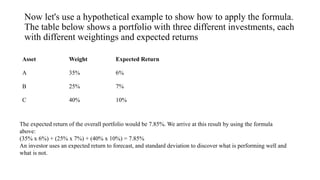
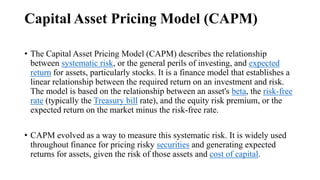
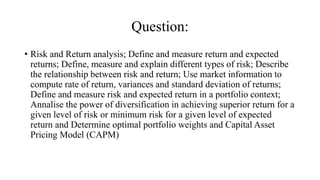
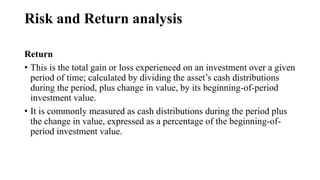
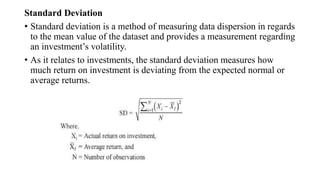
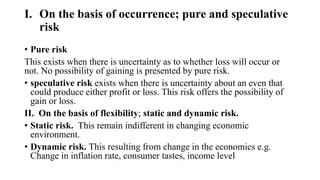
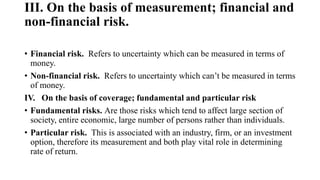
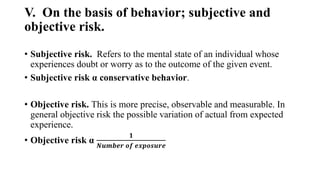
This document discusses concepts related to risk and return analysis in finance. It defines key terms like return, expected return, risk measures including beta, standard deviation, and alpha. It also categorizes different types of risk and explores the relationship between risk and return. Methods for computing rates of return from market data and calculating variance and standard deviation of returns are presented.


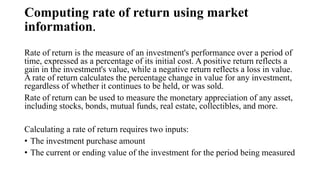
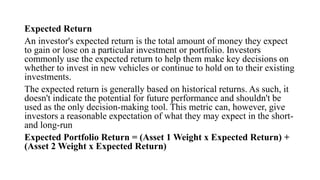
![A simple rate of return is calculated by subtracting the initial value of the
investment from its current value, and then dividing it by the initial value. To
report it as a %, the result is multiplied by 100.
Rate of Return % = [(Current Value – Initial Value) / Initial Value] x 100
For example, if a share price was initially $100 and then increased to a
current value of $130, the rate of return would be 30%.
[($130 - $100) / $100] x 100 = 30%
Rate of returns can certainly be negative as well, if the asset has lost value.
For the above example, if the share price had declined to $70, it would reflect
a -30% rate of return.](https://image.slidesharecdn.com/riskandreturnanalysis-230519085827-12864923/85/Risk-and-return-analysis-pptx-20-320.jpg)