Downloaded 1,687 times
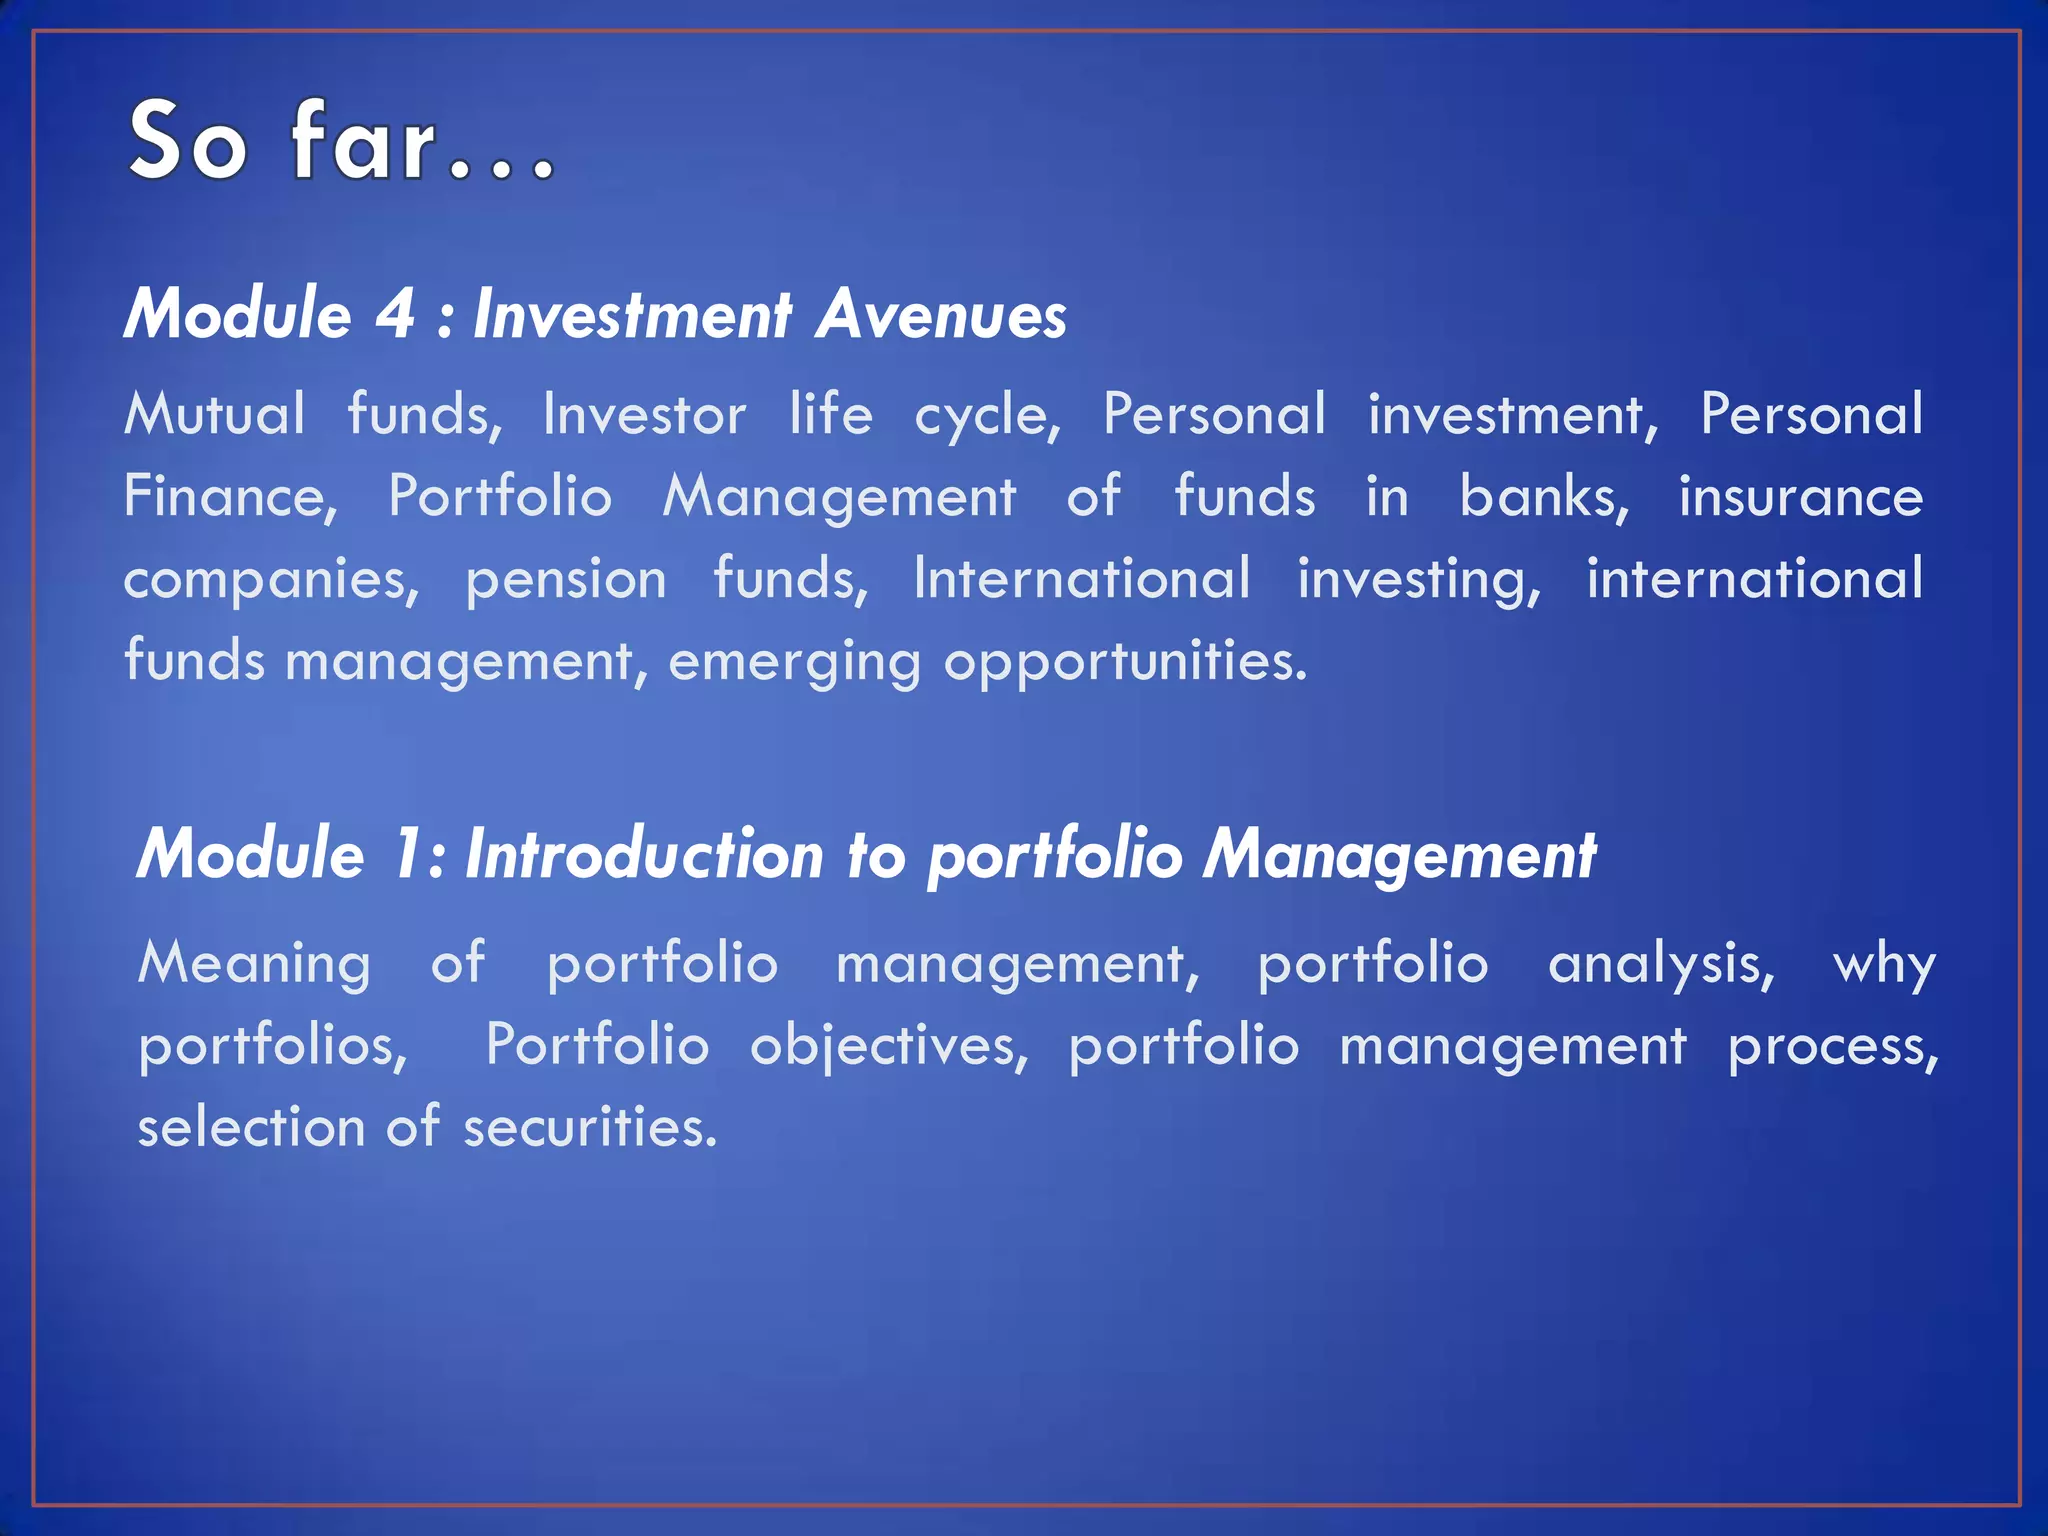

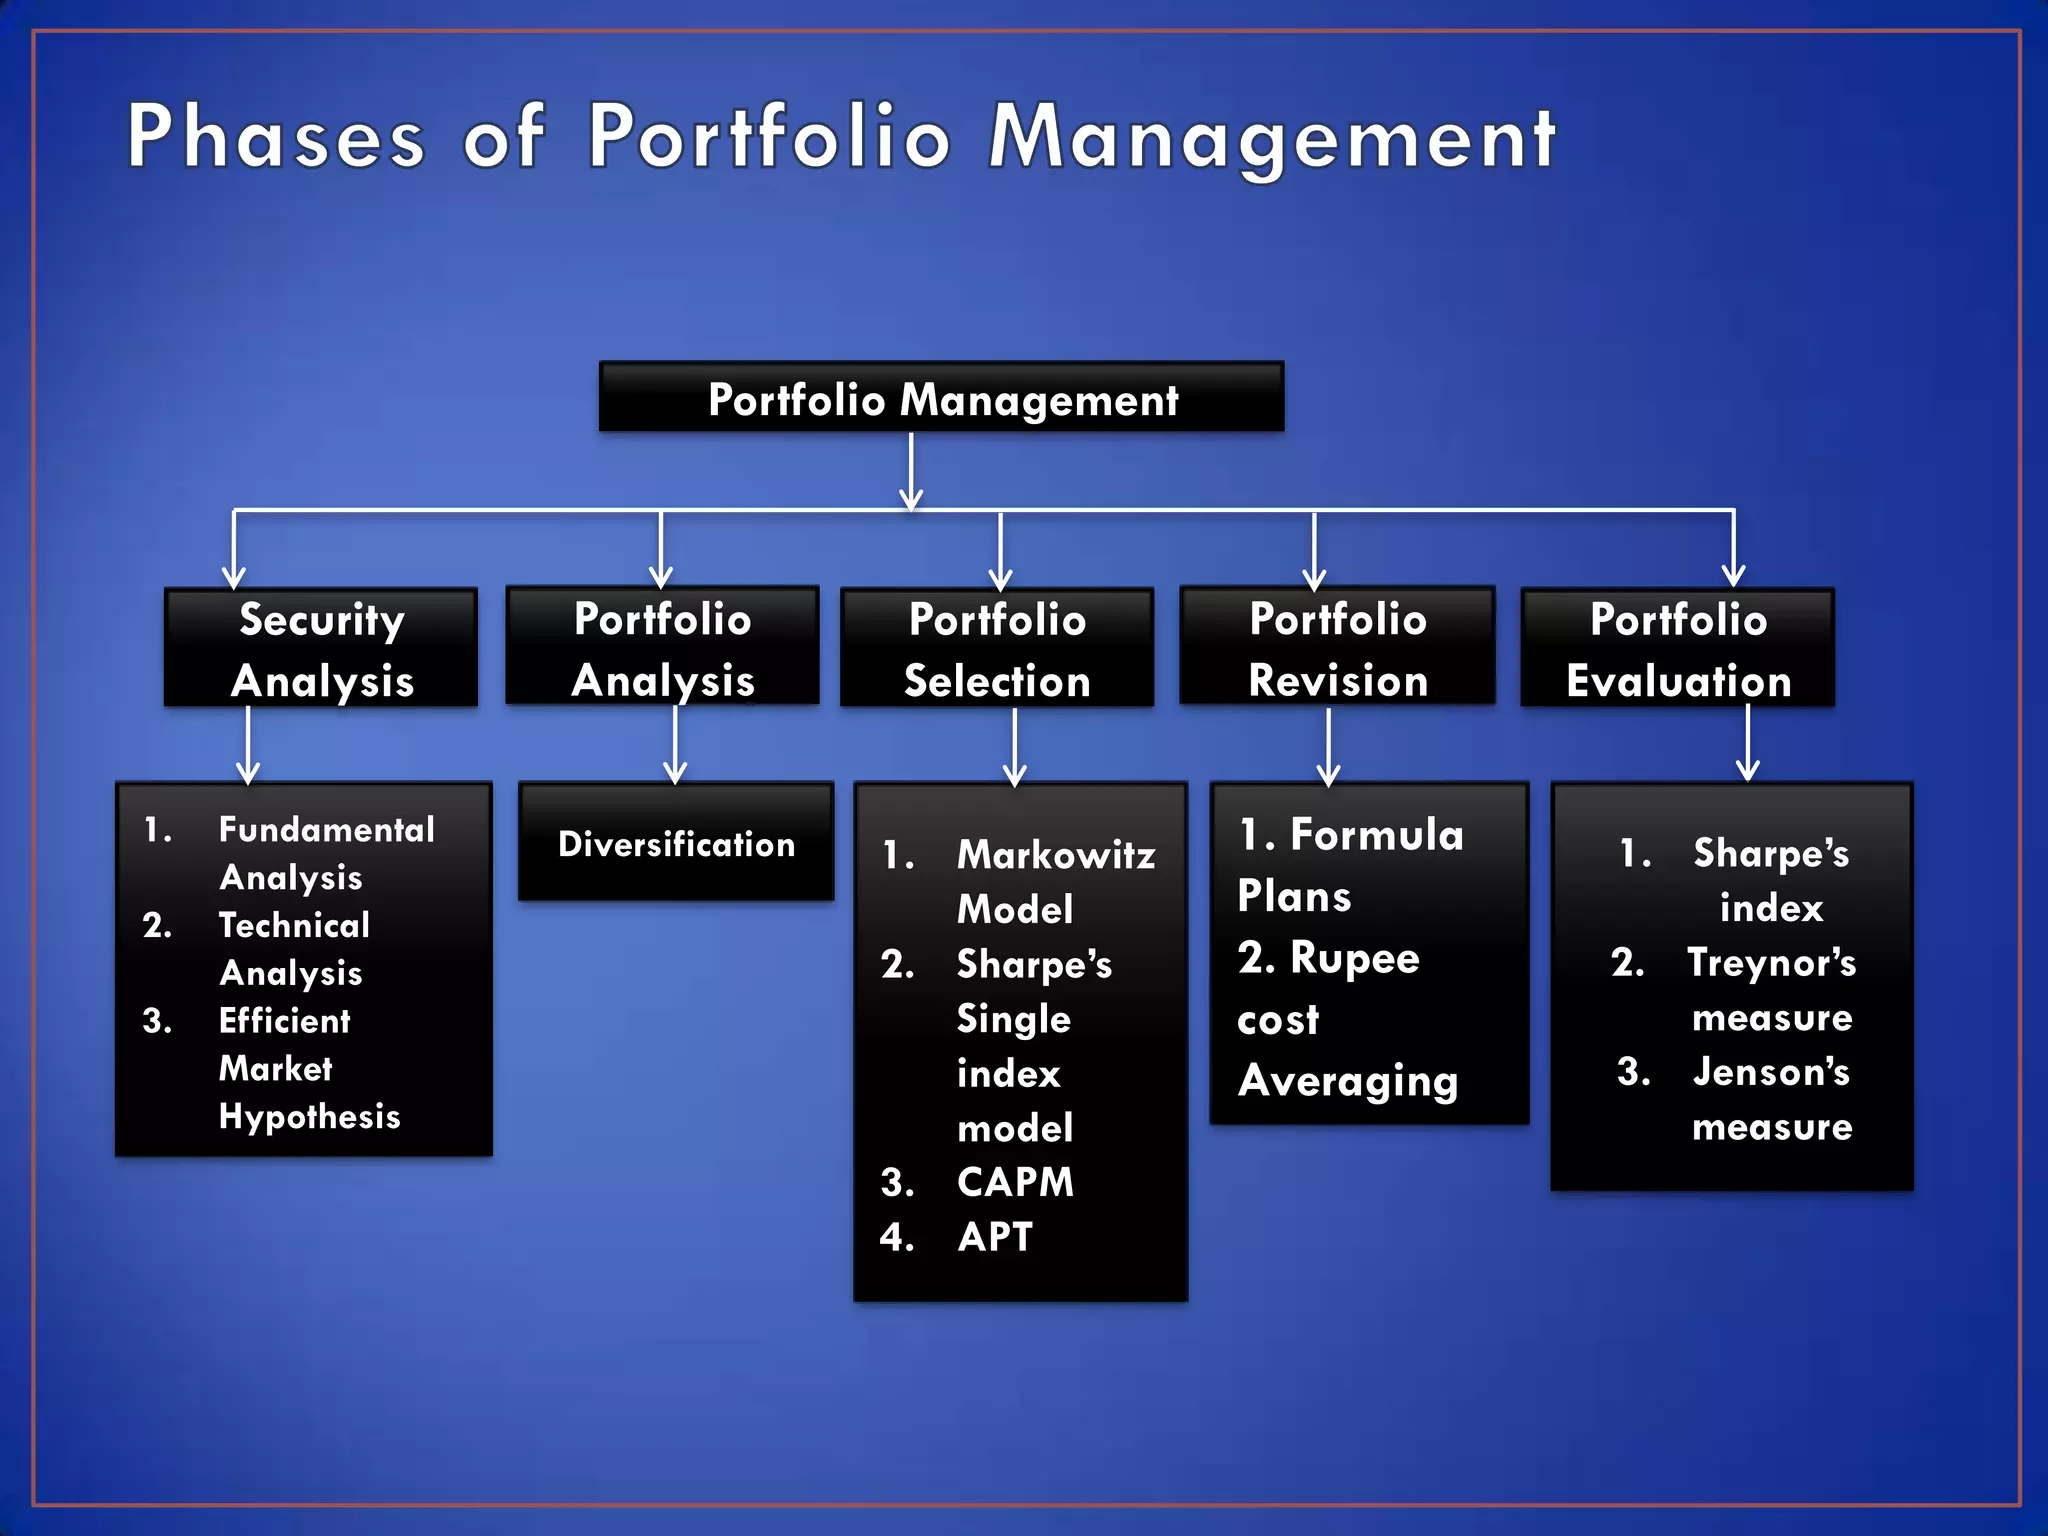


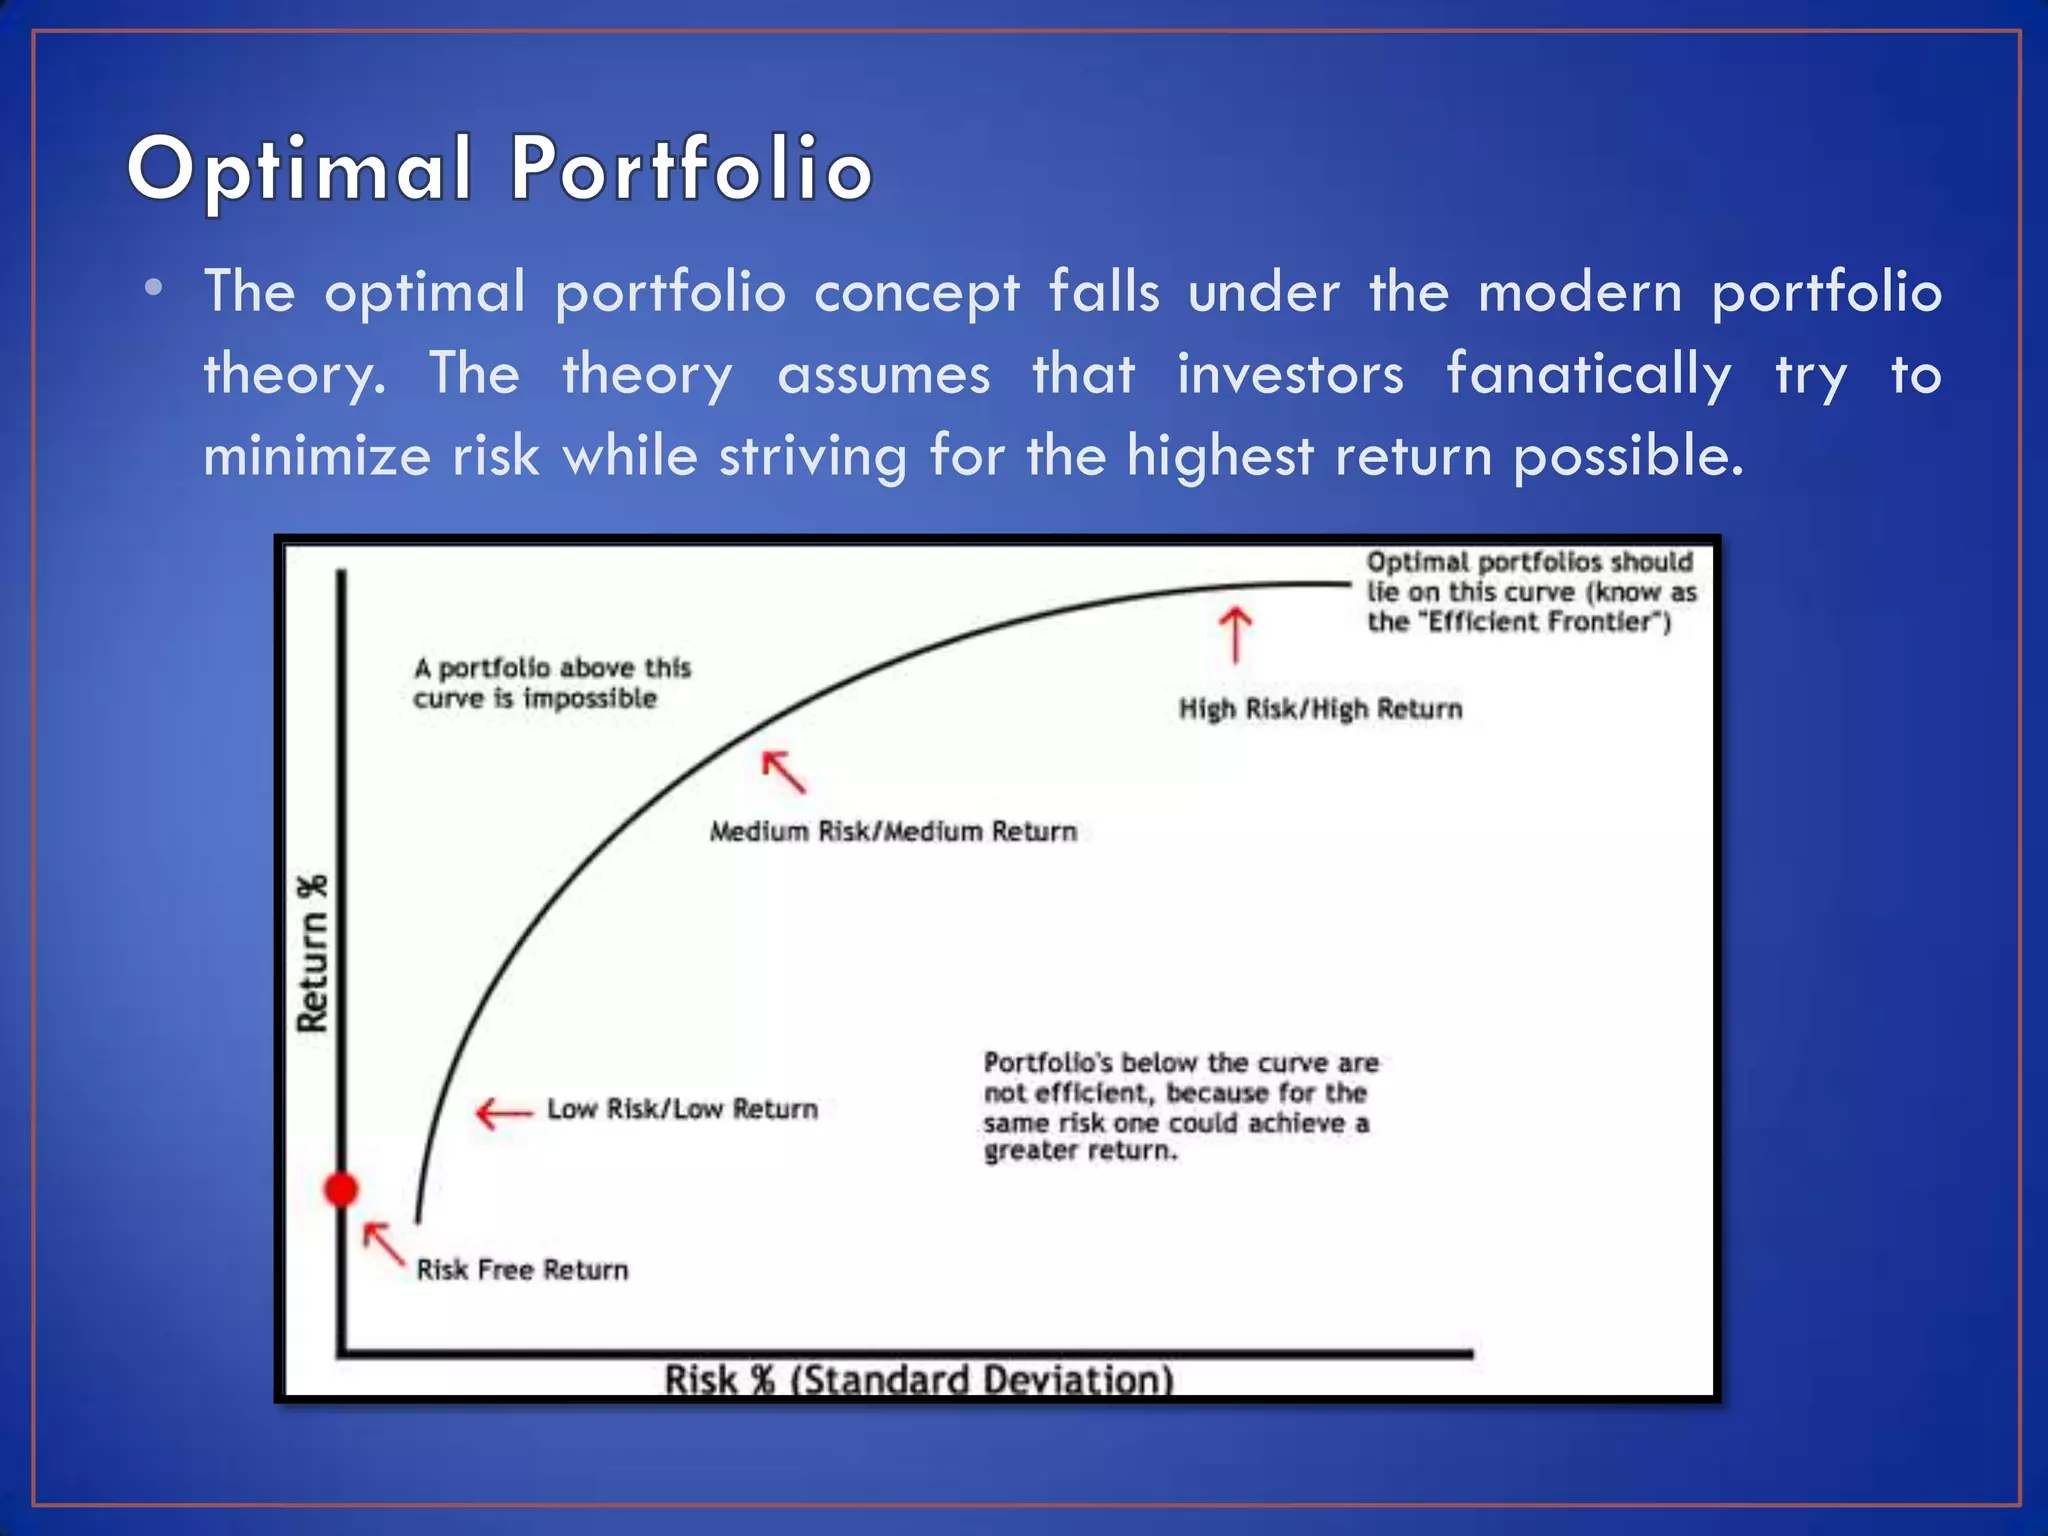


This module discusses key concepts related to investment avenues and portfolio management. It covers mutual funds, investor lifecycles, personal finance, international investing, and portfolio management of funds in banks, insurance companies and pension funds. It also provides an introduction to portfolio management, including the meaning of portfolio management, portfolio analysis, portfolio objectives, and the portfolio management process.