Downloaded 10 times


![The Wilcoxon signed-rank test is a non-parametric statistical
hypothesis test used when comparing two related samples,
matched samples, or repeated measurements on a single
sample to assess whether their population mean ranks differ
(i.e. it is a paired difference test). It can be used as an
alternative to the paired Student's t-test, t-test for matched
pairs, or the t-test for dependent samples when the
population cannot be assumed to be normally distributed.[1]](https://image.slidesharecdn.com/researchinprogressmarch-3-2015-sochat-150921070827-lva1-app6892/85/Research-in-Progress-Presentation-83-320.jpg)

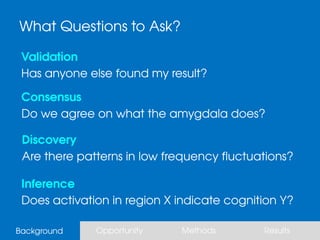
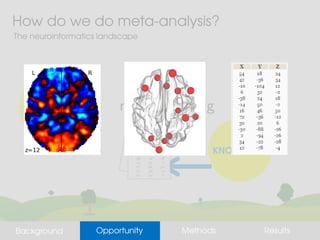
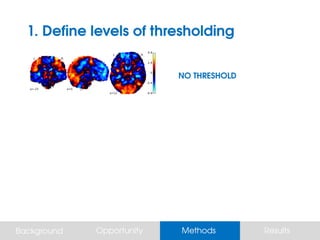
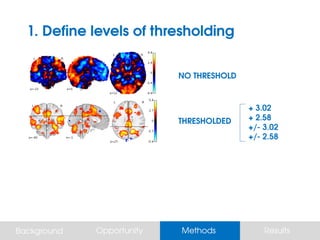
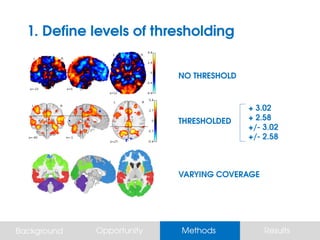
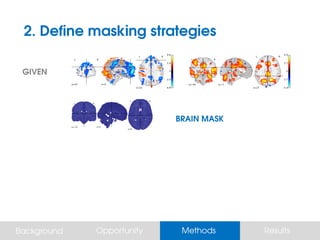
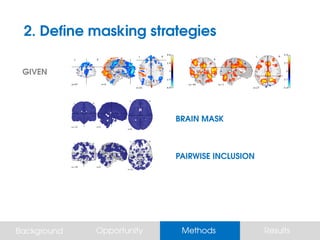
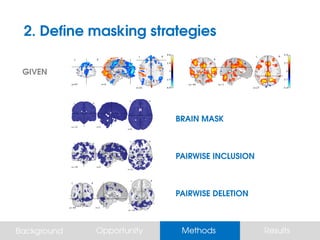
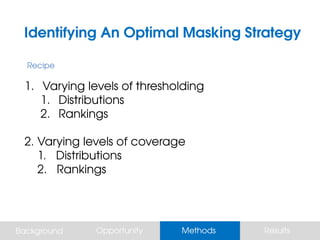
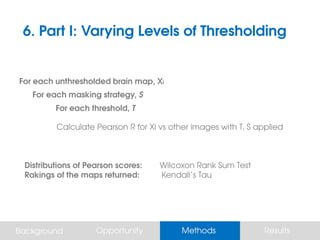
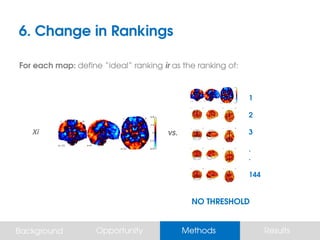
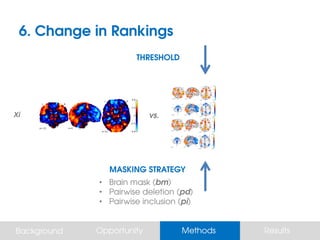
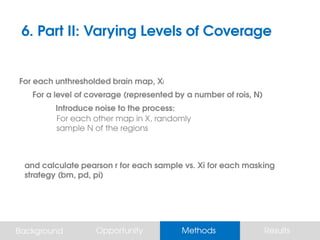
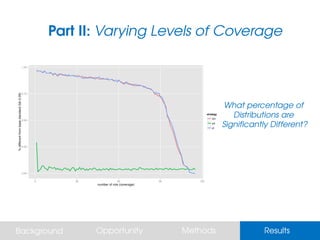
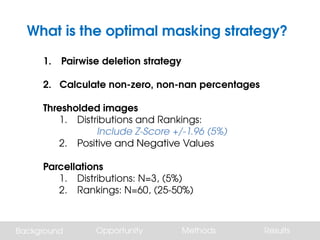
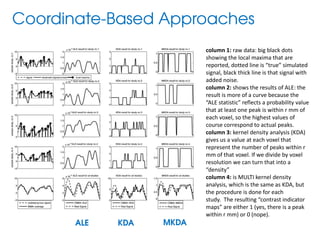
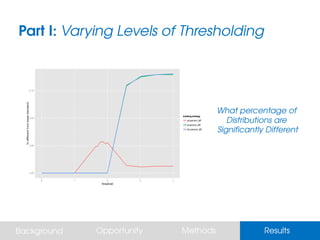
The document discusses different statistical methods for analyzing neuroimaging data: - ALE (Activation Likelihood Estimation) identifies areas of consistent activation across studies and represents activation likelihood as a statistical value. - KDA (Kernel Density Analysis) calculates the density of activation peaks within a radius of each voxel. - MULTI-KDA performs KDA separately on each study and represents the results as binary contrast indicator maps. The document also briefly defines the Wilcoxon signed-rank test as a non-parametric test that can be used as an alternative to paired t-tests when the population is not normally distributed. It assesses whether the mean ranks of two related samples differ.


![Polymer [ बहुलक ] Chemistry Notes PDF - Irfanullah Mehar - JJ Sir Chemistry.pdf](https://cdn.slidesharecdn.com/ss_thumbnails/polymerchemistrynotespdf-irfanullahmehar-jjsirchemistry-260210172118-3f9b37f7-thumbnail.jpg?width=640&height=640&fit=bounds)


