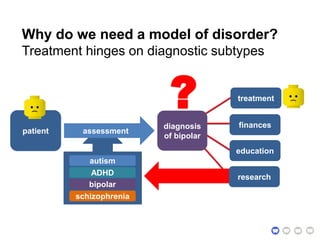
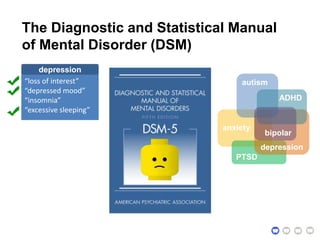
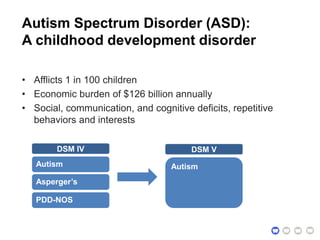
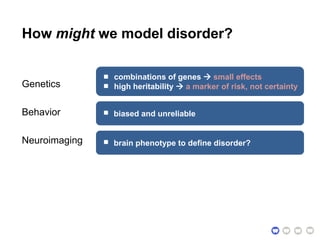
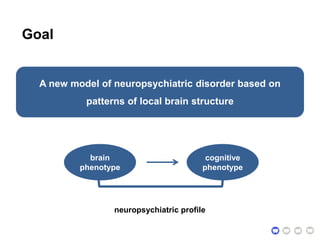
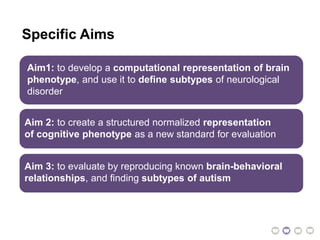
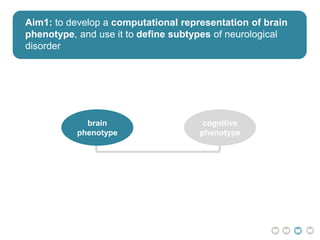
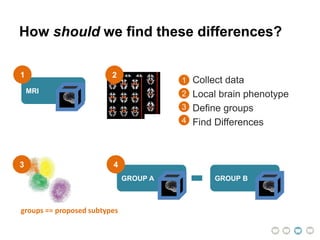
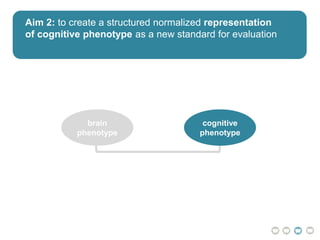
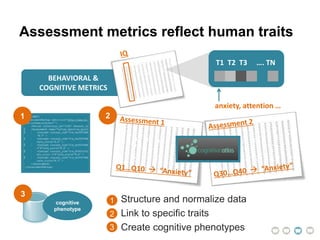
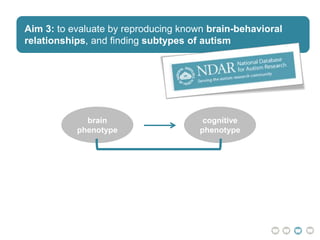
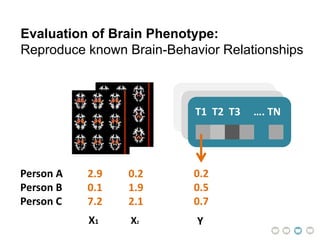
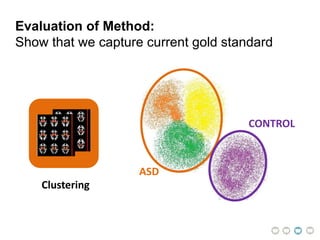
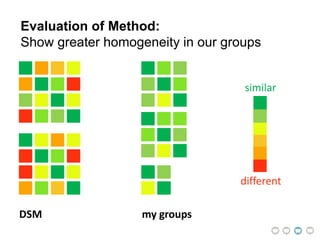
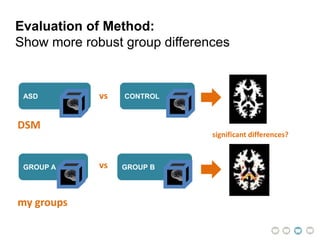
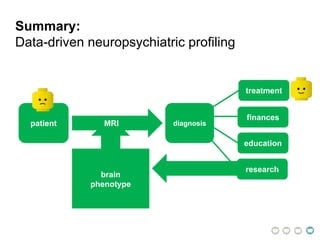
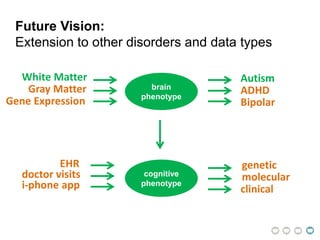
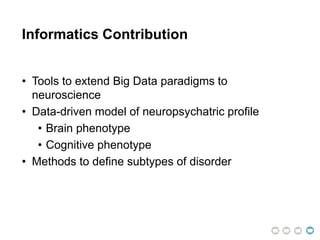
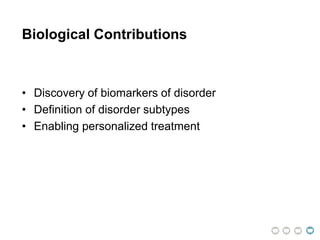
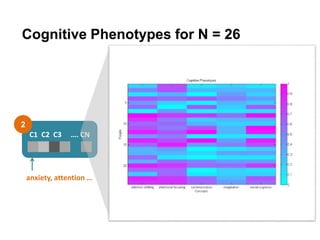
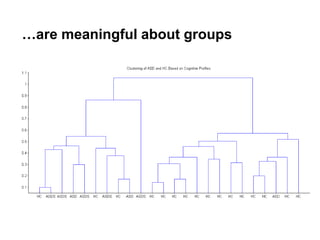
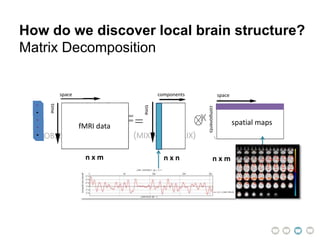
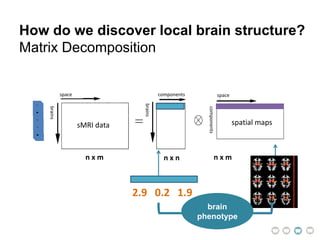
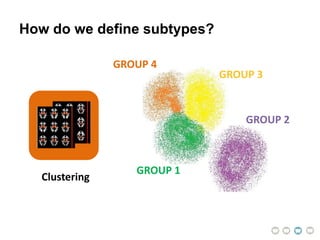
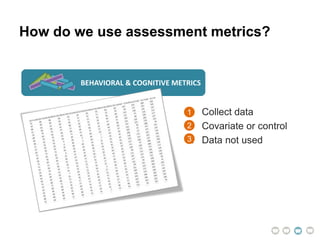
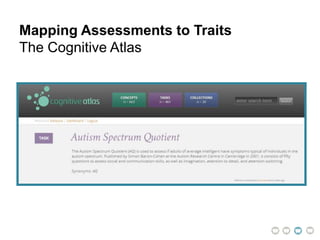
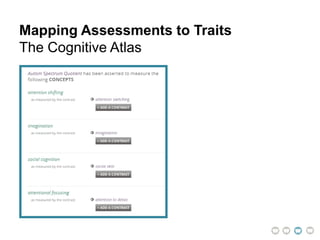
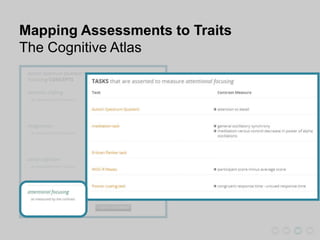
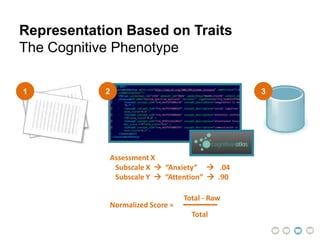
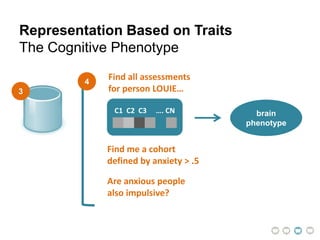
This document presents a proposal for developing a data-driven model of neuropsychiatric disorders based on analyzing patterns in brain structure and cognitive assessments. The goals are to define clinically useful subtypes of disorders, create standardized representations of brain and cognitive phenotypes, and evaluate the model by reproducing known relationships between the brain and behavior. Matrix decomposition would be used to discover local brain structure from neuroimaging data. Clustering would define disorder subtypes. Cognitive assessments would be mapped to traits and normalized to create cognitive phenotypes. The model could help enable personalized treatment by discovering biomarkers of disorders.
2. Why do we need a model of disorder?
Treatment hinges on diagnostic subtypes
patient assessment
autism
ADHD
bipolar
schizophrenia
diagnosis
of bipolar
treatment
education
finances
research
?diagnosis
of bipolar
treatment
education
finances
research
3. The Diagnostic and Statistical Manual
of Mental Disorder (DSM)
“loss of interest”
“depressed mood”
“insomnia”
“excessive sleeping”
depression
anxiety
PTSD
depression
autism
ADHD
bipolar
4. Autism Spectrum Disorder (ASD):
A childhood development disorder
• Afflicts 1 in 100 children
• Economic burden of $126 billion annually
• Social, communication, and cognitive deficits, repetitive
behaviors and interests
data-driven subtyping of autism spectrum disorders for
early diagnosis and tailored, effective treatmentAutism
Asperger’s
PDD-NOS
DSM IV
Autism
DSM V
6. How might we model disorder?
Genetics
Behavior
Neuroimaging
combinations of genes small effects
high heritability a marker of risk, not certainty
biased and unreliable
brain phenotype to define disorder?
7. Goal
A new model of neuropsychiatric disorder based on
patterns of local brain structure
neuropsychiatric profile
brain
phenotype
cognitive
phenotype
8. Hypothesis
Mining imaging data will define clinically-useful disease
subtypes better than currently possible using DSM alone.
9. Aim1: to develop a computational representation of brain
phenotype, and use it to define subtypes of neurological
disorder
Aim 2: to create a structured normalized representation
of cognitive phenotype as a new standard for evaluation
Aim 3: to evaluate by reproducing known brain-behavioral
relationships, and finding subtypes of autism
Specific Aims
10. Aim1: to develop a computational representation of brain
phenotype, and use it to define subtypes of neurological
disorder
brain
phenotype
cognitive
phenotype
12. Assumptions about the brain
Assumptions about the groups
How do we find brain-based differences?
make assumptions about spatial meaningfulness
voxel-wise features prime to overfitting
diagnostic categories represent homogenous syndromes
what about heterogeneity of the healthy controls?
learn groups from the data
make no assumptions about spatial location
strive for an abstraction of structure
13. Collect data
Local brain phenotype
Define groups
Find Differences
MRI
How should we find these differences?
1
2
3
4
1
GROUP A GROUP B
4
2
3
groups == proposed subtypes
14. Aim 2: to create a structured normalized representation
of cognitive phenotype as a new standard for evaluation
brain
phenotype
cognitive
phenotype
15. BEHAVIORAL &
COGNITIVE METRICS
Structure and normalize data
Link to specific traits
Create cognitive phenotypes
Assessment metrics reflect human traits
1
2
3
2
anxiety, attention …
T1 T2 T3 …. TN
1
3
cognitive
phenotype
16. Aim 3: to define and evaluate subtypes of
autism spectrum disorder
Aim 3: to evaluate by reproducing known brain-behavioral
relationships, and finding subtypes of autism
brain
phenotype
cognitive
phenotype
17. C1 C2 C3 …. CN
Evaluation of Brain Phenotype:
Reproduce known Brain-Behavior Relationships
C1 C2 C3 …. CN
T1 T2 T3 …. TN
0.2
0.5
0.7
2.9 0.2
0.1 1.9
7.2 2.1
Person A
Person B
Person C
X1 X2 Y
22. Future Vision:
Extension to other disorders and data types
brain
phenotype
AutismWhite Matter
ADHD
Bipolar
Gray Matter
Gene Expression
EHR
doctor visits
i-phone app
genetic
molecular
clinical
cognitive
phenotype
23. Informatics Contribution
• Tools to extend Big Data paradigms to
neuroscience
• Data-driven model of neuropsychatric profile
• Brain phenotype
• Cognitive phenotype
• Methods to define subtypes of disorder
25. Acknowledgements
Advisors and Panel
Daniel Rubin
Russ Altman
Mark Musen
Antonio Hardan
Colleagues
Kaustubh Supekar
Feature Group
The MIND Institute
Support Staff
John DiMario
Mary Jeanne & Nancy
Funding
Microsoft Research
SGF and NSF
Friends and Fellow BMI
Francisco Gimenez
Rebecca Sawyer
Luke Yancy Jr.
Beth Percha
Katie Planey
Tiffany Ting Lu
Linda Szabo
Diego Munoz
Jonathan Mortensen
The M&Ms previously known as first years
29. (OBSERVED DATA) (MIXING MATRIX) (ORIGINAL DATA)
X = A SX
n x m n x n n x m
fMRI data
time
time
space spacecomponents
components
spatial maps
How do we discover local brain structure?
Matrix Decomposition
30. n x m n x n n x m
How do we discover local brain structure?
Matrix Decomposition
sMRI data
brains
brains
components
components
space space
spatial maps
2.9 0.2 1.9
brain
phenotype
36. Representation Based on Traits
The Cognitive Phenotype
1 32
Assessment X
Subscale X “Anxiety” .04
Subscale Y “Attention” .90
Normalized Score =
Total - Raw
Total
37. 3
Representation Based on Traits
The Cognitive Phenotype
C1 C2 C3 …. CN
Find all assessments
for person LOUIE…
4
Find me a cohort
defined by anxiety > .5
Are anxious people
also impulsive?
brain
phenotype
Editor's Notes
Thank you for coming to my qualifying exam presentation today. My work that I will talk about pertains to data driven neuropsychiatric profiling, specifically using large data to define subclasses of mental illness.
First I will convince you that it’s important to model disorder. Mental disorders are the illnesses that we don’t like to talk about, even though 1 in 4 adults in any given year suffers from a mental disorder. Our ability to study these disorders and recommend treatment hinges on our ability to diagnose and subtype. For example an individual will go to a psychiatrist, they are assessed by the clinician, and given the diagnosis for the model that fits best. These diagnoses inform treatment, financing for mental health, education about mental health, and research. What happens when our models are bad? This entire system breaks. So with this in mind, what is our current model of disorder?
Behold, the DSM, the diagnostic and statistical manual of mental disorders. It models disorder based on “complex clinical features,” and a patient receives a diagnosis if they have some arbitrary number of these features. The problem with this approach is that symptoms and severity of symptoms varies hugely within disorder categories. For example, with depression you can either be extremely sleepy, or not sleep enough. And there is also overlap between categories, which leads to disagreement among clinicians, and going back to that original diagram, hinders our ability to treat and study disease. The failure of this model is reflected in the current release of the DSM V, which has completely obliterated many subtypes of disorder…
For example, Autism Spectrum Disorder is a family of heterogenous childhood developmental disorders that afflict 1 in 100 children, presents with with huge economic burden, and is characterized by a range of deficits, repetitive behaviors and extremely narrow interests. There is huge variance in type and severity of symptoms, and high comorbidity with other mental and medical disorders. On one end of this spectrum you have an individual who is severely mentally handicapped, and on the other end, someone who just comes across as socially anxious. DSM 4 tried to capture this variance with these three subtypes, but in DSM 5 everyone falls under the same bucket because the subtypes could not be validated. This sets up our current opportunity…
To create a data-driven model of neuropsychiatric disorder
MADE RIGHT SIDE RED/etc
So, what data might be incorporated into this model? We have been primarily looking in three places, we look for genetic, behavioral, and imaging based biomarkers. So, for a very small subset of individuals, there are in fact clear genetic markers, but the reality of this space is that the best that we’ve done is identifying combinations of genes that can explain small effects. We can observe that many disorders run in families, and at most we can say that puts family members at higher risk. That doesn’t help. And as evidenced by the DSM, most disorder is so heterogeneous that the behavioral and cognitive metrics that we use for assessment are not reliable for diagnosis. This is what makes imaging so appealing, specifically using brain based biomarkers to define disorder. And so given this current landscape, herein we see an opportunity to use brain phenotype as an unbiased, reliable biomarker of disorder.
Specifically, a new model of neuropsychiatric disorder based on patterns of local brain structure. I will use brain phenotype to predict cognitive phenotype, and these two things together will encompass our new model of disorder, what I am calling a neuropsychiatric profile.
Specifically, I am hypothesizing that mining imaging data will define clinically useful disease subtypes better than currently possible using DSM alone.
I approach this problem with the following three specific aims. I will first develop a computational representation of phenotype using imaging data, and use this phenotype to define subtypes of neurological disorder.
I will then create a structured, normalized representation of cognitive phenotype as a new standard for evaluation
And lastly, my evaluation has two parts. I will first evaluate the brain phenotype by reproducing known brain-behavioral relationships, I will evaluate this new model of disorder by using our brain and cognitive phenotypes to define subtypes of autism spectrum disorder.
We will first develop a computational representation of brain phenotype, and and this means novel imaging methods that discover patterns of brain structure without relying on apriori DSM defined groups. You are probably asking “why has work to this point not been able to identify these brain based biomarkers? The reason is because the methods that are used make strong assumptions about groups and the brain. Let’s review these current approaches.
Here is how it’s done. We start with our groups, as defined by the DSM, and we collect MRI data. We then process our data to make comparisons between people, and subject it to some statistical analysis that looks for significant differences between these groups. What’s are some problems here?
We make strong assumptions about the groups, and the brain. We make the assumption that the diagnostic categories, as defined by the DSM, represent homogenous syndromes, which isn’t the case. We also assume that this group of healthy controls is also homogenous, which is not the case. To address this, we will learn the groups from the data.
These methods also make assumptions about the brain. When we use predefined atlases or regions, we make strong assumptions about what is meaningful spatially, and when we use 2 million voxels as features, we are overfitting to our data, leading to inconsistent results. To address this, my approach will learn groups from the data, and I will strive for an abstraction of structure that makes no assumptions about spatial location.
Here is how we should find these differences. We should equivalently collect our data, but then we will extract abstract patterns of local brain phenotype, and define groups using those patterns. These groups are our subtypes. Then to localize differences we can go back to the standard approaches. This novel brain phenotype will reveal groups of individuals that are similar based on patterns of local brain structure.
Now I know what you are thinking. How do we evaluate these patterns? The answer comes by way of our second aim…
So it should be apparent that that the success of this approach relies on our ability to have a method that can accurately define local brain structure.
Which is to create a structured, normalized representation of cognitive phenotype. And as we talked about earlier, because one DSM label does not capture the heterogeneity of an individual’s behavior or cognition, we are going to evaluate our patterns based on predicting more detailed metrics.
Specifically, we are going build our cognitive profiles using behavioral metrics that are collected for these large studies, but largely get wasted. Researchers might use one metric as a covariate or control, but the rest just rots in large, unstructured excel files. However, these metrics are incredibly rich in information. They are measurable qualities for human traits like anxiety, attention, and they have been experimentally validated. So we want to be able to extract different levels of these human traits to be used as outcomes for our experiments.
So I will give this data structure and normalize it, and by way of an ontology called the Cognitive Atlas we can ascribe specific metrics to the traits that they measure. For example, if two studies use different assessments to asses anxiety, with the cognitive atlas we can see that both metrics are assessing anxiety, and we can compare them.
We can then put these structured files in a big database, and query the database to create a cognitive phenotype for each person, or a normalized score that represents where an individual falls in the domain of trait anxiety, or attention. This set of scores is our novel cognitive phenotype.
And we will use this cognitive phenotype to evaluate our brain phenotypes by reproducing known brain behavior relationships. We are going to use brain phenotype to predict cognitive phenotype. We also want to evaluate the method by finding subtypes of a particular disorder, specifically autism spectrum disorder. We will use data from NDAR, which has about 3000 structural scans and associated behavioral data.
Our first method to evaluate our brain phenotypes will be to reproduce known behavior relationships.
Each of our patterns of local brain structure become our features, and these cognitive traits becomes a variable that we want to predict, and and we use regression techniques to identify patterns of brain structure that predict, for example, how anxious someone is, or how intelligent. For example, a validation would be finding an association between a pattern of structure specific to the amygdala and level of anxiety.
This is powerful because a new person could come in, and we could say something about his or her behavior from a structural brain imaging scan alone.
We will also evaluate our method by showing that it captures the current gold standard, the DSM labels. So we would want to see these higher level groups emerge in our subtypes.
But we need to go beyond that. We can’t just show that we capture the current standard, we need to show that our groups are better. And we are going to do this by demonstrating that there is greater homogeneity in our groups than those defined by DSM. These represent similarity matrices for the DSM defined groups, and for the same number of people, in groups defined by our methods. We would calculate similarity metrics for both cognitive and brain phenotypes for groups defined by DSM, and then our groups, and an improvement in grouping means that my groups are more similar than DSM defined groups.
Lastly, we will evaluate the method by taking our groups and plugging them back into the old methods to assess for significant differences. For example, a two sample t-test to assess for voxelwise structural differences. We would want to demonstrate that our groups can find more significant differences than the original DSM groups.
In summary, I am proposing a data-driven and unbiased novel method for diagnosis of neuropsychiatric disorder that will allow for definition of subtypes, and more informed treatment and research.
My future vision for this work is to extend the methods to other disorders and data types. For example, we are currently pursuing using white matter to define subtypes of autism, but the strength of this method is that we could use any kind of brain imaging.
We are currently using the brain phenotype to predict cognitive phenotype, which is our gold standard. If we can get beyond this problem we can use the cognitive phenotype not as something to predict, but as a feature. We can then extend these phenotypes to other kinds of data, and with ontologies that map different kinds of data to traits, we could even inform the cognitive phenotype from other data sources.
In conclusion, we are extending big data methods to neuroscience. The big picture here is that we are making possible a new paradigm for mental illness. In this universe, we don’t need to slap someone with a particular label, we can understand them in terms of a neuropsychiatric profile that encompasses a brain and cognitive phenotype.
This is going to allow for the discovery of biomarkers of disorder, definition of subtypes, and most importantly, these subtypes will help to match an individual to a group to advise treatment.
Things to know really well:
principal component analysis, factor analysis, and projection pursuit
ICA, choosing number components, infomax
Structuring data with xml
Querying xml data (sparql?)
When I have cog and brain phenotype – how are each structured, related to original metrics?
What am I going to do with ICA to represent brain phenotypes?
How am I going to relate brain and behavioral data?
Things that could go wrong
IDEALLY: we find some consistent patterns across patients
POSSIBLY: we find no patterns across patients (then what will I do?)
The answer to this problem comes by way of matrix decomposition. The basic idea is that there is some true, non-observed signal, these are our patterns of local structure, that when multiplied by a set of weights, results in the data that we observe, which is the person’s anatomical scan.
In neuroimaging, an algorithm of this type, independent component analysis, is used with not structural, but functional data. So we start with 3D images of a person’s brain function over time, and then when we do the decomposition, the independent signals turn out to be spatial maps to describe functional brain networks, in the rows of this matrix, as described by a particular time course, in this matrix.
I want to spin this on its head a bit. Instead of having functional scans over time, each of these will be a 3D image of a different person’s brain structure, for many people. We will do a decomposition to re-represent these structural maps as patterns of local structure in this matrix, and in the rows of this matrix we will have weights that represent the salience of any particular structural image to a pattern of local structure. These maps, and the weights associated with each one, encompass our novel representation of brain phenotype.
Now we can define our subtypes by using unsupervised methods from machine learning. This will reveal groups of individuals that are similar based on patterns of local brain structure.
Now I know what you are thinking. How do we evaluate these patterns? The answer comes by way of our second aim…
This will look familiar. Here is how we currently assess behavior and cognition. In these same imaging studies, we also collect very extensive behavioral and cognitive metrics, which look like this, messy, unstructured text files. A handful of these metrics sometimes are used as covariates in imaging analysis, or as controls to make sure you don’t have huge differences in your DSM defined groups, but that’s it! They get zipped up with imaging data, and largely get wasted. The reason we can’t harness this kind of data, other than it being messy, is that there is no way different imaging studies use the exact same metrics. There is currently no work that gives this data structure, and uses informatics to make comparisons between metrics.
We can do that with the Cognitive Atlas, a behavioral and cognition ontology that models concepts (like anxiety), tasks (such as the Autism Spectrum Quotient) and then groups of either one, called a collection. Using this atlas is going to allow us to intelligently combine metrics across studies that don’t overlap. For example, if there are two metrics that both reflect verbal intelligence, we will be able to compare them. For example, if we look at this assessment, the Autism Spectrum Quotient
The atlas will tell us that it measures these concepts, as represented by these subscales
If we look at a particular concept, just to show you, there are other assessments that also measure this concept.
So this is super simple. We take our raw assessment data, give them structure and in this structure, we link them to the cognitive atlas. The atlas tells us what trait concept we are measuring, and by simply subtracting the total score from the raw score and dividing by the total, we get a normalized value for the trait.
So then we can have a big database of these files, and we can query across the database.
The simplest functionality is to find all assessments for one or more people, and create a cognitive phenotype for each person, and relate these phenotypes to other data, in our case this will be brain phenotype.
Another use case is to create specific cohorts based on one or more traits., and more advanced methods can let us ask questions like “Are anxious people also impulsive?”