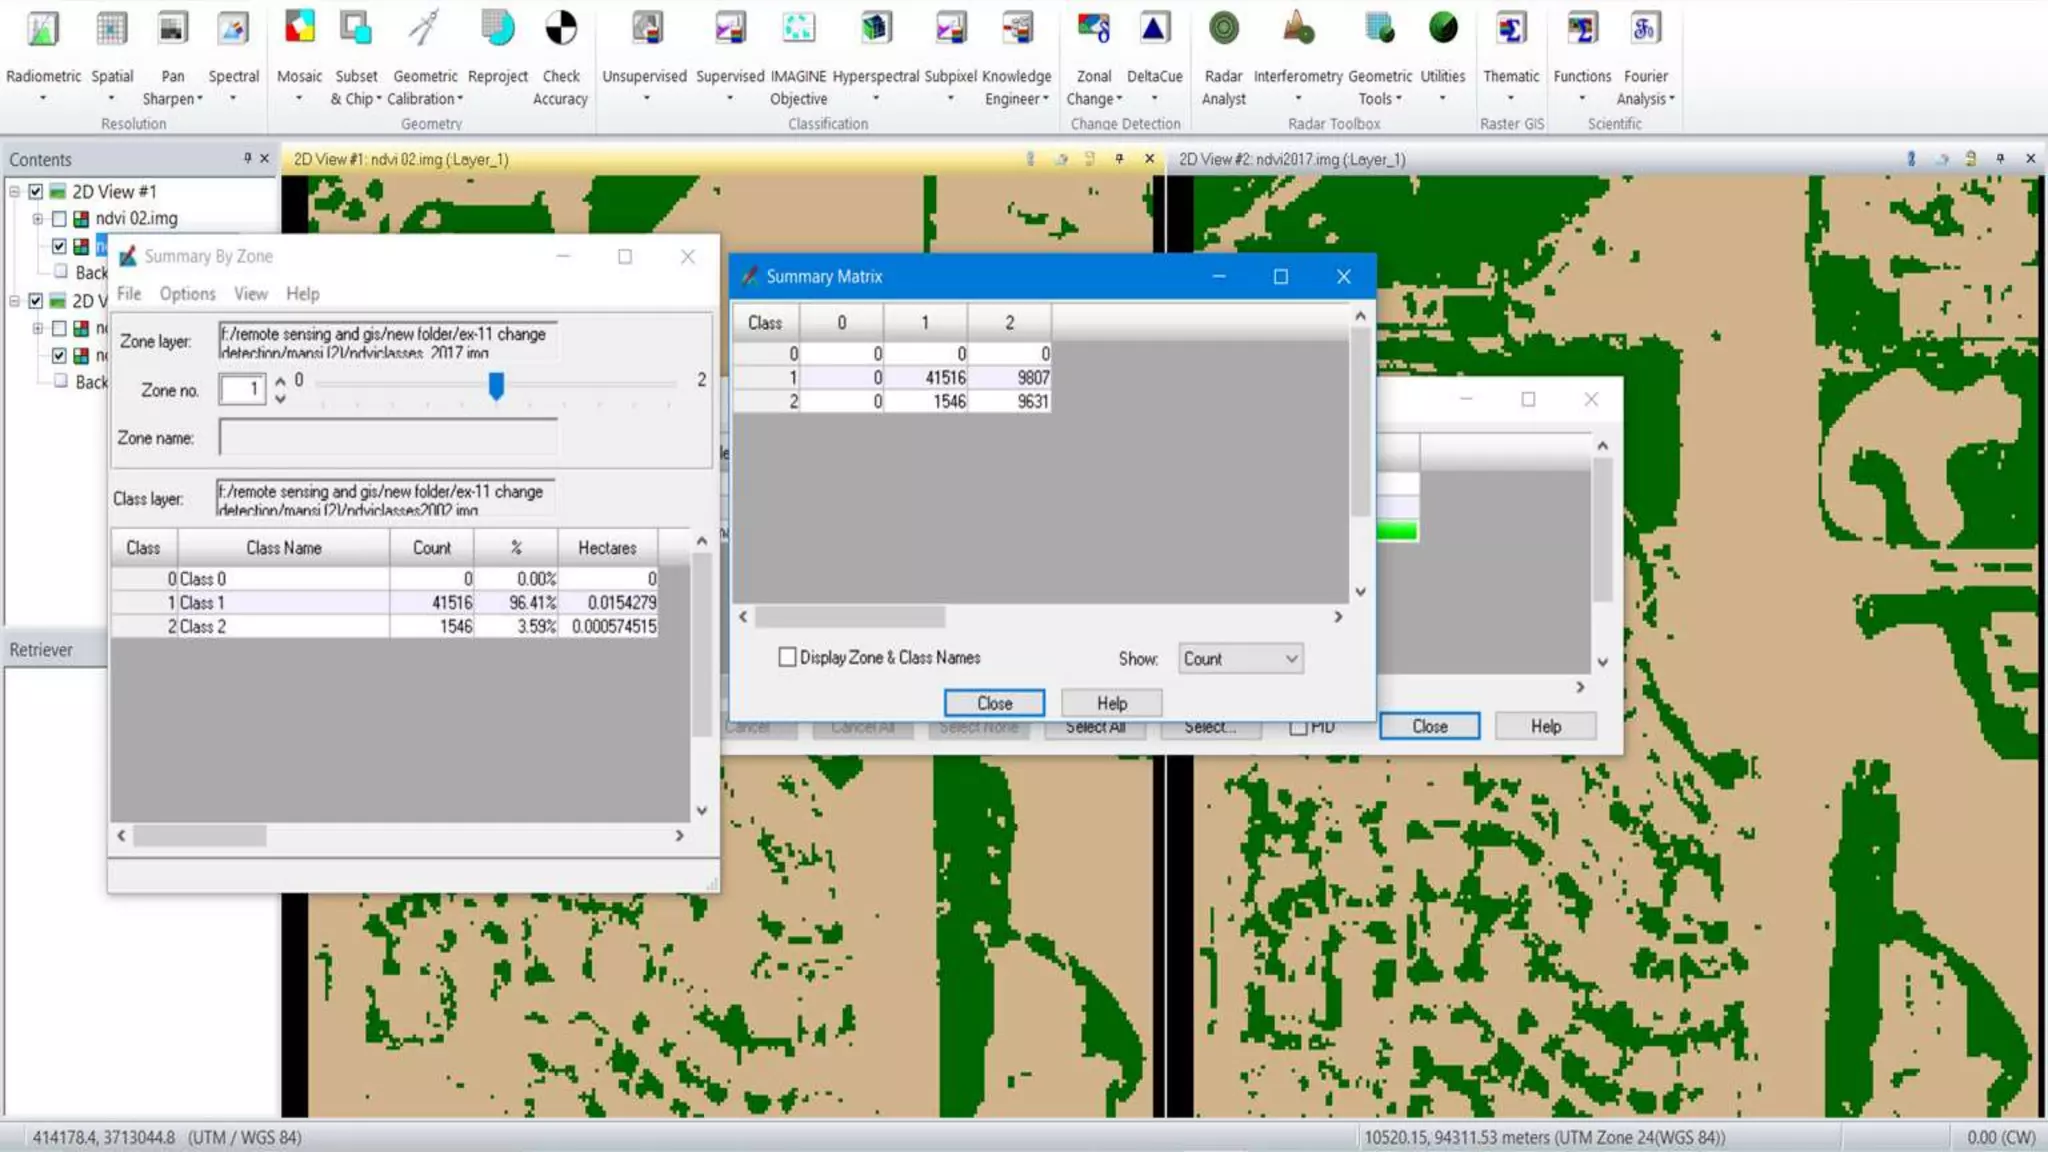
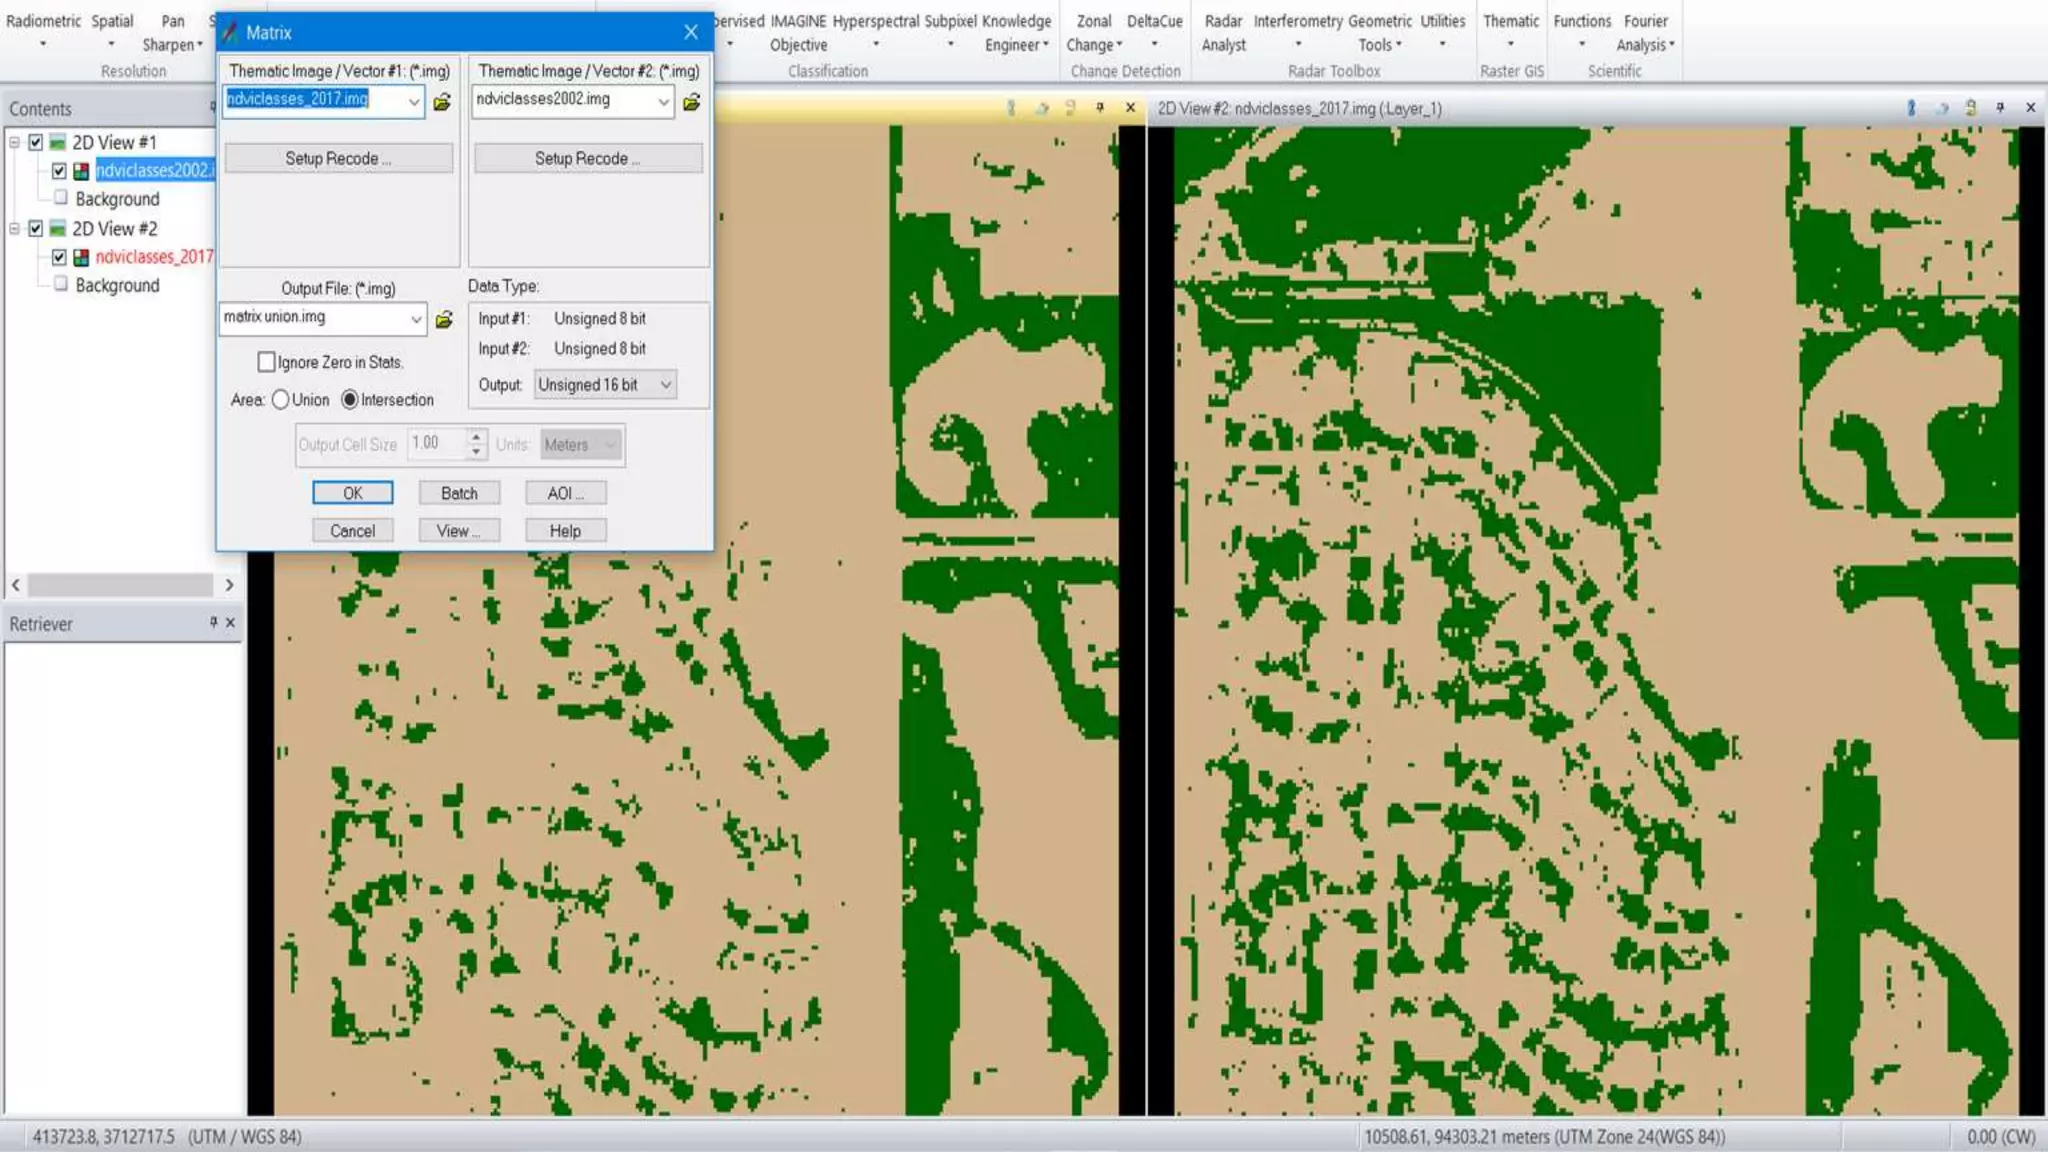
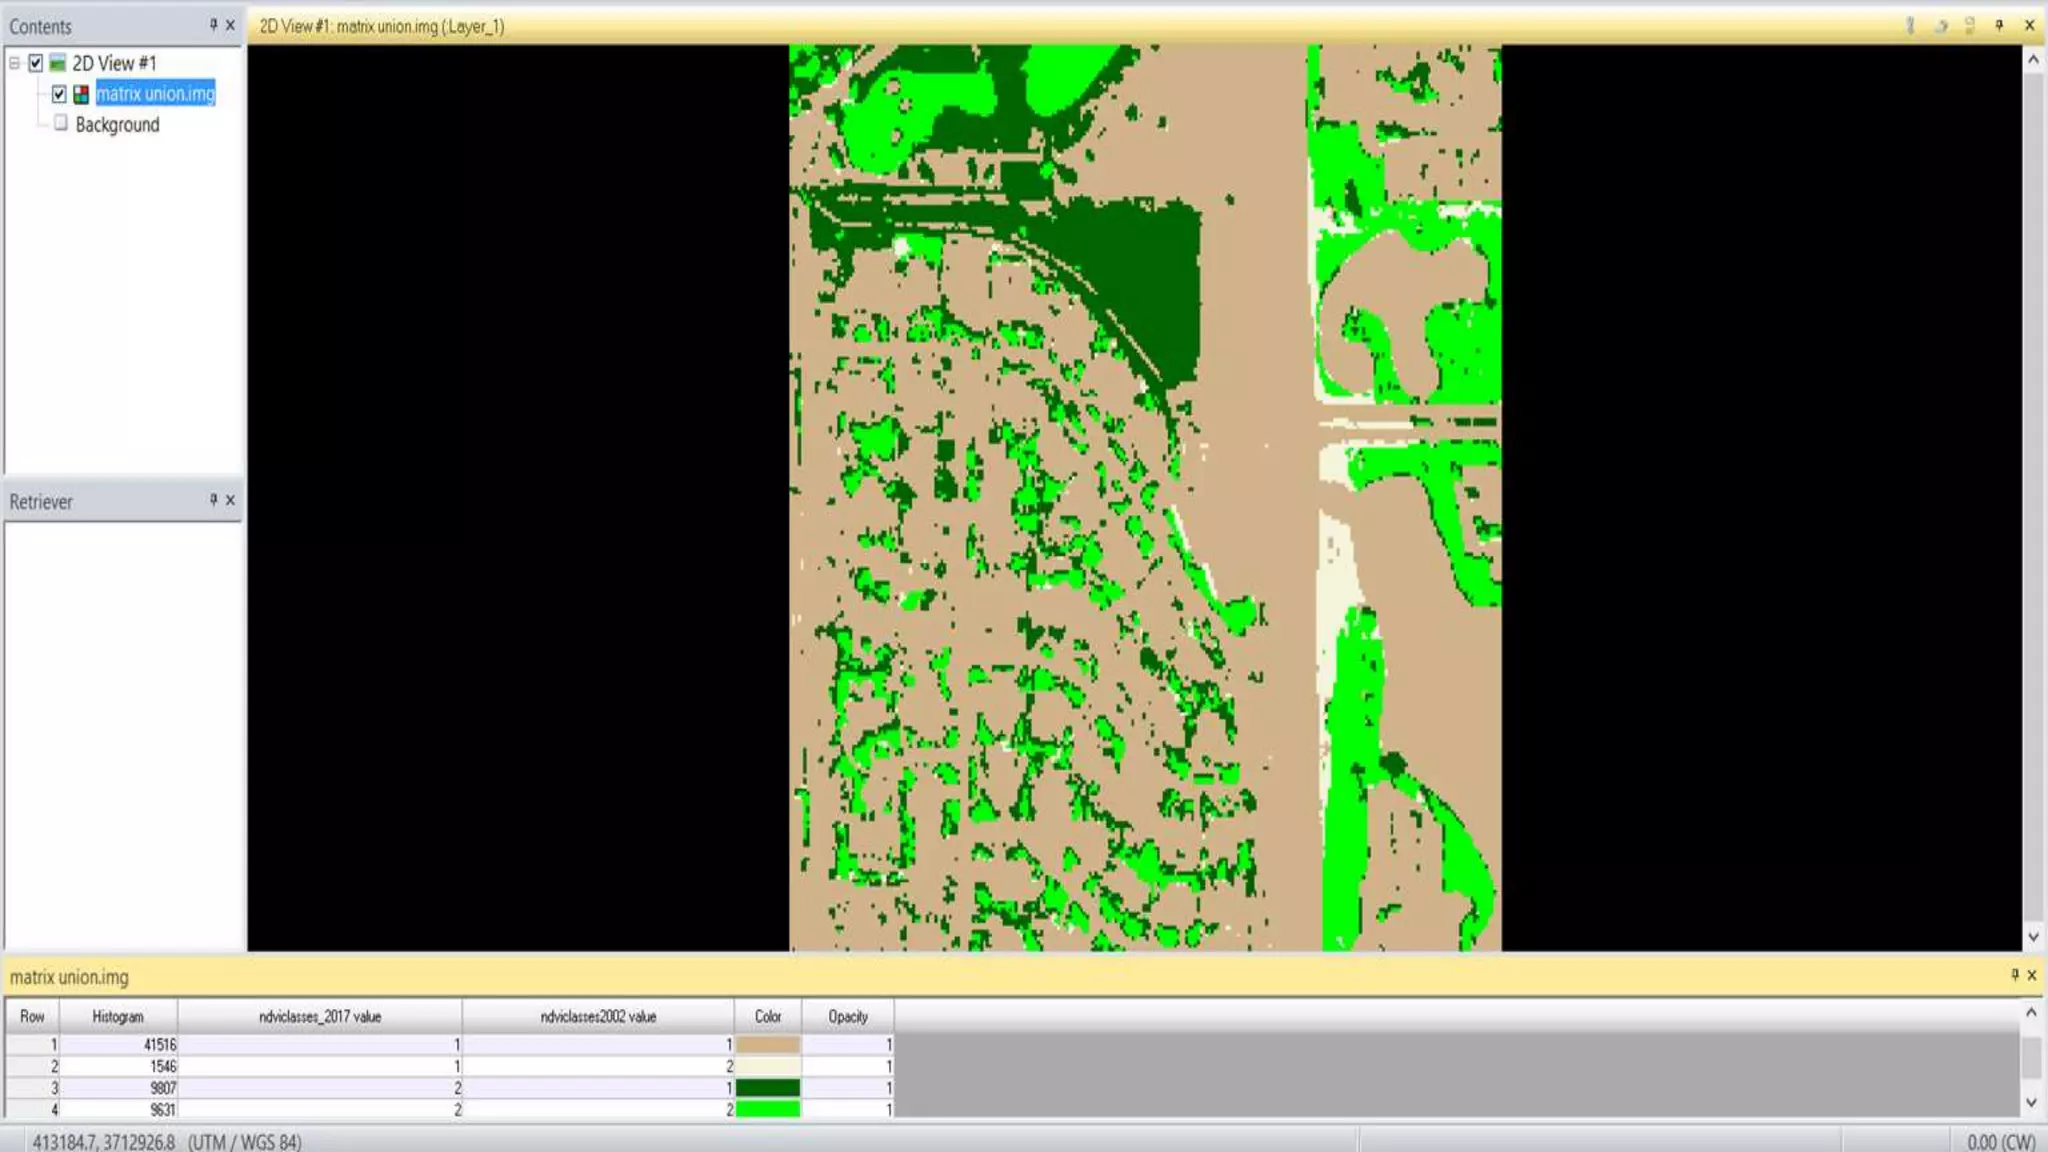
KAMLESH KUMAR
In the context of remote sensing, change detection refers to the process of identifying differences in the state of land
features by observing them at different times. This process can be accomplished either manually (i.e., by hand) or with the
aid of remote sensing software. Manual interpretation of change from satellite images or aerial photos involves an observer
or analyst defining areas of interest and comparing them between images from two dates. This may be accomplished either
on-screen (such as in a GIS) or on paper. When analyzing aerial photographs, a stereoscope which allows for two spatially-
overlapping photos to be displayed in 3D, can aid photo interpretation. Manual image interpretation works well when
assessing change between discrete classes (forest openings, land use and land cover maps) or when changes are large (e.g.,
heavy mechanized maneuver damage, engineering training impacts). Manual image interpretation is also an option when
trying to determine change using images or photos from different sources (comparing historic aerial photographs to current
satellite imagery).
Automated methods of remote sensing change detection usually are of two forms: post-classification change detection and
image differencing using band ratios. In post-classification change detection, the images from each time period are classified
using the same classification scheme into a number of discrete categories like land cover types. The two (or more)
classifications are compared and the area that is classified the same or different is tallied. With image differencing, a band
ratio such as NDVI is constructed from each input image, and the difference is taken between the band ratios of different
times. In the case of differencing NDVI images, positive output values may indicate an increase in vegetation, negative
values a decrease in vegetation, and values near zero no change. With either post-classification or image differencing change
detection, it is necessary to specify a threshold below which differences between the two images is considered to be non-
significant. The specification of thresholds is critical to the results of change detection analysis and usually must be found
through an iterative process.
Add both the classified
and unclassified image to
the window but the task
should be performed on
the unclassified image as
shown in the image.
Open the classified
image
Go to Thematic tab
on raster and select
Summary Report of
Matrix
Signing off..

Remote Sensing: Change Detection

  • 1.
  • 2.
    In the contextof remote sensing, change detection refers to the process of identifying differences in the state of land features by observing them at different times. This process can be accomplished either manually (i.e., by hand) or with the aid of remote sensing software. Manual interpretation of change from satellite images or aerial photos involves an observer or analyst defining areas of interest and comparing them between images from two dates. This may be accomplished either on-screen (such as in a GIS) or on paper. When analyzing aerial photographs, a stereoscope which allows for two spatially- overlapping photos to be displayed in 3D, can aid photo interpretation. Manual image interpretation works well when assessing change between discrete classes (forest openings, land use and land cover maps) or when changes are large (e.g., heavy mechanized maneuver damage, engineering training impacts). Manual image interpretation is also an option when trying to determine change using images or photos from different sources (comparing historic aerial photographs to current satellite imagery). Automated methods of remote sensing change detection usually are of two forms: post-classification change detection and image differencing using band ratios. In post-classification change detection, the images from each time period are classified using the same classification scheme into a number of discrete categories like land cover types. The two (or more) classifications are compared and the area that is classified the same or different is tallied. With image differencing, a band ratio such as NDVI is constructed from each input image, and the difference is taken between the band ratios of different times. In the case of differencing NDVI images, positive output values may indicate an increase in vegetation, negative values a decrease in vegetation, and values near zero no change. With either post-classification or image differencing change detection, it is necessary to specify a threshold below which differences between the two images is considered to be non- significant. The specification of thresholds is critical to the results of change detection analysis and usually must be found through an iterative process.
  • 3.
    Add both theclassified and unclassified image to the window but the task should be performed on the unclassified image as shown in the image.
  • 4.
  • 5.
    Go to Thematictab on raster and select Summary Report of Matrix
  • 11.