Downloaded 336 times
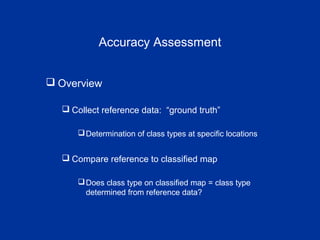
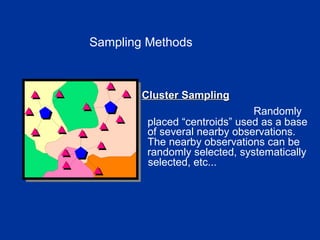
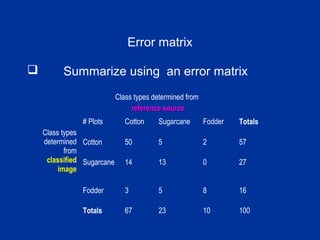
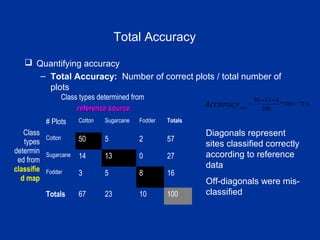
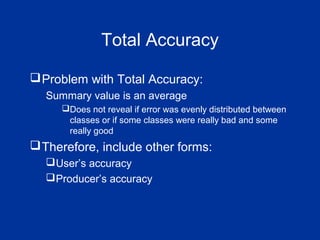
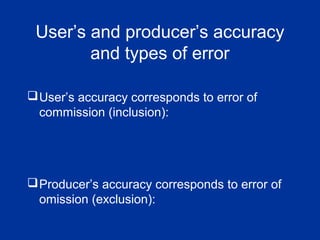
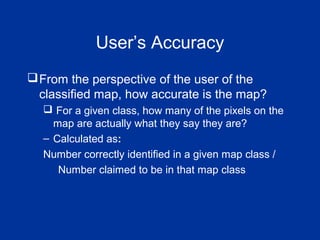
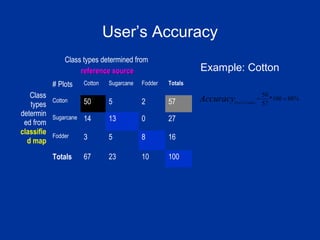
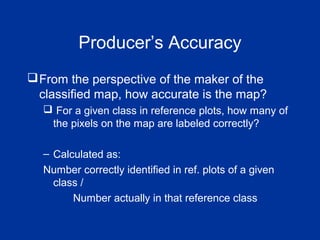
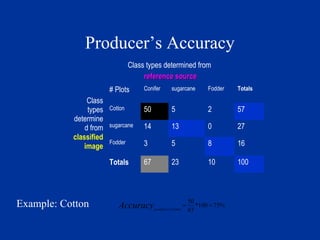
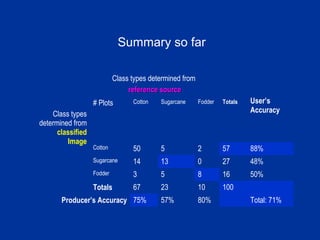
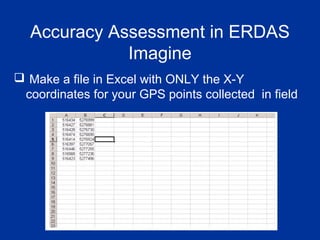
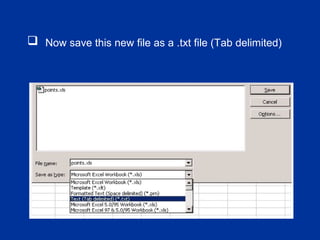
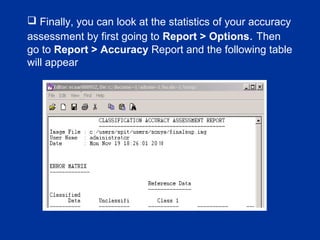

Accuracy assessment is an essential step in any remote sensing classification. It involves collecting reference data through methods like GPS ground sampling and comparing the classifications to determine accuracy. Key aspects of accuracy assessment include error matrices to calculate overall, user's, and producer's accuracies. User's accuracy indicates errors of commission while producer's accuracy reflects errors of omission. ERDAS Imagine software can be used to import reference data and generate accuracy reports to evaluate classification performance.