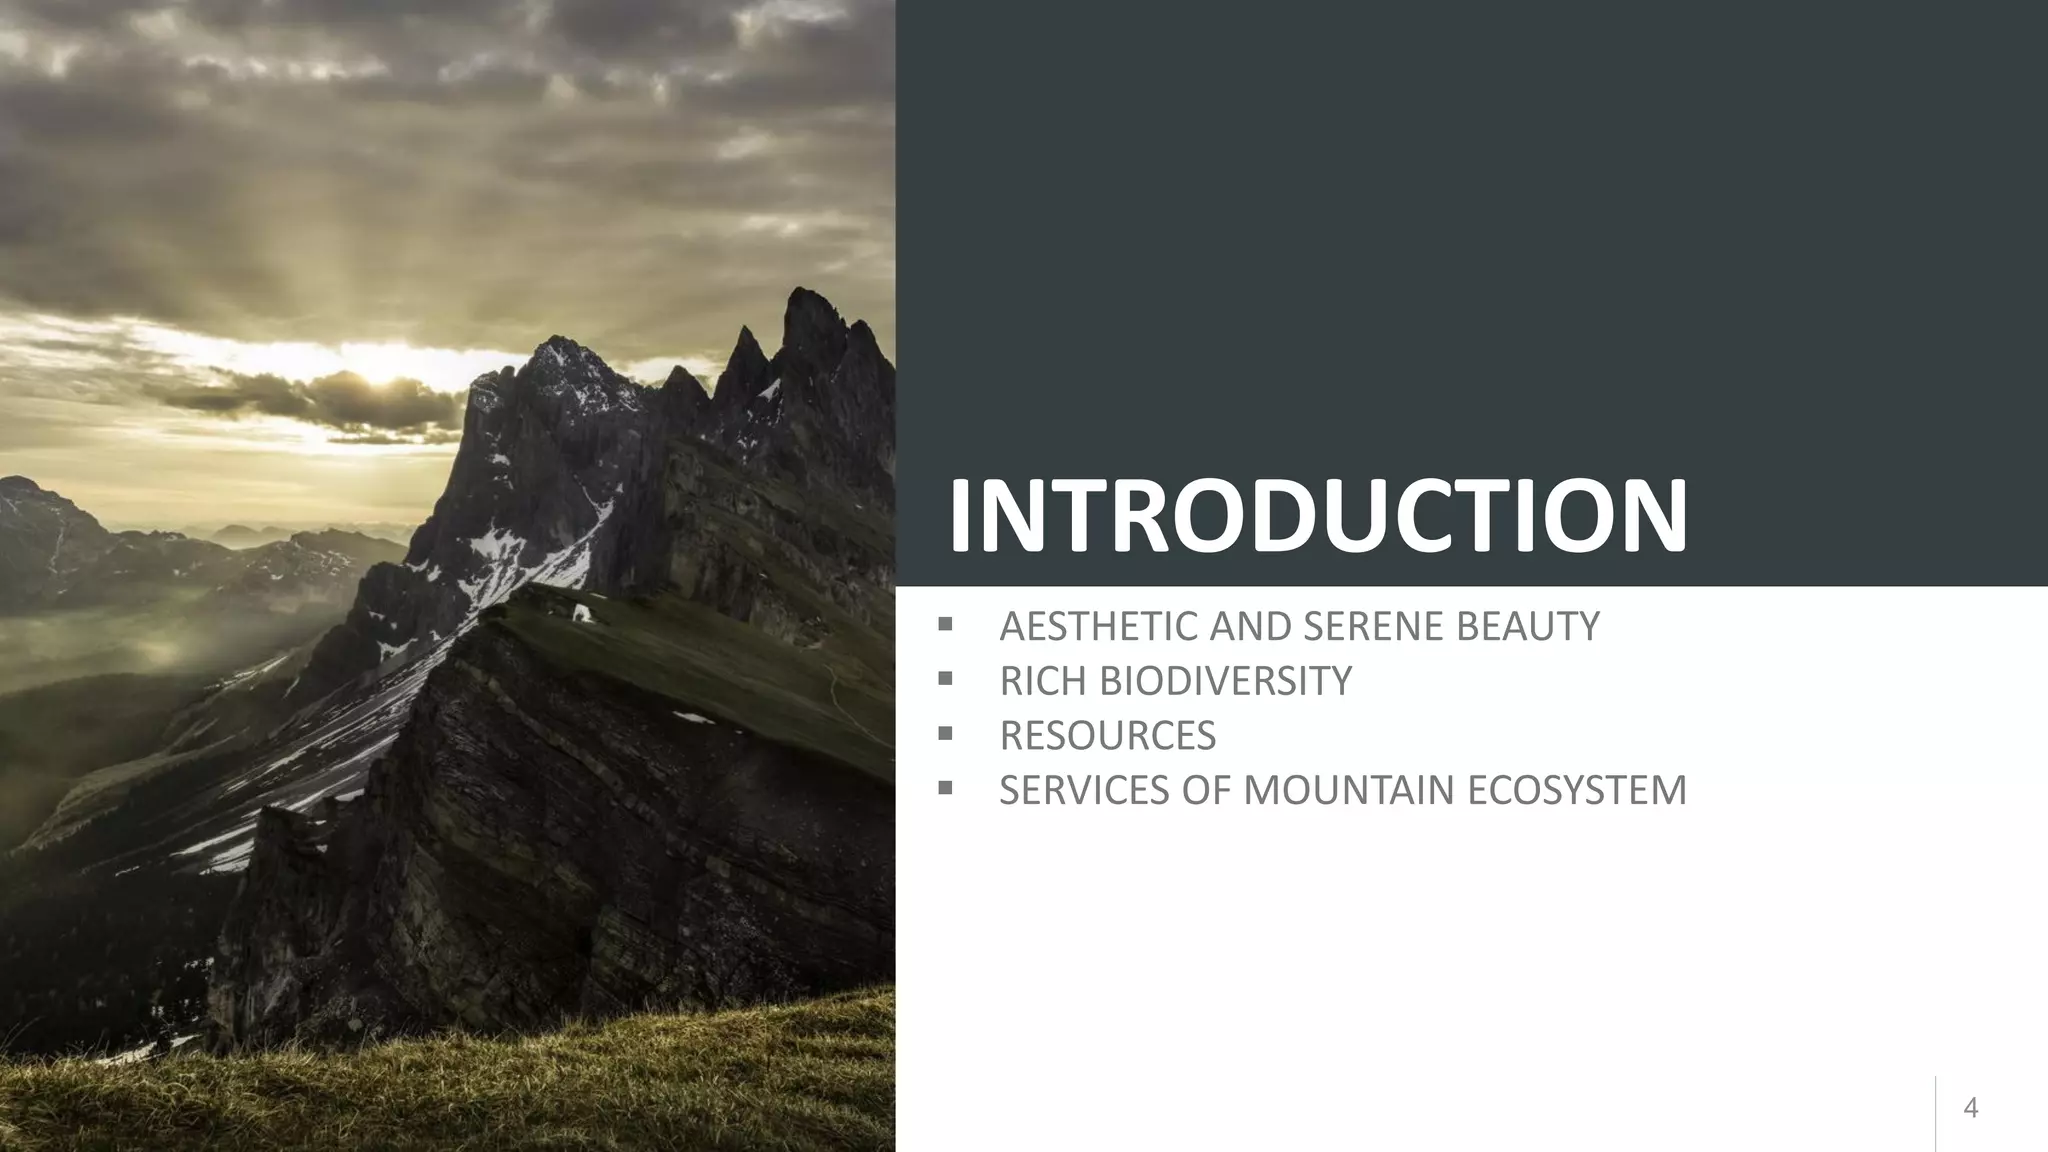
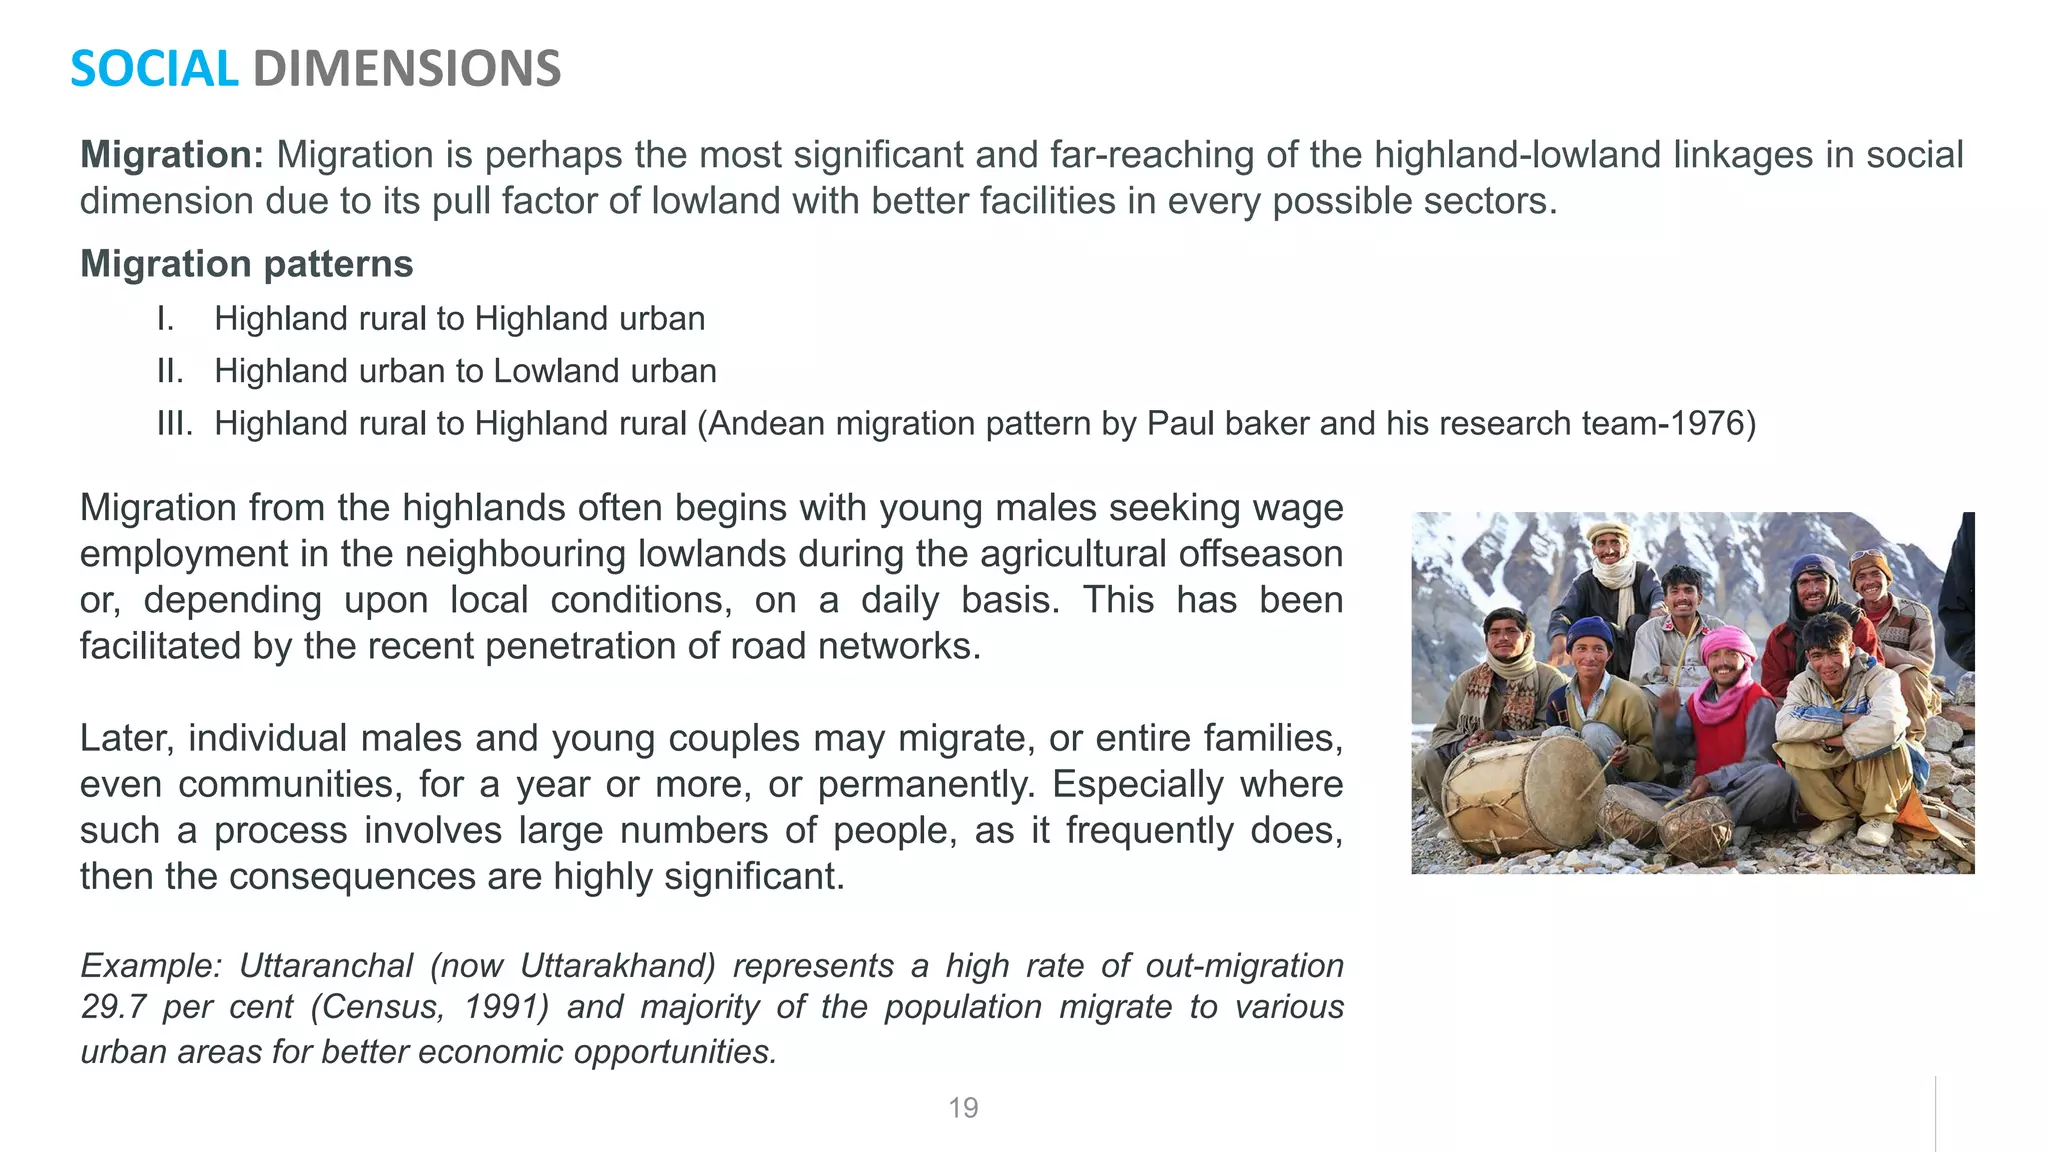
Mountainous regions occupy one-fourth of the world’s terrestrial surface, most rich in diverse landscapes and hold on to the biodiversity and cultural diversity along with supporting 10% of humankind with their direct life support base. Most mountainous regions have been at the far periphery of mainstream societal concerns for a long time. Remote, relatively inaccessible, they were generally pictured as difficulty, unyielding and unprofitable environments. Very less have focused attention on mountainous people and cultures, primitive religion, marginal survival, unusual adaptation to very high altitude, fraternal polyandry to obliterate informed communication and more meaningful analysis in practical sense. Early research concentrated mainly on specialised studies with little cross disciplinary endeavour. During the last few decades there have been spasmodic accounts of the highland and lowland mainly induced by events of great economic or political significance and due to the degradation of highlands which are potential threats to subjacent lowland population centre. Recent developments, expanding highland research and awareness spread by institutions and governments have shone a new ray of light towards the bright future. However, increased awareness with political advocacy must be pursued further.
Hotspots of biodiversity—areas particularly rich in species, rare species,
threatened species, or some combination of these attributes—are increasingly
being delineated to help set priorities for conservation. Only recently have we
begun to test key assumptions that determine how useful a hotspot approach
can be for conservation planning. The evidence suggests that although at large
geographic scales hotspots do provide useful information for conservation
planning, at smaller scales their value may be more limited.
In this ppt i try to explain introduction of land degradation .and also causes of it .and explain with figure . i expect that my ppt usefull to all.THIS PPT use for enviroment also.
Environmental science Module 1 Topic. This PPT is not a work of mine and was provided by our college professor during our graduation, so I am not sure about the original author. The credit goes to the Original author.
The Endangered GlobalCommonsThe Effects of Climate and T.docxcherry686017
The Endangered Global
Commons
The Effects of Climate
and Topography on Air
Pollution
The Effects of Air
Pollution
Air Pollution Control:
Toward a Sustainable
Strategy
Noise: The Forgotten
Pollutant
Indoor Air Pollution
Spotlight on Sustainable
Development 20-1:
Germany's Sustainable
Approach Pays Huge
Dividends
20.1
20.1
20.1
20.1
20.1
20.1
20.1
CHAPTER OUTLINE
CHAPTER 12
I
n the early 1970s, scientists pored over satellite photographs of the
drought-stricken African Sahel, a band of semiarid land that bor-
ders the southern Sahara. One of them noticed an unusually green
patch of land amid the desert. Curious to find out the reason, Norman
MacLeod, an American agronomist, flew to the site. There, surrounded
by newly formed desert, was a privately owned ranch of 100,000 hectares
(250,000 acres). Its grasses grew rich and thick even though vegeta-
tion in the surrounding fields had long since died, leaving the sandy
soil unprotected. Why?
Grasslands, Forests, and
Wilderness: Sustainable
Management StrategiesThe Tragedy of the
Commons
Rangelands and Range
Management: Protecting
the World’s Grasslands
Forests and Forest
Management
Wilderness and Wilderness
Management
Spotlight on Sustainable
Development 12-1: Saving
the World’s Tropical Rain
Forests
Point/Counterpoint:
Controversy over Old-
Growth Forests in the
Pacific Northwest
12.4
12.3
12.2
12.1
Our duty to the whole, including the unborn generations,
bids us restrain an unprincipled present-day minority from
wasting the heritage of these unborn generations.
—Theodore Roosevelt
221
CRITICAL THINKING
Exercise
In a speech to a group of business executives,
one opponent of the U.S. Clean Air Act noted
that natural sources of air pollution such as
volcanoes often exceed human sources. Be-
cause of this he argued that air pollution con-
trol legislation was misguided. He went on to
say that he supported efforts in the U.S. Con-
gress to weaken air pollution legislation be-
cause it was not only unnecessary but also
hurt the economy. Regulations, he claimed,
cost jobs and reduced the nation's productiv-
ity. Analyze this premise, using your critical
thinking skills and your knowledge of air
pollution.
222 PART IV. Resource Issues:
Solution
s for a Sustainable Society
CRITICAL THINKING
Exercise
One of the most dramatic changes on the
planet in the last 2 decades has been the
steady march of the world’s largest desert,
Africa’s Sahara. In the 1970s and 1980s, re-
searchers estimated that the desert spread
southward at a rate of 5 kilometers (3 miles)
per year. They attributed this expansion to
drought, overgrazing, and agricultural land
abuse in the semiarid grasslands bordering
the desert. The 5 km/yr projection, however,
was based primarily on measurements in a few
locations, which researchers assumed were
representative of the entire continent.
Using satellite observations of vegeta-
tion, however, scientists have found that the
Sahara has advanced and retreated—larg ...
Impact of climate change on glaciers_Dr. S.S.Randhawa,State Centre on Climate...India Water Portal
What is climate change and will be its effect the Himalayan glaciers? A look at what are the reasons for concerns, will it lead to more extreme weather events and what the future climate will be like.
Migration Profile of Odisha with focus on BhubaneswarKamlesh Kumar
Migration is one the most important demographic component to determine the size, growth and structure of population of a particular region, besides fertility and mortality. For a large country like India, the study of movement of population in different parts of the country helps in understanding the dynamics of the society and societal change better. Bhubaneswar is one of the magnets for migrants in east India attributing to its exponential growth rates. This is an attempt to map the migration pattern in the city and the state.
Population Projection of Khordha District, ODISHA 2021-51Kamlesh Kumar
Work is based on Walter Isard's methods in a simplistic manner.
1. ARITHMATICAL INCREASE METHOD OF PROJECTION
2. GEOMETRIC INCREASE METHOD
3. INCREMENTAL INCREASE METHOD
DEMOGRAPHIC PROFILE OF CONTINENTAL ODISHAKamlesh Kumar
Although the state is endowed with vast natural resources it has remained on the bottom of the developmental chart of the nation. With such a reserve of natural resources and human resource potential, it is like a hibernating beast which must awake for good. Stealing the limelight of the most favourable smart city, the capital is growing like never before along with a few more cities. Yet the state remains mostly rural and lagging in most aspects except for the coastal regions. My analysis is that the state has not been given its due attention in planning which is the reason for its present backwardness.
‘Fashion’ is a notoriously difficult term to pin down, and it is extremely doubtful whether it is possible to come up with necessary and sufficient conditions for something justifiably to be called ‘fashionable’. Generally speaking, we can distinguish between two main categories in our notion of fashion: one that fashion refers to clothing or that fashion is a general mechanism, logic or ideology that, among other things, applies to the area of clothing.
Adam Smith , who was among the first philosophers to give fashion a central role in his anthropology, claims that fashion applies first and foremost to areas in which taste is
a central concept. This applies in particular to clothes and furniture, but also to music, poetry and architecture. Immanuel Kant provides a description of fashion that focuses on general changes in human lifestyles: ‘All fashions are, by their very concept, mutable ways of living.’
However, trends die quickly and with that comes waste. Clothing produced by fast fashion brands are oftentimes made from cheap materials, like polyester and acrylic, and not built to last: The average American throws away 80 pounds of clothing every year. We’ve been conditioned to believe that buying a garment and wearing it once is justifiable. It’s not. Due to the growing demand in the fast fashion industry, we see a vast overproduction of clothing; for example, the Copenhagen Fashion Summit reports that fashion is responsible for 92 million tons of solid waste dumped in landfills each year. This cultural shift on how we consume clothing is leaving a huge mark on the planet. Fashion has become much more than representation and being covered.
COMMUNAL HARMONY: PUNJABI & TIBETANS IN DELHIKamlesh Kumar
LANDSCAPE AS TEXT
Delhi, the majestic, cosmopolitan, sprawling capital of the nation viewed as one of the global nodes bustling with life in haste. It has maintained its identity as a pluralistic amalgamation with myriads of ethno-religious groups and minority communities. Such is the very famous, our own ‘little Tibet’- Majnu Ka Tila situated at a stone’s throw from the Delhi University North Campus. Officially known as Aruna Nagar Colony is the universal gathering place
for Tibetans living around Delhi and a transit point for the people of the trans-Himalayan range and conversely a gateway to Tibet for the Indians and foreign tourists alike as the capital city enjoys a status of a flourishing educational and political hub.
Tall buildings on either side make the narrow alley so dark it’s as if the sun never makes it here. Shops on either side sell only exotic Tibetan jewellery, Buddhist artefacts and crockery. In this labyrinth of a colony, the stalls are full of copies of branded shoes and clothes, reflecting the latest in fashion trends across Asia. Many of the tiny outlets sell Buddhist curios and Tibetan literature. Ahead, the alley opens into a bright courtyard facing the monastery. Old ladies sit in the sun, making fresh momos and laphing, pancakes rolled with chilli paste. Besides MKT is a Foodie's paradise, the eateries here are not only popular for its momos, but one can also enjoy authentic Tibetan, Chinese and Korean delicacies along with the yummiest of the English pastries.
Majnu Ka Tila not only is limited to Tibetan community but constituted by the Punjabi community as well which has a historical context.
The area provides a microcosm of diversified India where there is invisible transition and diffusion of identity, culture of distinct communities and Indianisation of Tibetan lifestyle.
For instance, many Tibetans who cannot afford the rising rents of the Tibetan enclave (due to hotels and tourist activities) are forced to live in the Punjabi Basti where renting an apartment is cheaper comparatively. Living in Punjabi zone is seen influencing a cultural and identity loss. To diffuse with the Punjabi population is perceived as a risk “of identity loss”, and forgetting your Tibetan culture. These frontiers are mental, social and religious. Nonetheless, the ethnic groups interacting and sharing a space is a matter of pride as community harmony.
An overlay operation is much more than a simple merging of linework; all the attributes of the features taking part in the overlay are carried through. In general, there are two methods for performing overlay analysis—feature overlay (overlaying points, lines, or polygons) and raster overlay. Some types of overlay analysis lend themselves to one or the other of these methods. Overlay analysis to find locations meeting certain criteria is often best done using raster overlay (although you can do it with feature data). Of course, this also depends on whether your data is already stored as features or raster. It may be worthwhile to convert the data from one format to the other to perform the analysis.
Weighted Overlay
Overlays several raster files using a common measurement scale and weights each according to its importance.
The weighted overlay table allows the calculation of a multiple criteria analysis between several raster files.
Raster- The raster of the criteria being weighted.
Influence- The influence of the raster compared to the other criteria as a percentage of 100.
Field- The field of the criteria raster to use for weighting.
Remap- The scaled weights for the criterion.
In addition to numerical values for the scaled weights in Remap, the following options are available:
Restricted- Assigns the restricted value (the minimum value of the evaluation scale set, minus one) to cells in the output, regardless of whether other input raster files have a different scale value set for that cell.
No data - Assigns No Data to cells in the output, regardless of whether other input raster files have a different scale value set for that cell.
THIS PRESENTATION IS TO HELP YOU PERFORM THE TASK STEP BY STEP.
In the context of remote sensing, change detection refers to the process of identifying differences in the state of land features by observing them at different times. This process can be accomplished either manually (i.e., by hand) or with the aid of remote sensing software. Manual interpretation of change from satellite images or aerial photos involves an observer or analyst defining areas of interest and comparing them between images from two dates. This may be accomplished either on-screen (such as in a GIS) or on paper. When analyzing aerial photographs, a stereoscope which allows for two spatially-overlapping photos to be displayed in 3D, can aid photo interpretation. Manual image interpretation works well when assessing change between discrete classes (forest openings, land use and land cover maps) or when changes are large (e.g., heavy mechanized maneuver damage, engineering training impacts). Manual image interpretation is also an option when trying to determine change using images or photos from different sources (comparing historic aerial photographs to current satellite imagery).
Automated methods of remote sensing change detection usually are of two forms: post-classification change detection and image differencing using band ratios. In post-classification change detection, the images from each time period are classified using the same classification scheme into a number of discrete categories like land cover types. The two (or more) classifications are compared and the area that is classified the same or different is tallied. With image differencing, a band ratio such as NDVI is constructed from each input image, and the difference is taken between the band ratios of different times. In the case of differencing NDVI images, positive output values may indicate an increase in vegetation, negative values a decrease in vegetation, and values near zero no change. With either post-classification or image differencing change detection, it is necessary to specify a threshold below which differences between the two images is considered to be non-significant. The specification of thresholds is critical to the results of change detection analysis and usually must be found through an iterative process.
THIS PRESENTATION IS TO HELP YOU PERFORM THE TASK STEP BY STEP.
Accuracy assessment is an important part of any classification project. It compares the classified image to another data source that is considered to be accurate or ground truth data. Ground truth can be collected in the field; however, this is time consuming and expensive. Ground truth data can also be derived from interpreting high-resolution imagery, existing classified imagery, or GIS data layers.
The most common way to assess the accuracy of a classified map is to create a set of random points from the ground truth data and compare that to the classified data in a confusion matrix. Although this is a two-step process, you may need to compare the results of different classification methods or training sites, or you may not have ground truth data and are relying on the same imagery that you used to create the classification. To accommodate these other workflows, this process uses three geoprocessing tools: Create Accuracy Assessment Points, Update Accuracy Assessment Points, and Compute Confusion Matrix.
Thresholding
Thresholding is the process of identifying the pixels in a classified image that are the most likely to be classified incorrectly. These pixels are put into another class (usually class 0). These pixels are identified statistically, based upon the distance measures
that were used in the classification decision rule.
Accuracy Assessment : Error Matrix
Accuracy assessment is a general term for comparing the classification to geographical data that are assumed
to be true, in order to determine the accuracy of the classification process. Usually, the assumed-true data are derived from ground truth data. It is usually not practical to ground truth or otherwise test every pixel of a classified image. Therefore, a set of reference pixels is usually used. Reference pixels are points on the classified image for which actual data are (or will be) known. The reference pixels are randomly selected.
Overall accuracy: Overall accuracy is used to indicate the accuracy of whole classification (i.e. number of correctly classifier pixels divided by the total number of pixels in the error matrix)
User’s accuracy(commission error): User’s accuracy is regarded as the probability that a pixel classified on map actually represents that
class on the ground or reference data
Producer’s accuracy(omission error): Producer’s accuracy represents the probability of reference pixel being correctly classified
THIS PRESENTATION IS TO HELP YOU PERFORM THE TASK STEP BY STEP.
The objective of image classification is to classify each pixel into only one class (crisp or hard classification) or to associate the pixel with many classes (fuzzy or soft classification). The classification techniques may be categorized either on the basis of training process (supervised and unsupervised) or on the basis of theoretical model (parametric and non-parametric).
Unsupervised classification is where the groupings of pixels with common characteristics are based on the software analysis of an image without the user providing sample classes. The computer uses techniques to determine which pixels are related and groups them into classes. The user can specify which algorism the software will use and the desired number of output classes but otherwise does not aid in the classification process. However, the user must have knowledge of the area being classified when the groupings of pixels with common characteristics produced by the computer have to be related to actual features on the ground (such as waterbodies, developed areas, forests, etc.).
Supervised classification is based on the idea that a user can select sample pixels in an image that are representative of specific classes and then direct the image processing software to use these training sites as references for the classification of all other pixels in the image. Input classes are selected based on the knowledge of the user. The user also sets the bounds for how similar other pixels must be to group them together. These bounds are often set based on the spectral characteristics of the input classes (AOI), plus or minus a certain increment (often based on “brightness” or strength of reflection in specific spectral bands). The user also designates the number of classes that the image is classified into.
THIS PRESENTATION IS TO HELP YOU PERFORM THE TASK STEP BY STEP.
Interpolation is the process of using points with known values to estimate values at other unknown points. It can be used to predict unknown values for any geographic point data, such as elevation, rainfall, noise levels, atmospheric components and so on.
The Inverse Distance Weighting (IDW) assumes each input point to have a local influence that diminishes with distance. It assumes that closer things are more alike than those that are farther apart. It weights the points closer to the processing cell greater than those further away. A specified number of points, or all points within a specified radius can be used to determine the output value of each location. To predict a value for any unmeasured location, IDW will use the measured values surrounding the prediction location. Those measured values closest to the prediction location will have more influence on the predicted value than those farther away.
Spline estimates values using a mathematical function that minimizes overall surface curvature, resulting in a smooth surface that passes exactly through the input points. This method is best for gently varying surfaces, such as elevation, water table heights, or pollution concentrations. A Regularized method creates a smooth, gradually changing surface with values that may lie outside the sample data range.
Kriging is a geostatistical interpolation technique that considers both the distance and the degree of variation between known data points when estimating values in unknown areas. Kriging assumes that the distance or direction between sample points reflects a spatial correlation that can be used to explain variation in the surface. The Kriging tool fits a mathematical function to a specified number of points, or all points within a specified radius, to determine the output value for each location. Kriging is a multistep process; it includes exploratory statistical analysis of the data, variogram modeling, creating the surface, and (optionally) exploring a variance surface. Kriging is most appropriate when you know there is a spatially correlated distance or directional bias in the data. It is often used in soil science and geology.
Trend is a statistical method that finds the surface that fits the sample points using a least-square regression fit. It fits one polynomial equation to the entire surface. This results in a surface that minimizes surface variance in relation to the input values. The surface is constructed so that for every input point, the total of the differences between the actual values and the estimated values (i.e., the variance) will be as small as possible.
THIS PRESENTATION IS TO HELP YOU PERFORM THE TASK STEP BY STEP.
Raster data is commonly obtained by scanning maps or collecting aerial photographs and satellite images. Scanned map datasets don't normally contain spatial reference information (either embedded in the file or as a separate file). With aerial photography and satellite imagery, sometimes the location information delivered with them is inadequate, and the data does not align properly with other data one has. Thus, to use some raster datasets in conjunction with other spatial data, we need to align or georeference them to a map coordinate system. A map coordinate system is defined using a map projection (a method by which the curved surface of the earth is portrayed on a flat surface). Georeferencing a raster data defines its location using map coordinates and assigns the coordinate system of the data frame. Georeferencing raster data allows it to be viewed, queried, and analyzed with other geographic data.
Generally, we georeference raster data using existing spatial data (target data)—such as georeferenced rasters or a vector feature class—that resides in the desired map coordinate system. The process involves identifying a series of ground control points—known x,y coordinates—that link locations on the raster dataset with locations in the spatially referenced data (target data). Control points are locations that can be accurately identified on the raster dataset and in real-world coordinates. Many different types of features can be used as identifiable locations, such as road or stream intersections, the mouth of a stream, rock outcrops, the end of a jetty of land, the corner of an established field, street corners, or the intersection of two hedgerows. The control points are used to build a polynomial transformation that will shift the raster dataset from its existing location to the spatially correct location. The connection between one control point on the raster dataset (the from point) and the corresponding control point on the aligned target data (the to point) is a link.
Finally, the georeferenced raster file can be exported for further usage.
THIS PRESENTATION IS TO HELP YOU PERFORM THE TASK STEP BY STEP.
With increasing use of remote sensing, the need for crispier, accurate and enhanced precision has deemed to the improvement in the spectral and spatial resolution of remotely sensed imagery. For most of the systems, panchromatic images typically have higher resolution, while multispectral images offer information in several spectral channels. Resolution merge (also called pan-sharpening) allows us to combine advantages of both kinds of images by merging them into one.
The resolution merge or pan sharpening is the technique used to obtain high resolution multi-spectral images. The color information is collected from the coarse resolution satellite data and the intensity from the high resolution satellite data.
The main constraint is to preserve the spectral information for aspects like land use. Saving theimage from distortion of the spectral characteristics is important in the merged dataset.
The most common techniques for spatial enhancement of low-resolution imagery combining high and low resolution data can be used are: Intensity-Hue-Saturation, Principal Component, Multiplicative and Brovey Transform.
THIS PRESENTATION IS TO HELP YOU PERFORM THE TASK STEP BY STEP.
Remote Sensing: Normalized Difference Vegetation Index (NDVI)Kamlesh Kumar
The Normalized Difference Vegetation Index (NDVI) is a numerical indicator that uses the visible and near-infrared (NIR) bands of the electromagnetic spectrum to analyze whether the target (image) being observed contains green vegetation or not. Healthy vegetation (chlorophyll) reflects more near-infrared (NIR) and green light compared to other wavelengths. But it absorbs more red and blue light. This is why our eyes see vegetation as the colour green. If we could see near-infrared, then it would be strong for vegetation too.
It is basically measured through the use of Intensity, Hue and saturation of an image and through pixels as well.
The density of vegetation (NDVI) at a certain point on the image is equal to the difference in the intensities of reflected light in the red and infrared range divided by the sum of these intensities.
푁퐷푉퐼=((푁퐼푅−푅퐸퐷))/((푁퐼푅+푅퐸퐷))
The result of this formula generates a value between -1 and +1. If you have low reflectance (low values) in the red band and high reflectance in the NIR, this will yield a high NDVI value. And vice versa.
Remote Sensing: Principal Component AnalysisKamlesh Kumar
Principal components analysis is a orthogonal transformational technique (preserving the symmetry between vectors and angles) to reveal new set of data arguably better from the original data set and better capture the essential information as well. It happens often that some variables are highly correlated with a lot of duplication. Instead of discarding the redundant data, principal components analysis condenses the info. in inter-correlated variables into a few variables, called principal components.
The main idea of Principal Component Analysis (PCA) is to reduce the dimensionality of a data set consisting of many variables correlated with each other, either heavily or lightly, while retaining the variation present in the dataset, up to the maximum extent.
THIS PRESENTATION IS TO HELP YOU PERFORM THE TASK STEP BY STEP.
The advantage of digital imagery is that it allows us to manipulate the digital pixel values in the image. Even after the radiometric corrections image may still not be optimized for visual interpretation. An image 'enhancement' is basically anything that makes it easier or better to visually interpret. An enhancement is performed for a specific application as well. This enhancement may be inappropriate for another purpose, which would demand a different type of enhancement.
Filtering is used to enhance the appearance of an image. Spatial filters are designed to highlight or suppress specific features in an image based on their spatial frequency. ‘Rough’ textured areas of an image, where the changes in tone are abrupt, have high spatial frequencies, while ‘smooth’ areas with little variation have low spatial frequencies. A common filtering procedure involves moving a ‘matrix' of a few pixels in dimension (ie. 3x3, 5x5, etc.) over each pixel in the image, using mathematical calculation and replacing the central pixel with the new value.
A low-pass filter is designed to emphasize larger, homogeneous areas of similar tone and reduce the smaller detail in an image. Thus, low-pass filters generally serve to smooth the appearance of an image. In some cases, like 'low-pass filtering', the enhanced image can actually look worse than the original, but such an enhancement was likely performed to help the interpreter see low spatial frequency features among the usual high frequency clutter found in an image. High-pass filters do the opposite and serve to sharpen the appearance of fine detail in an image. Directional, or edge detection filters are designed to highlight linear features, such as roads or field boundaries. These filters can also be designed to enhance features which are oriented in specific directions.
THIS PRESENTATION IS TO HELP YOU PERFORM THE TASK STEP BY STEP.
Water is hydrosphere is made up of all the water on Earth. This includes all of the rivers, lakes, streams, oceans, groundwater, polar ice caps, glaciers and moisture in the air (like rain and snow). The hydrosphere is found on the surface of Earth, but also extends down several miles below, as well as several miles up into the atmosphere. So, there is a need for study of water as a scarce resource.
WHAT IS HYDROLOGICAL CYCLE
SYSTEM APPROACH IN HYDROLOGY
HYDROLOGIC INPUT & OUTPUT
VARIATION IN HYDROLOGICAL CYCLE
COMPONENTS
EVAPORATION
EVAPOTRANSPIRATION
PRECIPITATION
INTERCEPTION
INFILTRATION
GROUND WATER
RUN-OFF
HUMAN IMPACT
EARTH SURFACE
CLIMATE CHANGE
ATMOSPHERIC POLLUTION
MULTI PURPOSE PROJECTS
WATER WITHDRAWAL
MANAGEMENT AND CONTROL
An assessment on the temperate ecosystem with the following sub headings:
Geological evolution: Location and Extent
Atmospheric changes
Hydrological Changes
Land Degradation
Biodiversity Loss
Challenges to Human Community
Geosystem Approach: El Nino Southern Oscillation EffectsKamlesh Kumar
Earth system as a whole is very complex and dynamic, for that matter we prepare models to represent the functioning linkages and processes for better understanding. However, the geo-systems can not be summed up in just one model. Hence, we use system analysis approach, if we see Earth as a giant system, there're many sub-systems for better comprehension representing only a particular component of the system.
Here, I've tried to cover the geo-system approach siting a globe affecting example of the El Nino Southern Oscillation (ENSO) phenomena.
This report is detailed study of the research conducted in Kirori Mal College. The basic objective of this report is to get a tough insight in the use of research techniques. Geography, being a field science, a geographical enquiry always need to been supplemented through well planned Research. Research is an essential component of geographic enquire. It is a basic procedure to understand the earth as a home of humankind. Disaster management is an inseparable part of the discipline especially which deals with the study of natural phenomena. This research focuses upon the FIRE safety plan of the institution. It is carried out through observation, sketching, measurement, interviews, etc. The Research facilitate the collection of local level information that is not available through secondary sources.
In this report, various methodologies have been employed such as my, measurement and interviewing, photographing, examining, the collection and gathering of information at different corners of the institution and later, tabulating and computing them is an important part of the field work.
Furthermore, the research report has been prepared in concise form alongside with maps and diagrams for giving visual impressions. Moreover, it contains all the details of the procedures followed, methods, tools and techniques employed.
Disaster Prevention & Preparedness: Earthquake in NepalKamlesh Kumar
This report is detailed study of the field survey conducted in Kathmandu and Sindhupalchowk in Nepal on the earthquake disaster. The basic objective of this report is to get a tough insight in the use of field techniques regarding disaster management. Geography deals with human interaction with nature. This phenomenon can be better understood through field studies. Geography, being a field science, a geographical enquiry always need to be supplemented through well planned field surveys. Field is an essential component of geographic enquire. It is a basic procedure to understand the earth as a home of humankind. It is carried out through observation, sketching, measurement, interviews, etc. Field work takes the children out of the class and enables them to better understand the subject by visiting the areas practically giving an insight into the social, cultural and economic lives of the people. This also adds up the advantage of visiting the grass root levels of the society and ameliorative comprehension of the GLOCAL lives. It also has instilled various research making techniques in the budding geographers and shaping their thinking perspectives. The field surveys facilitate the collection of local level information that is not available through secondary sources.
In this report, various methodologies have been employed such as mapping, digitization, measurement and interviewing (questionnaires designing), the collection and gathering of information at the local level by conducting primary surveys and later, tabulating and computing them is an important part of the field survey.
Furthermore, the field study report has been prepared in concise form alongside with maps and diagrams for giving visual impressions. Moreover, it contains all the details of the procedures followed, methods, tools and techniques employed and the modern technology of navigation, satellite connections, GIS software have been very helpful in the pre-field drills.
The report has the following headings and sub-headings:
Introduction
Study area
Transit: Table & Maps
Disaster scenario of Nepal
Earthquake: Timeline
Causes
Impact
Who is helping Nepal?
Reconstruction and Rehabilitation Status
Objectives & Methodology
Literature review
Data representation and Analysis
Findings and Suggestions
Conclusions
The French Revolution, which began in 1789, was a period of radical social and political upheaval in France. It marked the decline of absolute monarchies, the rise of secular and democratic republics, and the eventual rise of Napoleon Bonaparte. This revolutionary period is crucial in understanding the transition from feudalism to modernity in Europe.
For more information, visit-www.vavaclasses.com
How to Make a Field invisible in Odoo 17Celine George
It is possible to hide or invisible some fields in odoo. Commonly using “invisible” attribute in the field definition to invisible the fields. This slide will show how to make a field invisible in odoo 17.
How to Split Bills in the Odoo 17 POS ModuleCeline George
Bills have a main role in point of sale procedure. It will help to track sales, handling payments and giving receipts to customers. Bill splitting also has an important role in POS. For example, If some friends come together for dinner and if they want to divide the bill then it is possible by POS bill splitting. This slide will show how to split bills in odoo 17 POS.
Read| The latest issue of The Challenger is here! We are thrilled to announce that our school paper has qualified for the NATIONAL SCHOOLS PRESS CONFERENCE (NSPC) 2024. Thank you for your unwavering support and trust. Dive into the stories that made us stand out!
Operation “Blue Star” is the only event in the history of Independent India where the state went into war with its own people. Even after about 40 years it is not clear if it was culmination of states anger over people of the region, a political game of power or start of dictatorial chapter in the democratic setup.
The people of Punjab felt alienated from main stream due to denial of their just demands during a long democratic struggle since independence. As it happen all over the word, it led to militant struggle with great loss of lives of military, police and civilian personnel. Killing of Indira Gandhi and massacre of innocent Sikhs in Delhi and other India cities was also associated with this movement.
Model Attribute Check Company Auto PropertyCeline George
In Odoo, the multi-company feature allows you to manage multiple companies within a single Odoo database instance. Each company can have its own configurations while still sharing common resources such as products, customers, and suppliers.
3. CONTENTS
1 A. AestheticandSerenebeauty
B. RichBiodiversity
C. Resources
D. Services of Mountain
ecosystem
Introduction
2
A. Mountain Environment
Degradation
Theory
3
A. Dimensions
Highland & Lowland:
concept
4 A. Global initiatives
B. SWOT analysis
C. Challenges
Sustainable Mountain
Development
6
A. Reference
Conclusion
5 Recommendations for
mountain development
5. 5
a) The ecosystem of the mountains.
b) Strongly affected by climate, which gets colder as elevation increases.
c) Stratified according to elevation:
• Higher altitude: Harsh environmental condition; Treeless alpine
vegetation.
• Moderate Altitude: Dense forests.
• Lower Slope: Montane forests, tropical or temperate forest, savanna,
scrubland, desert, tundra etc.
d) Mountains cover 24% of the Earth’s land surface. They are home to
12% of the world’s population and another 14% of the population
reside in their immediate proximity.
e) They provide vital goods and services -particularly freshwater.
f) Mountains are key centers of biological and cultural diversity as well
important sites of traditional ecological knowledge and influence the
climate at many scales.
g) Fresh air
h) Traditional Zoogeographic region are mountain ranges.
i) Tourism.
MOUNTAIN ECOSYSTEM
6. 6
a) Aesthetic and Serene beauty
• Mountains cover approximately one fourth of the world's surface.
• The lustful green trees of the mountains.
• Alpine grassland covered with snow.
• The world’s mountains encompass some of the most spectacular landscapes, a
great diversity of species and habitat types, and distinctive human communities.
b) Rich Biodiversity
• Mountain ranges are home to some of the greatest regions of biodiversity on the
planet.
• The Sierra Nevada mountain range alone is estimated to house from 10,000 to
15,000 separate species of plants and animals.
• Mountain biodiversity plays a key role in the support of global environmental,
economic, social and cultural sectors through connections to; invasive species, air
pollution, climate change, mining, hydropower, tourism, forests, agriculture.
• Mountains are hot spots of biodiversity.
• The plants and animals found in mountainous areas will vary depending upon the
location of the biome :
I. Temperate zone mountains
II. Tropical mountains
III. Desert mountains
CHARACTERISTICS OF MOUNTAIN ECOSYSTEM
7. 7
a) Temperate zone mountains
• Mountains in the temperate zone, such as the Rocky Mountains in
Colorado generally have four distinct seasons.
• They usually have conifer trees on their lower slopes that fade into
alpine vegetation (such as lupines and daisies,) above the tree line.
• Fauna include deer, bears, wolves, mountain lions, squirrels, rabbits,
and a wide variety of birds, fish, reptiles, and amphibians.
b) Tropical mountains
• Tropical areas are known for their species diversity.
• Tropical mountains may be populated by evergreen trees, grasses,
heathers, and shrubs.
• Thousands of animals like gorillas of Central Africa to the jaguars of
South America make their homes in tropical mountain areas.
c) Desert mountains
a) The harsh climate of a desert landscape - lack of rain, high winds, and
little to no soil, makes it difficult for any plant to take root. But some,
such as cacti and certain ferns are found.
b) Animals such as big horned sheep, bobcats, and coyotes are well
adapted to live in these harsh conditions.
8. 8
a) There is abundance of resources in the mountain ecosystem.
b) Mountain forests are main provider of timber and fuelwood.
c) Genetic resources are considered as being of key importance in
mountain ecosystems.
d) Mountains are important as centres of crop diversity.
e) Lowland people also depend on mountain environments for a wide
range of goods and services, and opportunities for recreation and
spiritual renewal. Mountains provide for the freshwater needs.
f) Mountain water is also a source of hydroelectric power most of
which are used by the lowland.
g) Minerals in HIMALAYAS:
• Igneous: granite, diorite, gabbro, tonalite, monazite and pegmatite etc.
• Sedimentary: marl, dolomite, greywacke, siltstone, shale and
limestone, fossils etc.
• Metamorphic: schist, migmatite, phyllite, gneiss, amphibolite, Quartzite
etc.
RESOURCES
9. 9
Ecosystem services- Ecosystem services are the many and varied benefits
that human freely gain from the natural environment and from properly
functioning ecosystem.
Mountain ecosystem services are divided into four categories:
▪ Provisioning Services: These services are the product directly obtain from
ecosystem.
a) Extracting resources for example water for drinking, irrigation, timber and so on.
b) Agricultural production
c) Medicinal plants and pharmaceutical
d) Non timber forest product
e) Genetic resources
▪ Regulating services: Benefits obtain from regulation of ecosystem
processes.
a) Climate regulation
b) Disease regulation
c) Water regulation
d) Water purification
e) Biodiversity
SERVICES OF MOUNTAIN ECOSYSTEM
10. 10
▪ Cultural services: Non material benefits obtain from mountain
ecosystem.
a) Spiritual and religious
b) Recreational and ecotourism
c) Aesthetic
d) Inspirational
e) Educational
f) Sense of place
g) Cultural heritage
h) Migration
▪ Supporting services: Services necessary for the production of all
other ecosystem services.
a) Soil formation
b) Nutrients cycle
c) Primary production
12. 12
There is a growing alarm about the rapid deterioration about the
Himalayan Environment over the past 3 decades or so.
These physical, human, socio-economic, and political processes are
frequently linked together into a gigantic cause and effect network
which is claimed to be pushing both the Himalayas and the northern
plains of the Indian-subcontinent collapse.
Theory of Himalayan Environmental Degradation seeks a fuller
understanding the dynamics of the Himalayan region. It is also
intended to demonstrate the need for a much broader and deeper
perspective of the problems facing the Himalayan region as a
prerequisite for the development of more effective solution.
Thus, we will begin with a synoptic response to the question- what is
the nature of the perceived crisis.
THEORY OF HIMALAYAN ENVIRONMENTAL DEGRADATION
13. 13
This theory basically characterizes the wider region:
1. Following the introduction of the modern health care, medicine, and malaria post 1950, giving way to an
unprecedented wave of population growth.
2. This veritable population explosion is augmented by uncounted and uncontrolled immigration from
neighboring lowlands. Furthermore, leading to rapidly increasing demands for fuel wood, construction timber,
fodder (the domestic animal population has undergone a parallel, or even greater, increase to that of the
human population), and agricultural land on which to grow food due to less developed infrastructure and
transportation systems.
3. The next step in what has been described as a vicious circle, is that the needs of the burgeoning
subsistence population are exerting increasing pressures on the forest cover. This has led to massive
deforestation.
4. The deforestation, which includes the cutting of agricultural terraces on steeper and more marginal
mountain slopes, has led to a catastrophic increase in soil erosion and loss of productive land through
accelerated landslide incidence, and to the disruption of the normal hydrological cycle.
5. This situation, in turn, has led to increased run-off during the summer monsoon and increases in disastrous
flooding and massive siltation in the plains, and lower water levels and the drying up of springs and wells
during the dry season. Related ills are: rapid siltation of reservoirs; abrupt changes in the courses of rivers;
spread of barren sand and gravel across rich agricultural land on the plains; and increased incidence of
disease in downstream areas.
THE THEORY
14. 14
6. The increased sediment load of the rivers emanating from the Himalayan system is extending the
Ganges and Brahmaputra delta and causing islands to form in the Bay of Bengal.
7. The continued loss of agricultural land in the mountains leads to another round of deforestation to enable
the construction of more terraces on which to grow subsistence crops. Yet, as the labor of walking greater
distances from the village to fuelwood supplies increases with the receding forest perimeter, a critical
threshold is reached whereby the available human energy (principally female) becomes progressively
overtaxed and an increasing quantity of animal dung is used for fuel.
8. Consequently, another vicious circle is linked to the first one: terraced soils are deprived of natural
fertilizer- the animal dung now being used for fuel, thus depriving the agricultural terraces, in many
instances, of their only source of fertilizer. This lowers crop yields. Also, the ensuing weakened soil structure
further augments the incidence of landslides. Even more trees are cut on more marginal and steeper slopes
to make room for more agricultural terraces to feed the ever-growing subsistence population.
It follows from this brief exposition of the Theory of Himalayan Environmental Degradation that a series of
linked vicious circles is envisaged as operating inexorably to drive a downward spiral.
16. 16
The terms ‘highlands’ and ‘lowlands’ are loosely defined: ‘highlands’
as synonymous with ‘mountains’ and, therefore, ‘lowlands’ as those
areas beyond and beneath the mountains that are influenced by
down-slope physical processes and by human relationships linking
the two.
Why do we need to study the highland and lowland interaction?
It is this biological and cultural endemism that is one of the reasons
for much of the current growth of lowland interest in mountain areas.
Dimensions: The interaction between highland and lowland are
mainly divided into four major dimensions
1. Ecological
2. Social
3. Economical
4. Political
HIGHLAND AND LOWLAND INTERACTION
17. 17
ECOLOGICAL DIMENSIONS
Mountains cover 24% of the Earth’s land surface. They are
home to 12% of the world’s population and another 14% of the
population reside in their immediate proximity.
They provide vital goods and services -particularly freshwater -
to a significant proportion of humanity.
No other mountain system in the world has affected the lives of
the people and shaped the destiny of the nation, as the
Himalayas.
The Himalayas are actually called the body and soul of India.
The Northern Mountains are important due to the following
reasons.
18. 18
▪ Source of Rivers: Enough rainfall and vast snow-fields in these
mountains are the source of perennial rivers for the lowlands. The
melting snow provides enough water during the dry season.
▪ Fertile Soils: In the course of their flow, the rivers and their tributaries
bring with them large amount of alluvium. When deposited, these
sediments provide extremely fertile soil in the Northern Plains which
have a positive impact in lowland. Thus, it is said that the northern
plains of India are the Gift of the Himalayas.
▪ Hydroelectricity: The Rivers and their tributaries make several natural
waterfalls in the Northern Mountains. These are the sites, where dams
can be constructed across the river for producing hydroelectricity.
Example: Tehri Dam
▪ Forest Wealth: The lower slopes of the Northern Mountains are thickly
forested. Trees vary from tropical to the alpine types. These forests
provide fuel, wood, timber and raw materials for various industries.
▪ Agriculture: The slopes of the mountains have been terraced to
produce rice, maize, potatoes, vegetables and fruits. Tea plantations
are extensively developed on the lower slopes, especially in the
Eastern Himalayas.
Example: Apple cultivation in Himachal region.
19. 19
Migration: Migration is perhaps the most significant and far-reaching of the highland-lowland linkages in social
dimension due to its pull factor of lowland with better facilities in every possible sectors.
Migration patterns
I. Highland rural to Highland urban
II. Highland urban to Lowland urban
III. Highland rural to Highland rural (Andean migration pattern by Paul baker and his research team-1976)
SOCIAL DIMENSIONS
Migration from the highlands often begins with young males seeking wage
employment in the neighbouring lowlands during the agricultural offseason
or, depending upon local conditions, on a daily basis. This has been
facilitated by the recent penetration of road networks.
Later, individual males and young couples may migrate, or entire families,
even communities, for a year or more, or permanently. Especially where
such a process involves large numbers of people, as it frequently does,
then the consequences are highly significant.
Example: Uttaranchal (now Uttarakhand) represents a high rate of out-migration
29.7 per cent (Census, 1991) and majority of the population migrate to various
urban areas for better economic opportunities.
20. 20
Tourism and Transfer of Economic Costs and Benefits
The development of tourism has been an accelerating world-wide
phenomenon since the 1950s. It is majorly depended upon the growth in
rapid transportation links; it has also served as a driving force for such
growth, a self-reinforcing process.
Two primary areas of tourist destination have come to dominate: seaside
and mountain. Tourism is frequently claimed as the world’s largest
industry, employing over 200 million people in the early 1990s -- a tenth
of the world’s workforce -- and ensuring a cash flow of US $ 3.4 trillion.
These figures are expected to double within the next decade (World
Travel and Tourism Council, 1995).
ECONOMIC DIMENSIONS
Tourism has also developed its own series of specializations: general mass tourism; eco-tourism,
adventure tourism, culture tourism, and even specialities such as group tours to view butterflies or to
photograph a single rare species of animal and the sacred sites of the Himalaya; Mount Kailas.
Uncontrolled tourism can also have a negative impact of mountain ecosystem so it can also have a
negative impact to highland and lowland interaction.
21. 21
Environmental Resources: Transfer of Economic Costs and Benefits
Throughout human history, transfers of peoples and two-way cost-benefit
exchanges between lowlands and highlands have persisted. These traditional
forms of interaction have involved primarily contractually-shared access to
renewable natural resources. The prime example is seasonal transfer of
domestic animals from winter grazing at low elevations to high-altitude summer
pastures.
JONBEEL MELA : if you thought the barter system is a thing of the past, you are
mistaken. In Assam one can still find it in vogue at the Jonbeel mela in Morigaon where
people from the plains and the hills barter goods, according to their needs.
In the three day long festival the people from hills brings spices, herbs, ginger, fruits to
exchange them with rice, fish, cakes and other stuff which do not grow in hills.
Technology transfer: This element of highland-lowland interaction tends to be
predominantly from lowland to highland in form. There has been a concerted
effort to ensure transfer of technology in the form of small-scale ‘appropriate’
additions to mountain living. Part of the objective has been to reduce pressure
on local forests, for instance, by introduction of wind and solar energy
generators, mini-hydroelectric plants, and passive solar housing construction
and, at lower elevations, biogas plants.
22. 22
The political elements of highland-lowland interaction are worldwide in
importance and the most significant factor is military power. They also
have serious social, economic, and environmental repercussions.
Like for example Kashmir issue such marginal mountain areas remain
‘hot-spots’ of political tension, including the entire length of the Himalaya
and Karakorum.
Central to many of the political and military aspects of highland-lowland
interactions are three overarching themes.
a) The first is the concept of mountains as niches for minority
peoples (ethnicity and conflict).
b) The second, which is closely related, is the concept of mountains
as last frontiers (migration and conflict).
c) A third theme, mountains as enclaves of poverty (marginalization
and conflict).
POLITICAL DIMENSIONS
24. 24
The concept of sustainable development was introduced in the World Conservation
Strategy in which later in 1980s, it became more popular through the report of the
World Commission on Environment and Development or “Brudtland Report”, where
in Our Common Future defined it as “development that meets the needs of the
present without compromising the ability of the future generations to meet their own
need”.
Why Mountain?
Mountain is the important source of all biological resources and which is useful for
purposeful activities like-agriculture, mining, recreational activities, etc.
Mountain environment are essential fro future global ecosystem.
SUSTAINABLE MOUNTAIN DEVELOPMENT
25. 25
Rio World Summit ’92: Chapter 13 of Agenda 21 entitled “Managing Fragile Ecosystem Sustainable
Mountain Development” which includes two” Programme areas” :
a) Generating and strengthening knowledge about the ecology and sustainable development of mountain
ecosystems.
b) Promoting integrated watershed development and alternative livelihood opportunities.
Spread awareness towards the pressing issues in highlands:
a) Water shortage and hydroelectricity demand
b) Media diffusion wars concentrated in mountainous region
c) Mismanagement of mountain environment
d) Alarming global climate warming more prone in the region
UNESCO’s Man and the Biosphere (MAB) Programme in mountain areas
a) The MAB prog. Is an interdisciplinary undertaking of environmental research.
b) It was launched in 1972and its based on rational use and conservation of the resources of the biosphere and
global improvement relationship between people and the environment.
c) Since it requires studies of both social sciences and natural sciences, and thus name of the Programme came
to be known as “Man and the Biosphere”.
26. 26
MaB prog. Studies the following factors:
a) Human settlements at higher altitudes
b) Effects of land use alternatives on mountain ecosystems.
c) Impact of large-scale technology on mountain ecosystem
d) Effects on tourism and recreation on mountain ecosystem
Studies Regional issues:
a) Resource development and human settlements in high tropical mountains
b) Tourism, technology and land use in temperate mountains in the middle latitudes- winter and
summer seasons;
c) Land-use and problems in high latitudes mountain and tundra ecosystems: in reference to grazing,
industrial development and recreation.
Therefore, UNESCO- MAB initiative which will base environmental conservation on
traditional beliefs and cultural values:
a) It gave emphasis to save natural sacred sites especially plants and wildlife.
b) It also offers interdisciplinary research opportunities for environmental scientists and anthropologists
to save sacred sites of mountain areas of Africa, Asia and Latin America.
27. 27
RECENT GLOBAL INITIATIVES ON GLACIAL MOUNTAIN
To monitor the glacier from melting by taking initiatives together by mountain communities, scientists
and policy makers worldwide- especially Andes of Peru and Himalayas of Nepal.
Various workshops held:
▪ Adopting to a world without glaciers held Lima and Huaraz, Oeru in July 2009
▪ Andean-Asian Mountains Global Knowledge Exchange on Glaciers, Glacial lakes, water and Hazard
Management held in Mt.Everest region of Nepal in September 2011.
▪ “Glacial Flooding and Disaster Risk Management: Knowledge Exchange and Field Training” held in
Huaraz, Peru in July 2013.
28. 28
INDIA
Indian Himalayan region (IHR) tourism has experienced continuous growth and are reason for fastest growing
economic sectors of India.
Prediction of its growth for this sector which is expected upto 7.9% from 2013-23.
One of the good examples’ for IHR, Ladakh which experienced highest tourism attraction, which was once
used to be a remotest place.
India ranks 3rd among fastest growing tourism industry over the next decade.
India also has a large medical tourism sector which is expected to grow at an estimated rate of 30% annually
to reach about ₹95 billion by 2015.
According to UN, issues such as climate, resource management, reduction of poverty and growth in tourism
development.
Sustainable developmental goals, recognizes 17 goal plan of action for people- among which goal 8 and 12
includes mountain tourism especially.
▪ Goal 8: Promotion of “Sustained inclusive and sustainable economic growth’’, full and productive employment and
decent work for all includes as taget 8.9. “By 2030, devise and implement policies to promote sustainable tourism
that creates jobs and promotes local cultures”.
▪ Goal 12: “Ensure sustainable consumption and production patterns” includes as target 12B to Develop and
implement tools to monitor sustainable development impacts for sustainable tourism which creates job, promotes
local culture and products”.
29. 29
Since with increasing tourism also increasing concerns and risks
associated with tourism development and loss of ecological values and
cultural heritage in IHR demand:
a) Minimizing the negative impacts of tourism on communities and the
environment.
b) Maximizing tourism’s positive and creative contribution to IHR local
economies, conservation of natural and cultural heritage
c) Maximize quality of life of visitors.
d) Increase opportunities and innovative actions to make tourism sustainable.
Therefore, national level consultation on 7 April 2017, NITI Aayog, in
association with some key national institutions and International center for
Integrated Mountain Development (ICIMOD) set up on Acton Agenda for
“Sustainable Development of Mountains of Indian Himalayan Region” in
which “Sustainable Tourism in IHR” was selected as one of the key
themes.
30. 30
▪ Provide us ecosystem services
▪ Water towers of world
▪ Biodiversity richness
▪ Influences the global systems
▪ Eco-tourism
▪ Fulfil the lowland needs
▪ Disaster barrier (e.g. floods)
▪ Spiritual significance
▪ Aesthetic beauty
▪ Wetland
STRENGTHWOT
STRENGTHS
31. 31
▪ Sensitivity to climate change
▪ Ecosystem fragility
▪ Marginalised
▪ Inaccessibility
▪ Social needs
▪ Skeleton soil
▪ Water management
▪ Soil loss due to erosional activities
▪ Less productive soil
▪ Biodiversity fragility
▪ Climate change
WEAKNESS
SWEAKNESSOT
32. 32
▪ Ecotourism
▪ Payment for ecosystem services
▪ Source of 6 asia's greatest rivers - water tower
▪ Natural resources
▪ Diverse culture
▪ Biologically richest areas on the earth : 10000
plant species , 977 birds , 300 mammals , 269
freshwater fishes , 176 reptiles , 105
amphibians.
OPPORTUNITIES
SWOPPORTUNITIEST
33. 33
▪ Population inflow
▪ waste disposal
▪ Increasing vehicular movements
▪ Pollution
▪ Tourism
▪ Deforestation
▪ Wetland degradation due to overgrazing, pollution,
tourism, climate change
▪ Soil degradation
▪ Global warming
▪ climate Change
▪ Vulnerability to disasters
▪ loss of life
▪ Threats to biodiversity - due to habitat loss and
poaching
▪ Increased of glof (glacier lake outburst flood)
▪ Torrential rain, cloudburst
▪ threat to economy - loss of property- increase of poverty
▪ Mining
THREATS
SWOTHREATS
34. 34
STRENGTH
Scenario in Himachal and Uttarakhand:
Himachal Pradesh
▪ Great Climatic conditions
• Diverse climatic conditions
▪ Rivers
• Ravi, Chenab, Sutluj
▪ Attraction of Sport tourism
▪ Cultural resources
Uttarakhand
▪ Climatic Conditions
• Cooler
▪ Rivers
• Ganga, Yamuna
▪ Attraction of Ecotourism
▪ Training institutes & Programmes
WEAKNESS Himachal Pradesh
▪ Lack of quality tourists
▪ Poor infrastructure for adventure
tourism
▪ No policies related to environmental
problems
▪ Poor air connectivity
Uttarakhand
▪ Lack of the information related to
adventure tourismStable political
environment
▪ Poor roads conditionsTax
▪ Poor banking
system/telecommunications
▪ Lack of hotel infrastructure
35. 35
THREATS Himachal Pradesh
▪ Safety concern
▪ Avalanche threats
▪ Ethical issues
▪ Threats from neighbouring states
Uttarakhand
▪ Tremendous pressure on natural
resource
▪ Increased competition from other sates
▪ Pricing/quality of the products
▪ Melting of the glaciers
OPPORTUNITIES Himachal Pradesh
▪ Lot of opportunities for private
investors.
▪ Multi dimension products available
▪ Civil aviation
▪ Numerous unexplored treks to be
explored
Uttarakhand
▪ Abundant natural resources
▪ Stable political environment
▪ Health Tourism
▪ Tax exemption.
36. 36
CHALLENGES ASSOCIATED WITH PILGRIMAGE TOURISM IN INDIAN HIMALAYA
Tourist destinations in Indian Himalayan region:
a) Pilgrimage
b) Hill stations
c) Adventure tourism- trekking, mountain climbing, sightseeing and winter sports
Challenges associated with pilgrimage as well as the whole tourism in Indian
Himalaya:
▪ Disasters during the tourist season
a) Kedarnath flood, Himalayan tsunami
b) Landslides during monsoon and post monsoon season
▪ Security of tourists
a) Mansarovar yatra, terrorist attack
▪ Environment degradation
a) deforestation
b) unplanned building of hotels, resorts etc.
c) water pollution
d) effects on wildlife
e) solid waste and dumping problems
37. 37
▪ Change in socio-cultural structure and styles:
a) affecting the structure and style of local communities by mixing new cultural practices on it.
b) interaction with tourists and their new practices, influence the local people to become so called ''modern''.
History of tourism in Indian Himalayan Region
In ancient times only pilgrimage was dominating factor for tourism in Himalayas. For people Himalaya was a
representation of divine place to worship. Eg- Kedarnath, Badrinath, etc
But in beginning of 19th century, British discovered the Himalayas as recreational areas and became more tourist
attraction in hill stations like Shimla, Missouri, etc
With the beginning of 1950s and onwards, as after Sir Edmund Hillary and Tenzing Norgay climbed the world’s
highest mountain- Mt. Everest and made record which afterwards became a huge attraction of sport and
adventure tourism as well. Eg- paragliding, rafting, trekking, etc.
38. 38
Modern approaches on tourism related issues-
▪ Tourism should be one part of a balanced economy
▪ The use of tourism environments must allow for long-term preservation and for use
of those environments.
▪ Tourism should respect the character of an area.
▪ Tourism must provide long-term economic benefits.
▪ Tourism should be sensitive to the needs of the host population.
Strategies for creating a sustainable tourism:
▪ The seasonal dispersal and regional diffusion of tourists:
a) Helps in taking pressure off the local ecosystem.
b) Achieved by either regulating the tourists allowed in a certain area
c) By introducing a more dynamic pricing policy, cresting incentives to visit less
frequented areas or to visit outside of the peak season.
39. 39
▪ The promotion of alternative, fuel saving technologies:
a) use of micro-hydro can help in reducing the use of firewood by locals and tourists, it will also help in reducing the
pressure on local forests.
▪ The creation and promotion of designated campsites:
a) it will offer certain amenities (such as washing facilities) the amount of ''wild'' camping along the trails could be
reduced.
▪ The sharing of revenues:
a) the management of the environment can involve an enormous amount of money. The revenue from user charges
and mountaineering royalties should be shared between the governments and the areas where this revenue is
created.
▪ The training of local people as guides-
a) it can help the local people to develop the skills needed to guide the tourists.
b) it will help to develop confidence to get involvement in tourism business and start own enterprise.
c) when the service will be improved, they can expect higher income.
▪ The creation of community based, participation-oriented tourism management committees-
a) allows locals to participate in the decision-making process and influence their lives directly.
b) participation increases the support and co-operation of the locals for protection projects, because they have
proper knowledge about local environment, and ways to save it.
Example of Sikkim biodiversity and ecotourism project (1995)
40. 40
Goal
▪ The conservation of biodiversity and natural resources through
increased capacity and actions of the stakeholders.
▪ In that area the fuelwood consumption problem has been tackled
by introducing alternative fuel saving technologies.
▪ Between 1996 to 1998, the fuelwood consumption was reduced
by 60%.
▪ Participation by the locals and private sector in decision-making
process has risen up to 50% in that area.
42. 42
▪ Value Ecosystem Services and Mountain Biodiversity: Modernization and democratization of local
communities in the management.
▪ Enhance Natural Regeneration of Forests: Over-emphasis on plantations, protection of individual trees (e.g.,
complete ban on tree cutting over 1000 m altitude), and promotion of a few fast growing individuals have
trivialized the importance.
▪ Linking Biodiversity Conservation with Rural Livelihoods: Be it the quest for fuel wood for cooking and
heating, leaf fodder for cattle, or the open grazing of domestic animals, all these are responsible for
significant forest degradation and biodiversity losses in the Himalaya.
▪ Participatory Resource Management (PRM): Pro – active action is required in involving the hill women in
resource management. Sensitisation of the bureaucracy, scientists and decision makers, including
community leaders is needed so that they can effectively collaborate in joint – initiatives and extend support.
▪ Mountain communities are rich repositories of traditional knowledge, practices and resources. Traditional
knowledge and practices have evolved through generations of empirical experimentation. The involvement of
mountain communities in technology development, conservation and management of mountain resources
needs to be strategically formalized.
RECOMMENDATIONS FOR MOUNTAIN DEVELOPMENT
43. 43
▪ Preparing research priority matrix for regions covering the information gaps, allocate adequate funds and
execute coordinated and scientific research through Universities and Institutes.
▪ Develop empirical models, depicting climate change scenarios for key glaciers and subsequent river
discharge, with reference to changes in hydrology, primary productivity of various ecosystems, biodiversity
and mountain farming.
▪ Networking and developing partnerships among the civil society, research organizations, CBOs and
NGOs have been reiterated time and again in various plans and policy documents.
▪ Himalayan mountains have been attracting mountaineers from all over the world, but this activity
(mountaineering) has not been perceived beyond just being a sport / a past time. Integration of various
departments such as tourism and sports, defense personnel, departments of environment and mountain
hazard mitigation need to consider this aspect and train the local youth, committing members, including
their own persons and women in mountaineering and other adventure sports.
45. 45
Mountainous regions occupy one-fourth of the world’s terrestrial surface, most rich in diverse landscapes and
hold on to the biodiversity and cultural diversity along with supporting 10% of humankind with their direct life
support base. Most mountainous regions have been at the far periphery of mainstream societal concerns for a
long time. Remote, relatively inaccessible, they were generally pictured as difficulty, unyielding and unprofitable
environments. Very less have focused attention on mountainous people and cultures, primitive religion, marginal
survival, unusual adaptation to very high altitude, fraternal polyandry to obliterate informed communication and
more meaningful analysis in practical sense. Early research concentrated mainly on specialised studies with
little cross disciplinary endeavour. During the last few decades there have been spasmodic accounts of the
highland and lowland mainly induced by events of great economic or political significance and due to the
degradation of highlands which are potential threats to subjacent lowland population centre. Recent
developments, expanding highland research and awareness spread by institutions and governments have
shone a new ray of light towards the bright future. However, increased awareness with political advocacy must
be pursued further.