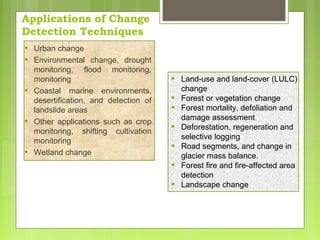
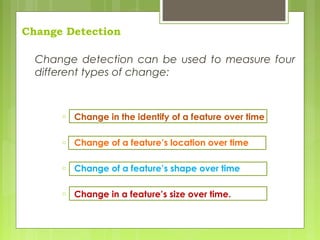
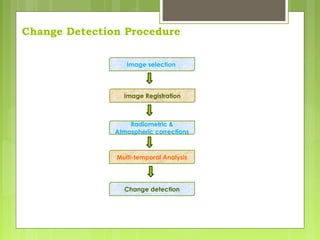
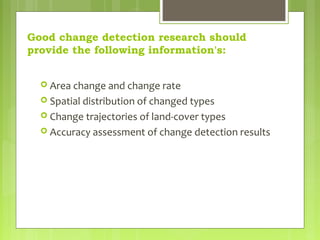
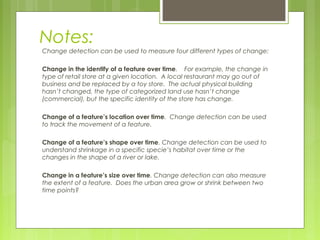
A remote sensing system uses a detector to sense the reflected or emitted energy from the earth's surface, perhaps modified by the intervening atmosphere. The sensor can be on a satellite, aircraft, or drone. The sensor turns the energy into a voltage, which an analog to digital converter turns into a single integer value (called the Digital Number, or DN) for the energy. Alternatively a digital detector can store the DN directly. We can then display this value with an appropriate color to build up an image of the region sensed by the system. The DN represents the energy sensed by the sensor in a particular part of the electromagnetic spectrum, emitted or reflected from a particular region. The principles can also be applied to sonar imagery, especially useful in water where sound penetrates readily whereas electromagnetic energy attenuates rapidly.
Definitions,
Remote sensing systems can be active or passive: active systems put out their own source of energy (a large "flash bulb") whereas passive systems use solar energy reflected from the surface or thermal energy emitted by the surface. Active systems can achieve higher resolution.
Satellite resolution considers four things: spatial, spectral, radiometric, and temporal resolution.
Electromagnetic radiation and the atmosphere control many aspects of a remote sensing system.
Satellite orbits determine many characteristics of the imagery, what the satellite sees, and how often it revisits an area.
The signal to noise ratio is important for the design of remote sensing systems.
Satellite band tradeoffs.
Interpreting satellite reflectance patterns and images uses various statistical measures to assess surface properties in the image.
The colors used on the display are gray shading for single bands, and RGB for multi-band composites. We can also perform image merge and sharpening to combine the advantages of both panchromatic (higher spatial resolution) and color imagery (better differentiation of surface materials).
Keys for image analysis
Hyperspectral imagery
Spectral reflectance library--different materials reflect radiation differently
Radiometric corrections include correcting the data for sensor irregularities and unwanted sensor or atmospheric noise, and converting the data so they accurately represent the reflected or emitted radiation measured by the sensor.
This document help you to prepare Triangulation Network (TIN), Hillshade Map, Slope map, interpolation and Digital Elevation Model (DEM) in a area and how to interpret them.
it is highly useful for geography students in the field of remote sensing and it is in very simple and explanatory for the purpose of simplification with relevant images in this ppt.
In the context of remote sensing, change detection refers to the process of identifying differences in the state of land features by observing them at different times. This process can be accomplished either manually (i.e., by hand) or with the aid of remote sensing software. Manual interpretation of change from satellite images or aerial photos involves an observer or analyst defining areas of interest and comparing them between images from two dates. This may be accomplished either on-screen (such as in a GIS) or on paper. When analyzing aerial photographs, a stereoscope which allows for two spatially-overlapping photos to be displayed in 3D, can aid photo interpretation. Manual image interpretation works well when assessing change between discrete classes (forest openings, land use and land cover maps) or when changes are large (e.g., heavy mechanized maneuver damage, engineering training impacts). Manual image interpretation is also an option when trying to determine change using images or photos from different sources (comparing historic aerial photographs to current satellite imagery).
Automated methods of remote sensing change detection usually are of two forms: post-classification change detection and image differencing using band ratios. In post-classification change detection, the images from each time period are classified using the same classification scheme into a number of discrete categories like land cover types. The two (or more) classifications are compared and the area that is classified the same or different is tallied. With image differencing, a band ratio such as NDVI is constructed from each input image, and the difference is taken between the band ratios of different times. In the case of differencing NDVI images, positive output values may indicate an increase in vegetation, negative values a decrease in vegetation, and values near zero no change. With either post-classification or image differencing change detection, it is necessary to specify a threshold below which differences between the two images is considered to be non-significant. The specification of thresholds is critical to the results of change detection analysis and usually must be found through an iterative process.
THIS PRESENTATION IS TO HELP YOU PERFORM THE TASK STEP BY STEP.
Introduction to GIS - Basic spatial concepts - Coordinate Systems - GIS and Information Systems – Definitions – History of GIS - Components of a GIS – Hardware, Software, Data, People, Methods – Proprietary and open source Software - Types of data – Spatial, Attribute data- types of attributes – scales/ levels of measurements.
LAND USE /LAND COVER CLASSIFICATION AND CHANGE DETECTION USING GEOGRAPHICAL I...IAEME Publication
Land use and land cover change has become a central component in current strategies for managing natural resources and monitoring environmental changes. Geographical information system and image processing techniques used for the analysis of land use/land cover and change detection of Sukhana Basin of Aurangabad District, Maharashtra state. The tools used ArcGIS10.1 and ERDAS IMAGINE9.1, landsat images of 1996, 2003and 2014. From land use / land cover change detection it is found that during 1996-2014, water bodies cover have loss of 4 Sq. Km. Barren land have 146 Sq.Km. loss and forest area with 96 Sq.Km. loss. It is found that urbanization area has gain of 51 Sq.Km. and agricultural land cover also have gain of 195 Sq.Km.
A presentation given by Anthony Beck at the Archpro workshop1 in Vienna. The workshop was instigated by the Ludwig Boltzmann Institute.
This presentation provides an overview of the DART project with particular emphasis on the techniques and methodology
A Review of Change Detection Techniques of LandCover Using Remote Sensing Dataiosrjce
IOSR Journal of Computer Engineering (IOSR-JCE) is a double blind peer reviewed International Journal that provides rapid publication (within a month) of articles in all areas of computer engineering and its applications. The journal welcomes publications of high quality papers on theoretical developments and practical applications in computer technology. Original research papers, state-of-the-art reviews, and high quality technical notes are invited for publications.
Remote sensing for change detection (presentation) - Prepared by A F M Fakhru...A F M Fakhrul Azam Shaikat
Change detection, in the Remote Sensing discipline, is the analytical process that aims to detect changes, over time and space of the land cover or/and land use....
The presentation was given by Mr. Bas Kempen & Ms. V.L. Mulder, ISRIC, during the GSOC Mapping Global Training hosted by ISRIC - World Soil Information, 6 - 23 June 2017, Wageningen (The Netherlands).
Room Enough for Everyone? Understanding Human Uses & Interactions in RI Coast...riseagrant
Dennis Nixon (Facilitator)
Associate Dean for Research & Administration, URI GSO
Robert Thompson
Associate Professor & Chair, URI Marine Affairs
Tracey Dalton
Associate Professor, URI Marine Affairs
The International Journal of Engineering and Science (The IJES)theijes
The International Journal of Engineering & Science is aimed at providing a platform for researchers, engineers, scientists, or educators to publish their original research results, to exchange new ideas, to disseminate information in innovative designs, engineering experiences and technological skills. It is also the Journal's objective to promote engineering and technology education. All papers submitted to the Journal will be blind peer-reviewed. Only original articles will be published.
Effectiveness and Capability of Remote Sensing (RS) and Geographic Informatio...nitinrane33
In this research paper, the effectiveness and capability of remote sensing (RS) and geographic information systems (GIS) are investigated as powerful tools for analyzing changes in land use and land cover (LULC), as well as for accuracy assessment. The study employs the literature of satellite imagery and GIS data to evaluate LULC changes over a period and to assess the accuracy of the analysis. Moreover, the research investigates the land use and land cover change detection analysis using RS and GIS, application of artificial intelligence (AI), and Machine Learning (ML) in LULC classification, environment and risk evaluation, stages of process LULC classification, factors affecting the LULC classification, accuracy assessment, and potential applications of RS and GIS in predicting future LULC changes and supporting decision-making processes. The findings of the study suggest that RS and GIS are highly effective and accurate for LULC analysis and assessment, with substantial potential for predicting and managing future changes in land use and land cover. The paper emphasizes the importance of utilizing RS and GIS techniques in the field of sustainable environmental management and resource planning.
Performance analysis of change detection techniques for land use land coverIJECEIAES
Remotely sensed satellite images have become essential to observe the spatial and temporal changes occurring due to either natural phenomenon or man-induced changes on the earth’s surface. Real time monitoring of this data provides useful information related to changes in extent of urbanization, environmental changes, water bodies, and forest. Through the use of remote sensing technology and geographic information system tools, it has become easier to monitor changes from past to present. In the present scenario, choosing a suitable change detection method plays a pivotal role in any remote sensing project. Previously, digital change detection was a tedious task. With the advent of machine learning techniques, it has become comparatively easier to detect changes in the digital images. The study gives a brief account of the main techniques of change detection related to land use land cover information. An effort is made to compare widely used change detection methods used to identify changes and discuss the need for development of enhanced change detection methods.
Similar to Change detection using remote sensing and GIS (20)
The Indian economy is classified into different sectors to simplify the analysis and understanding of economic activities. For Class 10, it's essential to grasp the sectors of the Indian economy, understand their characteristics, and recognize their importance. This guide will provide detailed notes on the Sectors of the Indian Economy Class 10, using specific long-tail keywords to enhance comprehension.
For more information, visit-www.vavaclasses.com
Operation “Blue Star” is the only event in the history of Independent India where the state went into war with its own people. Even after about 40 years it is not clear if it was culmination of states anger over people of the region, a political game of power or start of dictatorial chapter in the democratic setup.
The people of Punjab felt alienated from main stream due to denial of their just demands during a long democratic struggle since independence. As it happen all over the word, it led to militant struggle with great loss of lives of military, police and civilian personnel. Killing of Indira Gandhi and massacre of innocent Sikhs in Delhi and other India cities was also associated with this movement.
The French Revolution, which began in 1789, was a period of radical social and political upheaval in France. It marked the decline of absolute monarchies, the rise of secular and democratic republics, and the eventual rise of Napoleon Bonaparte. This revolutionary period is crucial in understanding the transition from feudalism to modernity in Europe.
For more information, visit-www.vavaclasses.com
Ethnobotany and Ethnopharmacology:
Ethnobotany in herbal drug evaluation,
Impact of Ethnobotany in traditional medicine,
New development in herbals,
Bio-prospecting tools for drug discovery,
Role of Ethnopharmacology in drug evaluation,
Reverse Pharmacology.
This is a presentation by Dada Robert in a Your Skill Boost masterclass organised by the Excellence Foundation for South Sudan (EFSS) on Saturday, the 25th and Sunday, the 26th of May 2024.
He discussed the concept of quality improvement, emphasizing its applicability to various aspects of life, including personal, project, and program improvements. He defined quality as doing the right thing at the right time in the right way to achieve the best possible results and discussed the concept of the "gap" between what we know and what we do, and how this gap represents the areas we need to improve. He explained the scientific approach to quality improvement, which involves systematic performance analysis, testing and learning, and implementing change ideas. He also highlighted the importance of client focus and a team approach to quality improvement.
The Roman Empire A Historical Colossus.pdfkaushalkr1407
The Roman Empire, a vast and enduring power, stands as one of history's most remarkable civilizations, leaving an indelible imprint on the world. It emerged from the Roman Republic, transitioning into an imperial powerhouse under the leadership of Augustus Caesar in 27 BCE. This transformation marked the beginning of an era defined by unprecedented territorial expansion, architectural marvels, and profound cultural influence.
The empire's roots lie in the city of Rome, founded, according to legend, by Romulus in 753 BCE. Over centuries, Rome evolved from a small settlement to a formidable republic, characterized by a complex political system with elected officials and checks on power. However, internal strife, class conflicts, and military ambitions paved the way for the end of the Republic. Julius Caesar’s dictatorship and subsequent assassination in 44 BCE created a power vacuum, leading to a civil war. Octavian, later Augustus, emerged victorious, heralding the Roman Empire’s birth.
Under Augustus, the empire experienced the Pax Romana, a 200-year period of relative peace and stability. Augustus reformed the military, established efficient administrative systems, and initiated grand construction projects. The empire's borders expanded, encompassing territories from Britain to Egypt and from Spain to the Euphrates. Roman legions, renowned for their discipline and engineering prowess, secured and maintained these vast territories, building roads, fortifications, and cities that facilitated control and integration.
The Roman Empire’s society was hierarchical, with a rigid class system. At the top were the patricians, wealthy elites who held significant political power. Below them were the plebeians, free citizens with limited political influence, and the vast numbers of slaves who formed the backbone of the economy. The family unit was central, governed by the paterfamilias, the male head who held absolute authority.
Culturally, the Romans were eclectic, absorbing and adapting elements from the civilizations they encountered, particularly the Greeks. Roman art, literature, and philosophy reflected this synthesis, creating a rich cultural tapestry. Latin, the Roman language, became the lingua franca of the Western world, influencing numerous modern languages.
Roman architecture and engineering achievements were monumental. They perfected the arch, vault, and dome, constructing enduring structures like the Colosseum, Pantheon, and aqueducts. These engineering marvels not only showcased Roman ingenuity but also served practical purposes, from public entertainment to water supply.
How to Make a Field invisible in Odoo 17Celine George
It is possible to hide or invisible some fields in odoo. Commonly using “invisible” attribute in the field definition to invisible the fields. This slide will show how to make a field invisible in odoo 17.
Model Attribute Check Company Auto PropertyCeline George
In Odoo, the multi-company feature allows you to manage multiple companies within a single Odoo database instance. Each company can have its own configurations while still sharing common resources such as products, customers, and suppliers.
2. Remote sensing is a method of obtaining information about the
properties of an object without coming into physical contact with it.
A) Energy Source
B) Atmosphere & Radiation
C) Interaction with the target &
recording of the ref. energy
D) Transmission & ground level
processing
E) Interpretation, Analysis and
Application
Source: GrindGIS
Remote Sensing
3. RS system capture radiation in different wavelength
reflected/emitted by the earth’s surface features and recorded
it either directly on the film as in case of aerial photography or
in digital medium used for generating the images
It provides valuable data over vast area in a short time about
resources, meteorology and environment leading to better
resource management and accelerating national development
Remote Sensing
4. Change detection in GIS is a method of understanding
how a given area has changed between two or more
time periods.
It is helpful in many applications such as:
• Land use changes
• Rate of deforestation
• Coastal change
• Urban sprawl
Change detection involves comparing changes
between aerial photographs taken over different time
periods that cover the exact same geographic area.
Change Detection
5. • Urban change
• Environmental change, drought
monitoring, flood monitoring,
monitoring
• Coastal marine environments,
desertification, and detection of
landslide areas
• Other applications such as crop
monitoring, shifting cultivation
monitoring
• Wetland change
Applications of Change
Detection Techniques
• Land-use and land-cover (LULC)
change
• Forest or vegetation change
• Forest mortality, defoliation and
damage assessment
• Deforestation, regeneration and
selective logging
• Road segments, and change in
glacier mass balance.
• Forest fire and fire-affected area
detection
• Landscape change
6. Change detection can be used to measure four
different types of change:
o Change in the identify of a feature over time
o Change of a feature’s location over time
o Change of a feature’s shape over time
o Change in a feature’s size over time.
Change Detection
8. Good change detection research should
provide the following information's:
Area change and change rate
Spatial distribution of changed types
Change trajectories of land-cover types
Accuracy assessment of change detection results
10. Source: I.R. Hegazy, M.R. Kaloop /
International Journal of Sustainable
Built Environment 4 (2015) 117–124
1985 2000
2010
Mansoura and Talkha land use maps
11. Four land cover maps (A. 2007, B. 2008, C. 2009, and D. 2010) and locations of concession
and conservation areas including deforested landscape observed in 2007e2010 (E).
Source:Soraya Violini, Deforestation: Change Detection in Forest Cover using Remote Sensing
12.
13. o Monitoring urban growth and land use change detection with GIS
and remote sensing techniques in Daqahlia governorate Egypt-
Ibrahim Rizk Hegazy 2015
o PETIT, C. C., and LAMBIN, E. F., 2001, Integration of multi-source
remote sensing data for land cover change detection. International
Journal of Geographical Information Science, 15, 785–803
o Google Time-Lapse video(1984-2016)
References
15. Notes:
Change detection can be used to measure four different types of change:
Change in the identify of a feature over time. For example, the change in
type of retail store at a given location. A local restaurant may go out of
business and be replaced by a toy store. The actual physical building
hasn’t changed, the type of categorized land use hasn’t change
(commercial), but the specific identity of the store has change.
Change of a feature’s location over time. Change detection can be used
to track the movement of a feature.
Change of a feature’s shape over time. Change detection can be used to
understand shrinkage in a specific specie’s habitat over time or the
changes in the shape of a river or lake.
Change in a feature’s size over time. Change detection can also measure
the extent of a feature. Does the urban area grow or shrink between two
time points?