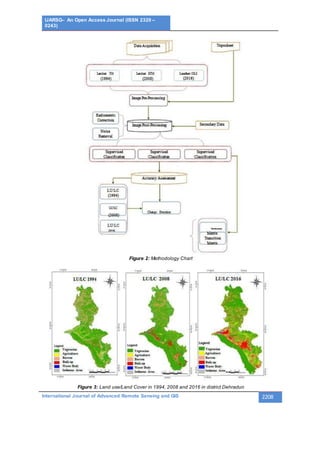
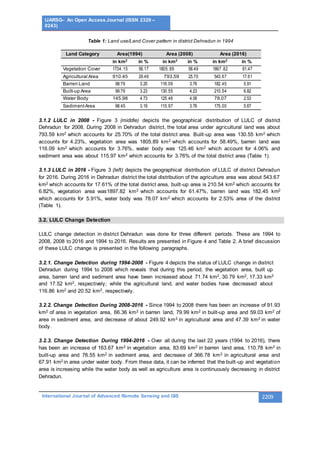
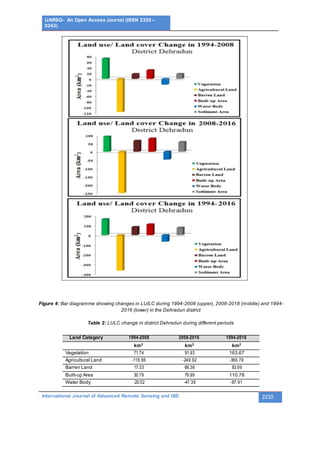
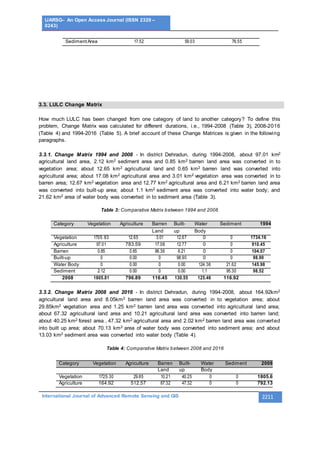
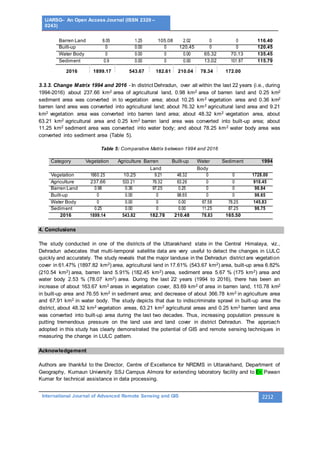
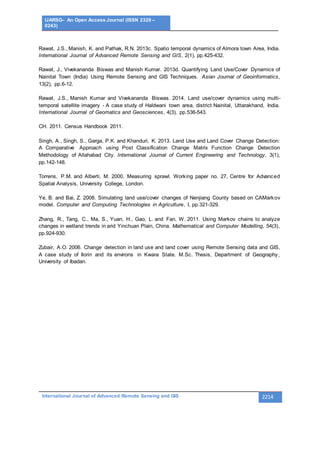
Cloud Publications
International Journal ofAdvanced Remote Sensing and GIS
2017,Volume 6, Issue 1,pp. 0000-0000
ISSN 2320 – 0243, Crossref:
______________________________________________________________________________________________________
Land Use/Land Cover Change Study of District Dehradun,
Uttarakhand using Remote Sensing and GIS Technologies
Varun Rawat and Mansi Puri
Department of Computer Science, DIT University Dehradun, Uttrakhand, India
Publication Date:
DOI:
Copyright © 2017 Varun Rawat and Mansi Puri. This is an open access article distributed under the Creative
Commons Attribution License, which permits unrestricted use, distribution, and reproduction in any medium,
provided the original work is properly cited.
Abstract The present study illustrates an integrated approach of geospatial technologies, i.e., remote
sensing and GIS for assessment of land use/cover dynamics of a district of the Uttarakhand State viz.,
the Dehradun. Landsat satellite imageries of three different years, i.e., Landsat Thematic Mapper (TM)
of 1994, 1999 and 2016 were acquired by USGS Earth Explorer and quantified the land use/cover
changes in district Dehradun for a period of more than two decades. Supervised Classification
methodology has been employed using Maximum Likelihood Technique in ERDAS 9.3. The images of
the study area were categorized into six different land us/land cover classes, viz., vegetation area (in
61.47% area), agricultural land (17.61%), built-up area (6.82%), barren area (5.91%), sediment area
(5.67%) and area under water body (2.53%). The results indicate that during the last twenty two years
(1994-2016) the vegetation area, built-up area, barren land and sediment area have been increased
about 163.67 km2, 110.78 km2, 83.69 km2 and 78.55 km2, respectively, while the agricultural land and
water body have been decreased about 366.78 km2 and 67.91 km2, respectively. The approach
adopted in this study has clearly demonstrated the potential of remote sensing and GIS techniques in
measuring the change pattern of land use/cover.
Keywords Change detection; Geospatial Technologies; Remote Sensing; GIS; District Dehradun
1. Introduction
The land is one of the most important natural resources as life and various development activities are
based on it. Land cover is a fundamental parameter describing the Earth’s surface. This parameter is a
considerable variable that impacts on and links many parts of the human and physical environments
(Torrens and Alberti, 2000; Barnes et al., 2001). Land use refers to human activities which are directly
related to the land (Epstein et al., 2002). Land use involves the management and modification of natural
environment or wilderness into built environment such as fields, pastures, and settlements. Land
use/land cover (LULC) changes are driven by natural forces or by human land uses. Thus, it involves
both the natural and the human dimensions. Information on LU/LC is important to support planning and
sustainable management of natural resources and socio-economic development (Rawat et al., 2013a;
b; Zubair et al., 2006).
The land is one of the most important natural resources, as life and various development activities are
based on it. Land-cover change has been identified as one of the most important drivers of changes in
the ecosystem and their services.
Research Article
IJARSG– An Open Access Journal (ISSN 2320 –
0243)
International Journal of Advanced Remote Sensing and GIS 2205
Locally, the land cover changes due to an environment or climatic factors determine the vulnerability of
people to climatic perturbations and thus affect the decisions on land use by people. Globally , on the
other hand, the land cover changes significantly affecting the functioning of Earth's system. Hence,
information on land use/land cover is essential for the selection, planning and implementation of land
use and can be used to meet the increasing demands for basic human needs and welfare. This
information also assists in monitoring the dynamics of land use resulting out of changing demands of
increasing population. Changes in land cover by land use patterns, affects biodiversity, water and other
processes that come together to affect climate and biosphere. Changes in LU/LC now have become the
central component in current strategies for managing of the land use pattern in any area (Abdelhamid
et al., 2006; Ye Bai et al., 2008; Lo Yang et al., 2002; Cohen et al., 2006; Heuvelink and Burrough et al.,
2002).
LU/LC change detection is very essential for better understanding of landscape dynamic during a known
period of time having sustainable management (Lillesand et al., Kiefer et al., 1987; Zhang et al., 2011)
and to asses loss and ecosystem disturbances (Rawat,2016). LU/LC change is a widespread and
accelerating process, mainly driven by natural phenomena and anthropogenic activities, which in turn
drive change that would impact natural ecosystem. Timely and precise information about LULC change
detection of Earth’s surface is extremely important for understanding relationships and interactions
between human and natural phenomena for better management of decision making (Pontius and
Malanson et al., 2005; Jokar et al., 2013).
Research conducted in Ethiopia has shown that there were considerable LULC changes in the country
during the second half of the 20th. Timely and precise information about LULC change detection of
Earth’s surface is extremely important for understanding relationships and interactions between human
and natural phenomena for better management of decision making (Krivoruchko and Redlands et al.,
2005). Recent LU/LC studies in the Uttarakhand State in Central Himalaya reveals that due to population
pressure, towns are growing indiscriminately on the highly fertile agricultural lands (Rawat et al.,
2013a;2013b;2013c;2013d; 2014)
The present study aims to demonstrate application of geospatial technologies, i.e., remote sensing and
GIS in land use/ land cover study and to define its dynamics since the last few decades.
2. Material and Methodology
2.1. Study Area
The study area, viz., district Dehradun is one of the total thirteen districts of the Uttarakhand state
(Figure 1) where the capital of the State –Dehradun lies. District Dehradun, encompassing an area of
3088.50 km2, extends in between 29o 57’56.44” N to 31 o1’127.13” N Latitudes and 77o 38’19.57” E to
78.1424.53” E Longitudes. The elevation of the district varies in between 288 m to 3096 m from the
mean sea level. Attitudinally about one-third part (i.e., 32.43% area) of the district lies in between 600m
to 1200m relief region while a small part (3.55% area) lies in the relief zone more than 2400m. The
district has 6 development blocks, 6 tehsils and 771 villages with population of 5, 69,578 having a
population density of 184 persons/km2 (SH, 2011)
2.2. Data Process and Data Use
IJARSG– An Open Access Journal (ISSN 2320 –
0243)
International Journal of Advanced Remote Sensing and GIS 2206
The LANDSAT is a scientific program which is operated by NASA and USGS, which offers the longest
global record of Earth's surface. The satellite data used in the present study includes the imagery of
LANDSAT-5 "TM", LANDSAT-7 "ETM" And LANDSAT-8 "OLI" & "TIRS" Sensor.
The LANDSAT-5 imagery is of February 1994, LANDSAT-7 imagery is of March 2000, and LANDSAT-
8 is of February 2016 with the resolution of 30m nominal and panchromatic resolution is 15m. Map
projection used in "UTM" datum “WGS84" and UTM zone is 44.
2.3. Software used
In this study, ERDAS IMAGINE-9.3 remote sensing application with raster graphics editor abilities
designed by ERDAS is used. ERDAS IMAGINE is aimed primarily at geospatial raster data processing
and allows the user to prepare, display and enhance the digital image for mapping use in GIS or
software.
Figure 1: Location map of the study area, viz., Dehradun District
2.4. Image Classification
Multispectral classification is the process of sorting pixels into a finite number of individual classes or
categories of data, based on their data file values. If a pixel satisfies a certain set of criteria, the pixel
is assigned to the class that corresponds to that criterion. This process is also referred to as image
segmentation. Depending on the type of information to be extracted from the origin data, classes may
be associated with known features on the ground or may simply represent areas that look different to
the computer. An example of a classified image is a land cover map, showing vegetation, bare land,
pasture, urban and so forth. In this study we have used supervised image classification map, one
common application of remotely-sensed images to land management is the creation of maps,
vegetation type, or other discrete classes by remote sensing software. The flow chart (Figure 2)
IJARSG– An Open Access Journal (ISSN 2320 –
0243)
International Journal of Advanced Remote Sensing and GIS 2207
illustrates methodology used in this paper which includes data used and different steps of data
processing.
2.5. Accuracy Assessment
In the context of information extraction by image analysis, accuracy measures the agreement between
a standard assumed to be correct and a classified image of unknown quality (Singh et al., 2013). The
accuracy of image classification is most often reported as a percentage correction. The consumer's
accuracy (CA) is computed using the number of correctly classified pixels to the total number of pixels
assigned to a particular category.
It takes errors of the commission into account by telling the consumer that, for all areas identified as
category X, a certain percentage are actually correct. The producer's accuracy (PA) informs the image
analyst of the number of pixels correctly classified in a particular category as a percentage of the total
number of pixels actually belonging to that category in the image. Producer's accuracy measures errors
of the omission.
2.6. Error Matrix
One of the most common means of expressing classification accuracy is the preparation of a
classification error matrix. Error matrices compare, on a category by category basis, the relationship
between known reference data (ground truth) and the corresponding result of an automated
classification. Such matrices are square, with the number of rows and columns equal to the number of
categories whose classification accuracy is being assessed. Overall accuracy is computed by dividing
the total number of correctly classified pixels by the total number of reference pixels. The accuracies of
individual categories can be calculated by dividing the number of correctly classified pixels in eac h
category by either the total number of pixels in the corresponding row and column. Producers accuracies
result from dividing the number of correctly classified pixels in each category (on the major diagonal) by
the number of training set pixels used for other categories (the column total). User accuracy is computed
by dividing the number of correctly classified pixels in each category by the total number of pixels that
were classified in that category (the row total).
3. Results and Discussion
3.1. Land use/Land Cover
LULC categories for three different years (i.e., 1994, 2008 and 2016) were assessed using remote
sensing and GIS techniques. The results are presented in Figure 3 and Table 1. A brief account of year
wise discussion of these results is presented in the following paragraphs.
3.1.1. LULC in 1994- The satellite image of the study area, classification of different LULC of district
Dehradun for the year 1994 is presented in Figure 3 (left). In 1994 about 1734.15 km2 which accounts
for 56.17% of the total district area was under vegetation cover, about 910.45 km2 which accounts for
29.48% was under agricultural land, about 99.76 km2 which accounts for 3.23% was under built up area,
about 98.76 km2 which accounts for 3.20% was under barren land, about145.98 km2 which accounts
for 4.73% was in water body and the remaining about 98.45 km2 which accounts for 3.19% of the total
district area was under sediment area (Table 1).
IJARSG– An Open Access Journal (ISSN 2320 –
0243)
International Journal of Advanced Remote Sensing and GIS 2208
Figure 2: Methodology Chart
Figure 3: Land use/Land Cover in 1994, 2008 and 2016 in district Dehradun
IJARSG– An Open Access Journal (ISSN 2320 –
0243)
International Journal of Advanced Remote Sensing and GIS 2209
Table 1: Land use/Land Cover pattern in district Dehradun in 1994
Land Category Area(1994) Area (2008) Area (2016)
in km2
in % in km2
in % in km2
in %
Vegetation Cover 1734.15 56.17 1805.89 58.49 1897.82 61.47
Agricultural Area 910.45 29.49 793.59 25.70 543.67 17.61
Barren Land 98.76 3.20 116.09 3.76 182.45 5.91
Built-up Area 99.76 3.23 130.55 4.23 210.54 6.82
Water Body 145.98 4.73 125.46 4.06 78.07 2.53
SedimentArea 98.45 3.19 115.97 3.76 175.00 5.67
3.1.2 LULC in 2008 - Figure 3 (middle) depicts the geographical distribution of LULC of district
Dehradun for 2008. During 2008 in Dehradun district, the total area under agricultural land was about
793.59 km2 which accounts for 25.70% of the total district area. Built-up area was 130.55 km2 which
accounts for 4.23%, vegetation area was 1805.89 km2 which accounts for 58.49%, barren land was
116.09 km2 which accounts for 3.76%, water body was 125.46 km2 which account for 4.06% and
sediment area was about 115.97 km2 which accounts for 3.76% of the total district area (Table 1).
3.1.3 LULC in 2016 - Figure 3 (left) depicts the geographical distribution of LULC of district Dehradun
for 2016. During 2016 in Dehradun district the total distribution of the agriculture area was about 543.67
km2 which accounts for 17.61% of the total district area, built-up area is 210.54 km2 which accounts for
6.82%, vegetation area was1897.82 km2 which accounts for 61.47%, barren land was 182.45 km2
which accounts for 5.91%, water body was 78.07 km2 which accounts for 2.53% area of the district
(Table 1).
3.2. LULC Change Detection
LULC change detection in district Dehradun was done for three different periods. These are 1994 to
2008, 2008 to 2016 and 1994 to 2016. Results are presented in Figure 4 and Table 2. A brief discussion
of these LULC change is presented in the following paragraphs.
3.2.1. Change Detection during 1994-2008 - Figure 4 depicts the status of LULC change in district
Dehradun during 1994 to 2008 which reveals that during this period, the vegetation area, built up
area, barren land and sediment area have been increased about 71.74 km2, 30.79 km2, 17.33 km2
and 17.52 km2, respectively; while the agricultural land, and water bodies have decreased about
116.86 km2 and 20.52 km2, respectively.
3.2.2. Change Detection During 2008-2016 - Since 1994 to 2008 there has been an increase of 91.93
km2 of area in vegetation area, 66.36 km2 in barren land, 79.99 km2 in built-up area and 59.03 km2 of
area in sediment area, and decrease of about 249.92 km2 in agricultural area and 47.39 km2 in water
body.
3.2.3. Change Detection During 1994-2016 - Over all during the last 22 years (1994 to 2016), there
has been an increase of 163.67 km2 in vegetation area, 83.69 km2 in barren land area, 110.78 km2 in
built-up area and 76.55 km2 in sediment area, and decrease of 366.78 km2 in agricultural area and
67.91 km2 in area under water body. From these data, it can be inferred that the built-up and vegetation
area is increasing while the water body as well as agriculture area is continuously decreasing in district
Dehradun.
IJARSG– An Open Access Journal (ISSN 2320 –
0243)
International Journal of Advanced Remote Sensing and GIS 2210
Figure 4: Bar diagramme showing changes in LU/LC during 1994-2008 (upper), 2008-2018 (middle) and 1994-
2016 (lower) in the Dehradun district
Table 2: LULC change in district Dehradun during different periods
Land Category 1994-2008 2008-2016 1994-2016
km2 km2 km2
Vegetation 71.74 91.93 163.67
Agricultural Land -116.86 -249.92 -366.78
Barren Land 17.33 66.36 83.69
Built-up Area 30.79 79.99 110.78
Water Body -20.52 -47.39 -67.91
IJARSG– An Open Access Journal (ISSN 2320 –
0243)
International Journal of Advanced Remote Sensing and GIS 2211
3.3. LULC Change Matrix
How much LULC has been changed from one category of land to another category? To define this
problem, Change Matrix was calculated for different durations, i.e., 1994-2008 (Table 3), 2008-2016
(Table 4) and 1994-2016 (Table 5). A brief account of these Change Matrices is given in the following
paragraphs.
3.3.1. Change Matrix 1994 and 2008 - In district Dehradun, during 1994-2008, about 97.01 km2
agricultural land area, 2.12 km2 sediment area and 0.85 km2 barren land area was converted in to
vegetation area; about 12.65 km2 agricultural land and 0.65 km2 barren land was converted into
agricultural area; about 17.08 km2 agricultural area and 3.01 km2 vegetation area was converted in to
barren area; 12.67 km2 vegetation area and 12.77 km2 agricultural area and 6.21 km2 barren land area
was converted into built-up area; about 1.1 km2 sediment area was converted into water body; and
21.62 km2 area of water body was converted in to sediment area (Table 3).
Table 3: Comparative Matrix between 1994 and 2008
Category Vegetation Agriculture Barren Built- Water Sediment 1994
Land up Body
Vegetation 1705.83 12.65 3.01 12.67 0 0 1734.16
Agriculture 97.01 783.59 17.08 12.77 0 0 910.45
Barren 0.85 0.65 96.36 6.21 0 0 104.07
Built-up 0 0.00 0 98.90 0 0 98.90
Water Body 0 0.00 0 0.00 124.36 21.62 145.98
Sediment 2.12 0.00 0 0.00 1.1 95.30 98.52
2008 1805.81 796.89 116.45 130.55 125.46 116.92
3.3.2. Change Matrix 2008 and 2016 - In district Dehradun, during 1994-2008, about 164.92km2
agricultural land area and 8.05km2 barren land area was converted in to vegetation area; about
29.85km2 vegetation area and 1.25 km2 barren land area was converted into agricultural land area;
about 67.32 agricultural land area and 10.21 agricultural land area was converted into barren land;
about 40.25 km2 forest area , 47.32 km2 agricultural area and 2.02 km2 barren land area was converted
into built up area; about 70.13 km2 area of water body was converted into sediment area; and about
13.03 km2 sediment area was converted into water body (Table 4).
Table 4: Comparative Matrix between 2008 and 2016
Category Vegetation Agriculture Barren Built- Water Sediment 2008
Land up Body
Vegetation 1725.30 29.85 10.21 40.25 0 0 1805.6
Agriculture 164.92 512.57 67.32 47.32 0 0 792.13
SedimentArea 17.52 59.03 76.55
IJARSG– An Open Access Journal (ISSN 2320 –
0243)
International Journal of Advanced Remote Sensing and GIS 2212
Barren Land 8.05 1.25 105.08 2.02 0 0 116.40
Built-up 0 0.00 0 120.45 0 0 120.45
Water Body 0 0.00 0 0.00 65.32 70.13 135.45
Sediment 0.9 0.00 0 0.00 13.02 101.87 115.79
2016 1899.17 543.67 182.61 210.04 78.34 172.00
3.3.3. Change Matrix 1994 and 2016 - In district Dehradun, over all within the last 22 years (i.e., during
1994-2016) about 237.66 km2 area of agricultural land, 0.98 km2 area of barren land and 0.25 km2
sediment area was converted in to vegetation area; about 10.25 km2 vegetation area and 0.36 km2
barren land area was converted into agricultural land; about 76.32 km2 agricultural land area and 9.21
km2 vegetation area was converted into barren land area; about 48.32 km2 vegetation area, about
63.21 km2 agricultural area and 0.25 km2 barren land area was converted into built-up area; about
11.25 km2 sediment area was converted into water body; and about 78.25 km2 water body area was
converted into sediment area (Table 5).
Table 5: Comparative Matrix between 1994 and 2016
4. Conclusions
The study conducted in one of the districts of the Uttarakhand state in the Central Himalaya, viz.,
Dehradun advocates that multi-temporal satellite data are very useful to detect the changes in LULC
quickly and accurately. The study reveals that the major landuse in the Dehradun district are vegetation
cover in 61.47% (1897.82 km2) area, agricultural land in 17.61% (543.67 km2) area, built-up area 6.82%
(210.54 km2) area, barren land 5.91% (182.45 km2) area, sediment area 5.67 % (175 km2) area and
water body 2.53 % (78.07 km2) area. During the last 22 years (1994 to 2016), there has been an
increase of about 163.67 km2 areas in vegetation cover, 83.69 km2 of area in barren land, 110.78 km2
in built-up area and 76.55 km2 in sediment area; and decrease of about 366.78 km2 in agriculture area
and 67.91 km2 in water body. The study depicts that due to indiscriminate sprawl in built-up area the
district, about 48.32 km2 vegetation areas, 63.21 km2 agricultural areas and 0.25 km2 barren land area
was converted into built-up area during the last two decades. Thus, increasing population pressure is
putting tremendous pressure on the land use and land cover in district Dehradun. The approach
adopted in this study has clearly demonstrated the potential of GIS and remote sensing techniques in
measuring the change in LULC pattern.
Acknowledgement
Authors are thankful to the Director, Centre of Excellence for NRDMS in Uttarakhand, Department of
Geography, Kumaun University SSJ Campus Almora for extending laboratory facility and to Er. Pawan
Kumar for technical assistance in data processing.
Category Vegetation Agriculture Barren Built-up Water Sediment 1994
Land Body
Vegetation 1660.25 10.25 9.21 48.32 0 0 1728.00
Agriculture 237.66 533.21 76.32 63.26 0 0 910.45
Barren Land 0.98 0.36 97.25 0.25 0 0 98.84
Built-up 0 0.00 0 98.65 0 0 98.65
Water Body 0 0.00 0 0.00 67.58 78.25 145.83
Sediment 0.25 0.00 0 0.00 11.25 87.25 98.75
2016 1899.14 543.82 182.78 210.48 78.83 165.50
IJARSG– An Open Access Journal (ISSN 2320 –
0243)
International Journal of Advanced Remote Sensing and GIS 2213
References
Abdelhamid, A. 2006. Urban Development and Planning in the Occupied Palestinian Territories:
Impacts on Urban Form. The Conference on Nordic and International Urban Morphology: Distinctive
and Common Themes, Stockholm, Sweden.
Barnes, K.B., Morgan, I., Roberge, J.M. and Lowe, M.C. 2001. Sprawl Development: Its patterns,
Consequences, and Measurement. Towson University, Towson.
Cohen, B. 2006. Urbanization in developing countries: Current trends, future projections, and key
challenges for sustainability. Technology in Society, 28(2), pp.63-80.
Epstein, J., Payne, K. and Kramer, E. 2002. Techniques for mapping suburban sprawl. Photogrammetric
Engineering & Remote Sensing, 63(9), pp.913-918.
Heuvelink, G.B.M. and Burrough, P.A. 2002. Developments in statistical approaches to spatial
uncertainty and its propagation. International Journal of Geographical Information Science, 16(2),
pp.111-113.
Jokar Arsanjani, J., Helbich, M. Kainz, W. and Darvishi Boloorani, A. 2013. Integration of logistic
regression, Markov chain and cellular automata models to simulate urban expansion. International
Journal of Applied Earth Observation and Geoinformation, 21, pp.265-275.
Kiefer Lillesand, T. 1987. Remote sensing and image interpretation. 5th ed. New York: John Wiley &
Sons. p.721.
Krivoruchko, K., Crawford, C.A.G. and Redlands, C.A. 2005. Assessing the uncertainty resulting from
geoprocessing operations. In: Maguire, D.J. Batty, M. and Goodchild, M.F. (eds.) GIS Spatial Analysis,
and Modeling. Redlamds, CA: ESRI Press, pp.67-92.
Lo, C.P. and Yang, X. 2002. Drivers of land-use/land-cover changes and dynamic modeling for the
Atlanta, Georgia metropolitan area. PE & RS-Photogrammetric Engineering & Remote Sensing,
68(10), pp.1073-1082.
Pontius, G.R. and Malanson, J. 2005. Comparison of the structure and accuracy of two land change
models. International Journal of Geographical Information Science, 19(2), pp.243-265.
Rawat Neelam,Thapaliyal A.,Purohit S., Negi,G.S.,Dangwal S., Rawat,S, Aswal A., and Kimothi M.M.
2016. Vegetation loss andecosystem distyrbances on Kedargad Mandakini subwatershed in
Rudrapryag duistrict of Uttarakhand due to torrential rainfall during 2013. International Journal of
Advanced Rmote Sensing and GIS, 5,pp.1662-1669.
Rawat, J.S., Kumar, M. and Biswas, V. 2013a. An integrated approach of remote sensing and GIS for
land use/cover change detection: a case study of Bhimtal Tourist Town (India). Bulletin of
Environmental and Scientific Research, 2(23), pp.1-6.
Rawat, J.S., Biswas, V. and Kumar, M. 2013b. Changes in land use/cover using geospatial techniques -
A case study of Ramnagar town area, district Nainital, Uttarakhand, India. The Egyptian Journal of
Remote Sensing and Space Sciences, 16, pp.111-117.
IJARSG– An Open Access Journal (ISSN 2320 –
0243)
International Journal of Advanced Remote Sensing and GIS 2214
Rawat, J.S., Manish, K. and Pathak, R.N. 2013c. Spatio temporal dynamics of Almora town Area, India.
International Journal of Advanced Remote Sensing and GIS, 2(1), pp.425-432.
Rawat, J., Vivekananda Biswas and Manish Kumar. 2013d. Quantifying Land Use/Cover Dynamics of
Nainital Town (India) Using Remote Sensing and GIS Techniques. Asian Journal of Geoinformatics,
13(2), pp.6-12.
Rawat, J.S., Manish Kumar and Vivekananda Biswas. 2014. Land use/cover dynamics using multi-
temporal satellite imagery - A case study of Haldwani town area, district Nainital, Uttarakhand, India.
International Journal of Geomatics and Geosciences, 4(3), pp.536-543.
CH. 2011. Census Handbook 2011.
Singh, A., Singh, S., Garga, P.K. and Khanduri, K. 2013. Land Use and Land Cover Change Detection:
A Comparative Approach using Post Classification Change Matrix Function Change Detection
Methodology of Allahabad City. International Journal of Current Engineering and Technology, 3(1),
pp.142-148.
Torrens, P.M. and Alberti, M. 2000. Measuring sprawl. Working paper no. 27, Centre for Advanced
Spatial Analysis, University College, London.
Ye, B. and Bai, Z. 2008. Simulating land use/cover changes of Nenjiang County based on CAMarkov
model. Computer and Computing Technologies in Agriculture, I, pp.321-329.
Zhang, R., Tang, C., Ma, S., Yuan, H., Gao, L. and Fan, W. 2011. Using Markov chains to analyze
changes in wetland trends in arid Yinchuan Plain, China. Mathematical and Computer Modelling, 54(3),
pp.924-930.
Zubair, A.O. 2006. Change detection in land use and land cover using Remote Sensing data and GIS,
A case study of Ilorin and its environs in Kwara State. M.Sc. Thesis, Department of Geography,
University of Ibadan.

Research paper

  • 1.
    Cloud Publications International JournalofAdvanced Remote Sensing and GIS 2017,Volume 6, Issue 1,pp. 0000-0000 ISSN 2320 – 0243, Crossref: ______________________________________________________________________________________________________ Land Use/Land Cover Change Study of District Dehradun, Uttarakhand using Remote Sensing and GIS Technologies Varun Rawat and Mansi Puri Department of Computer Science, DIT University Dehradun, Uttrakhand, India Publication Date: DOI: Copyright © 2017 Varun Rawat and Mansi Puri. This is an open access article distributed under the Creative Commons Attribution License, which permits unrestricted use, distribution, and reproduction in any medium, provided the original work is properly cited. Abstract The present study illustrates an integrated approach of geospatial technologies, i.e., remote sensing and GIS for assessment of land use/cover dynamics of a district of the Uttarakhand State viz., the Dehradun. Landsat satellite imageries of three different years, i.e., Landsat Thematic Mapper (TM) of 1994, 1999 and 2016 were acquired by USGS Earth Explorer and quantified the land use/cover changes in district Dehradun for a period of more than two decades. Supervised Classification methodology has been employed using Maximum Likelihood Technique in ERDAS 9.3. The images of the study area were categorized into six different land us/land cover classes, viz., vegetation area (in 61.47% area), agricultural land (17.61%), built-up area (6.82%), barren area (5.91%), sediment area (5.67%) and area under water body (2.53%). The results indicate that during the last twenty two years (1994-2016) the vegetation area, built-up area, barren land and sediment area have been increased about 163.67 km2, 110.78 km2, 83.69 km2 and 78.55 km2, respectively, while the agricultural land and water body have been decreased about 366.78 km2 and 67.91 km2, respectively. The approach adopted in this study has clearly demonstrated the potential of remote sensing and GIS techniques in measuring the change pattern of land use/cover. Keywords Change detection; Geospatial Technologies; Remote Sensing; GIS; District Dehradun 1. Introduction The land is one of the most important natural resources as life and various development activities are based on it. Land cover is a fundamental parameter describing the Earth’s surface. This parameter is a considerable variable that impacts on and links many parts of the human and physical environments (Torrens and Alberti, 2000; Barnes et al., 2001). Land use refers to human activities which are directly related to the land (Epstein et al., 2002). Land use involves the management and modification of natural environment or wilderness into built environment such as fields, pastures, and settlements. Land use/land cover (LULC) changes are driven by natural forces or by human land uses. Thus, it involves both the natural and the human dimensions. Information on LU/LC is important to support planning and sustainable management of natural resources and socio-economic development (Rawat et al., 2013a; b; Zubair et al., 2006). The land is one of the most important natural resources, as life and various development activities are based on it. Land-cover change has been identified as one of the most important drivers of changes in the ecosystem and their services. Research Article
  • 2.
    IJARSG– An OpenAccess Journal (ISSN 2320 – 0243) International Journal of Advanced Remote Sensing and GIS 2205 Locally, the land cover changes due to an environment or climatic factors determine the vulnerability of people to climatic perturbations and thus affect the decisions on land use by people. Globally , on the other hand, the land cover changes significantly affecting the functioning of Earth's system. Hence, information on land use/land cover is essential for the selection, planning and implementation of land use and can be used to meet the increasing demands for basic human needs and welfare. This information also assists in monitoring the dynamics of land use resulting out of changing demands of increasing population. Changes in land cover by land use patterns, affects biodiversity, water and other processes that come together to affect climate and biosphere. Changes in LU/LC now have become the central component in current strategies for managing of the land use pattern in any area (Abdelhamid et al., 2006; Ye Bai et al., 2008; Lo Yang et al., 2002; Cohen et al., 2006; Heuvelink and Burrough et al., 2002). LU/LC change detection is very essential for better understanding of landscape dynamic during a known period of time having sustainable management (Lillesand et al., Kiefer et al., 1987; Zhang et al., 2011) and to asses loss and ecosystem disturbances (Rawat,2016). LU/LC change is a widespread and accelerating process, mainly driven by natural phenomena and anthropogenic activities, which in turn drive change that would impact natural ecosystem. Timely and precise information about LULC change detection of Earth’s surface is extremely important for understanding relationships and interactions between human and natural phenomena for better management of decision making (Pontius and Malanson et al., 2005; Jokar et al., 2013). Research conducted in Ethiopia has shown that there were considerable LULC changes in the country during the second half of the 20th. Timely and precise information about LULC change detection of Earth’s surface is extremely important for understanding relationships and interactions between human and natural phenomena for better management of decision making (Krivoruchko and Redlands et al., 2005). Recent LU/LC studies in the Uttarakhand State in Central Himalaya reveals that due to population pressure, towns are growing indiscriminately on the highly fertile agricultural lands (Rawat et al., 2013a;2013b;2013c;2013d; 2014) The present study aims to demonstrate application of geospatial technologies, i.e., remote sensing and GIS in land use/ land cover study and to define its dynamics since the last few decades. 2. Material and Methodology 2.1. Study Area The study area, viz., district Dehradun is one of the total thirteen districts of the Uttarakhand state (Figure 1) where the capital of the State –Dehradun lies. District Dehradun, encompassing an area of 3088.50 km2, extends in between 29o 57’56.44” N to 31 o1’127.13” N Latitudes and 77o 38’19.57” E to 78.1424.53” E Longitudes. The elevation of the district varies in between 288 m to 3096 m from the mean sea level. Attitudinally about one-third part (i.e., 32.43% area) of the district lies in between 600m to 1200m relief region while a small part (3.55% area) lies in the relief zone more than 2400m. The district has 6 development blocks, 6 tehsils and 771 villages with population of 5, 69,578 having a population density of 184 persons/km2 (SH, 2011) 2.2. Data Process and Data Use
  • 3.
    IJARSG– An OpenAccess Journal (ISSN 2320 – 0243) International Journal of Advanced Remote Sensing and GIS 2206 The LANDSAT is a scientific program which is operated by NASA and USGS, which offers the longest global record of Earth's surface. The satellite data used in the present study includes the imagery of LANDSAT-5 "TM", LANDSAT-7 "ETM" And LANDSAT-8 "OLI" & "TIRS" Sensor. The LANDSAT-5 imagery is of February 1994, LANDSAT-7 imagery is of March 2000, and LANDSAT- 8 is of February 2016 with the resolution of 30m nominal and panchromatic resolution is 15m. Map projection used in "UTM" datum “WGS84" and UTM zone is 44. 2.3. Software used In this study, ERDAS IMAGINE-9.3 remote sensing application with raster graphics editor abilities designed by ERDAS is used. ERDAS IMAGINE is aimed primarily at geospatial raster data processing and allows the user to prepare, display and enhance the digital image for mapping use in GIS or software. Figure 1: Location map of the study area, viz., Dehradun District 2.4. Image Classification Multispectral classification is the process of sorting pixels into a finite number of individual classes or categories of data, based on their data file values. If a pixel satisfies a certain set of criteria, the pixel is assigned to the class that corresponds to that criterion. This process is also referred to as image segmentation. Depending on the type of information to be extracted from the origin data, classes may be associated with known features on the ground or may simply represent areas that look different to the computer. An example of a classified image is a land cover map, showing vegetation, bare land, pasture, urban and so forth. In this study we have used supervised image classification map, one common application of remotely-sensed images to land management is the creation of maps, vegetation type, or other discrete classes by remote sensing software. The flow chart (Figure 2)
  • 4.
    IJARSG– An OpenAccess Journal (ISSN 2320 – 0243) International Journal of Advanced Remote Sensing and GIS 2207 illustrates methodology used in this paper which includes data used and different steps of data processing. 2.5. Accuracy Assessment In the context of information extraction by image analysis, accuracy measures the agreement between a standard assumed to be correct and a classified image of unknown quality (Singh et al., 2013). The accuracy of image classification is most often reported as a percentage correction. The consumer's accuracy (CA) is computed using the number of correctly classified pixels to the total number of pixels assigned to a particular category. It takes errors of the commission into account by telling the consumer that, for all areas identified as category X, a certain percentage are actually correct. The producer's accuracy (PA) informs the image analyst of the number of pixels correctly classified in a particular category as a percentage of the total number of pixels actually belonging to that category in the image. Producer's accuracy measures errors of the omission. 2.6. Error Matrix One of the most common means of expressing classification accuracy is the preparation of a classification error matrix. Error matrices compare, on a category by category basis, the relationship between known reference data (ground truth) and the corresponding result of an automated classification. Such matrices are square, with the number of rows and columns equal to the number of categories whose classification accuracy is being assessed. Overall accuracy is computed by dividing the total number of correctly classified pixels by the total number of reference pixels. The accuracies of individual categories can be calculated by dividing the number of correctly classified pixels in eac h category by either the total number of pixels in the corresponding row and column. Producers accuracies result from dividing the number of correctly classified pixels in each category (on the major diagonal) by the number of training set pixels used for other categories (the column total). User accuracy is computed by dividing the number of correctly classified pixels in each category by the total number of pixels that were classified in that category (the row total). 3. Results and Discussion 3.1. Land use/Land Cover LULC categories for three different years (i.e., 1994, 2008 and 2016) were assessed using remote sensing and GIS techniques. The results are presented in Figure 3 and Table 1. A brief account of year wise discussion of these results is presented in the following paragraphs. 3.1.1. LULC in 1994- The satellite image of the study area, classification of different LULC of district Dehradun for the year 1994 is presented in Figure 3 (left). In 1994 about 1734.15 km2 which accounts for 56.17% of the total district area was under vegetation cover, about 910.45 km2 which accounts for 29.48% was under agricultural land, about 99.76 km2 which accounts for 3.23% was under built up area, about 98.76 km2 which accounts for 3.20% was under barren land, about145.98 km2 which accounts for 4.73% was in water body and the remaining about 98.45 km2 which accounts for 3.19% of the total district area was under sediment area (Table 1).
  • 5.
    IJARSG– An OpenAccess Journal (ISSN 2320 – 0243) International Journal of Advanced Remote Sensing and GIS 2208 Figure 2: Methodology Chart Figure 3: Land use/Land Cover in 1994, 2008 and 2016 in district Dehradun
  • 6.
    IJARSG– An OpenAccess Journal (ISSN 2320 – 0243) International Journal of Advanced Remote Sensing and GIS 2209 Table 1: Land use/Land Cover pattern in district Dehradun in 1994 Land Category Area(1994) Area (2008) Area (2016) in km2 in % in km2 in % in km2 in % Vegetation Cover 1734.15 56.17 1805.89 58.49 1897.82 61.47 Agricultural Area 910.45 29.49 793.59 25.70 543.67 17.61 Barren Land 98.76 3.20 116.09 3.76 182.45 5.91 Built-up Area 99.76 3.23 130.55 4.23 210.54 6.82 Water Body 145.98 4.73 125.46 4.06 78.07 2.53 SedimentArea 98.45 3.19 115.97 3.76 175.00 5.67 3.1.2 LULC in 2008 - Figure 3 (middle) depicts the geographical distribution of LULC of district Dehradun for 2008. During 2008 in Dehradun district, the total area under agricultural land was about 793.59 km2 which accounts for 25.70% of the total district area. Built-up area was 130.55 km2 which accounts for 4.23%, vegetation area was 1805.89 km2 which accounts for 58.49%, barren land was 116.09 km2 which accounts for 3.76%, water body was 125.46 km2 which account for 4.06% and sediment area was about 115.97 km2 which accounts for 3.76% of the total district area (Table 1). 3.1.3 LULC in 2016 - Figure 3 (left) depicts the geographical distribution of LULC of district Dehradun for 2016. During 2016 in Dehradun district the total distribution of the agriculture area was about 543.67 km2 which accounts for 17.61% of the total district area, built-up area is 210.54 km2 which accounts for 6.82%, vegetation area was1897.82 km2 which accounts for 61.47%, barren land was 182.45 km2 which accounts for 5.91%, water body was 78.07 km2 which accounts for 2.53% area of the district (Table 1). 3.2. LULC Change Detection LULC change detection in district Dehradun was done for three different periods. These are 1994 to 2008, 2008 to 2016 and 1994 to 2016. Results are presented in Figure 4 and Table 2. A brief discussion of these LULC change is presented in the following paragraphs. 3.2.1. Change Detection during 1994-2008 - Figure 4 depicts the status of LULC change in district Dehradun during 1994 to 2008 which reveals that during this period, the vegetation area, built up area, barren land and sediment area have been increased about 71.74 km2, 30.79 km2, 17.33 km2 and 17.52 km2, respectively; while the agricultural land, and water bodies have decreased about 116.86 km2 and 20.52 km2, respectively. 3.2.2. Change Detection During 2008-2016 - Since 1994 to 2008 there has been an increase of 91.93 km2 of area in vegetation area, 66.36 km2 in barren land, 79.99 km2 in built-up area and 59.03 km2 of area in sediment area, and decrease of about 249.92 km2 in agricultural area and 47.39 km2 in water body. 3.2.3. Change Detection During 1994-2016 - Over all during the last 22 years (1994 to 2016), there has been an increase of 163.67 km2 in vegetation area, 83.69 km2 in barren land area, 110.78 km2 in built-up area and 76.55 km2 in sediment area, and decrease of 366.78 km2 in agricultural area and 67.91 km2 in area under water body. From these data, it can be inferred that the built-up and vegetation area is increasing while the water body as well as agriculture area is continuously decreasing in district Dehradun.
  • 7.
    IJARSG– An OpenAccess Journal (ISSN 2320 – 0243) International Journal of Advanced Remote Sensing and GIS 2210 Figure 4: Bar diagramme showing changes in LU/LC during 1994-2008 (upper), 2008-2018 (middle) and 1994- 2016 (lower) in the Dehradun district Table 2: LULC change in district Dehradun during different periods Land Category 1994-2008 2008-2016 1994-2016 km2 km2 km2 Vegetation 71.74 91.93 163.67 Agricultural Land -116.86 -249.92 -366.78 Barren Land 17.33 66.36 83.69 Built-up Area 30.79 79.99 110.78 Water Body -20.52 -47.39 -67.91
  • 8.
    IJARSG– An OpenAccess Journal (ISSN 2320 – 0243) International Journal of Advanced Remote Sensing and GIS 2211 3.3. LULC Change Matrix How much LULC has been changed from one category of land to another category? To define this problem, Change Matrix was calculated for different durations, i.e., 1994-2008 (Table 3), 2008-2016 (Table 4) and 1994-2016 (Table 5). A brief account of these Change Matrices is given in the following paragraphs. 3.3.1. Change Matrix 1994 and 2008 - In district Dehradun, during 1994-2008, about 97.01 km2 agricultural land area, 2.12 km2 sediment area and 0.85 km2 barren land area was converted in to vegetation area; about 12.65 km2 agricultural land and 0.65 km2 barren land was converted into agricultural area; about 17.08 km2 agricultural area and 3.01 km2 vegetation area was converted in to barren area; 12.67 km2 vegetation area and 12.77 km2 agricultural area and 6.21 km2 barren land area was converted into built-up area; about 1.1 km2 sediment area was converted into water body; and 21.62 km2 area of water body was converted in to sediment area (Table 3). Table 3: Comparative Matrix between 1994 and 2008 Category Vegetation Agriculture Barren Built- Water Sediment 1994 Land up Body Vegetation 1705.83 12.65 3.01 12.67 0 0 1734.16 Agriculture 97.01 783.59 17.08 12.77 0 0 910.45 Barren 0.85 0.65 96.36 6.21 0 0 104.07 Built-up 0 0.00 0 98.90 0 0 98.90 Water Body 0 0.00 0 0.00 124.36 21.62 145.98 Sediment 2.12 0.00 0 0.00 1.1 95.30 98.52 2008 1805.81 796.89 116.45 130.55 125.46 116.92 3.3.2. Change Matrix 2008 and 2016 - In district Dehradun, during 1994-2008, about 164.92km2 agricultural land area and 8.05km2 barren land area was converted in to vegetation area; about 29.85km2 vegetation area and 1.25 km2 barren land area was converted into agricultural land area; about 67.32 agricultural land area and 10.21 agricultural land area was converted into barren land; about 40.25 km2 forest area , 47.32 km2 agricultural area and 2.02 km2 barren land area was converted into built up area; about 70.13 km2 area of water body was converted into sediment area; and about 13.03 km2 sediment area was converted into water body (Table 4). Table 4: Comparative Matrix between 2008 and 2016 Category Vegetation Agriculture Barren Built- Water Sediment 2008 Land up Body Vegetation 1725.30 29.85 10.21 40.25 0 0 1805.6 Agriculture 164.92 512.57 67.32 47.32 0 0 792.13 SedimentArea 17.52 59.03 76.55
  • 9.
    IJARSG– An OpenAccess Journal (ISSN 2320 – 0243) International Journal of Advanced Remote Sensing and GIS 2212 Barren Land 8.05 1.25 105.08 2.02 0 0 116.40 Built-up 0 0.00 0 120.45 0 0 120.45 Water Body 0 0.00 0 0.00 65.32 70.13 135.45 Sediment 0.9 0.00 0 0.00 13.02 101.87 115.79 2016 1899.17 543.67 182.61 210.04 78.34 172.00 3.3.3. Change Matrix 1994 and 2016 - In district Dehradun, over all within the last 22 years (i.e., during 1994-2016) about 237.66 km2 area of agricultural land, 0.98 km2 area of barren land and 0.25 km2 sediment area was converted in to vegetation area; about 10.25 km2 vegetation area and 0.36 km2 barren land area was converted into agricultural land; about 76.32 km2 agricultural land area and 9.21 km2 vegetation area was converted into barren land area; about 48.32 km2 vegetation area, about 63.21 km2 agricultural area and 0.25 km2 barren land area was converted into built-up area; about 11.25 km2 sediment area was converted into water body; and about 78.25 km2 water body area was converted into sediment area (Table 5). Table 5: Comparative Matrix between 1994 and 2016 4. Conclusions The study conducted in one of the districts of the Uttarakhand state in the Central Himalaya, viz., Dehradun advocates that multi-temporal satellite data are very useful to detect the changes in LULC quickly and accurately. The study reveals that the major landuse in the Dehradun district are vegetation cover in 61.47% (1897.82 km2) area, agricultural land in 17.61% (543.67 km2) area, built-up area 6.82% (210.54 km2) area, barren land 5.91% (182.45 km2) area, sediment area 5.67 % (175 km2) area and water body 2.53 % (78.07 km2) area. During the last 22 years (1994 to 2016), there has been an increase of about 163.67 km2 areas in vegetation cover, 83.69 km2 of area in barren land, 110.78 km2 in built-up area and 76.55 km2 in sediment area; and decrease of about 366.78 km2 in agriculture area and 67.91 km2 in water body. The study depicts that due to indiscriminate sprawl in built-up area the district, about 48.32 km2 vegetation areas, 63.21 km2 agricultural areas and 0.25 km2 barren land area was converted into built-up area during the last two decades. Thus, increasing population pressure is putting tremendous pressure on the land use and land cover in district Dehradun. The approach adopted in this study has clearly demonstrated the potential of GIS and remote sensing techniques in measuring the change in LULC pattern. Acknowledgement Authors are thankful to the Director, Centre of Excellence for NRDMS in Uttarakhand, Department of Geography, Kumaun University SSJ Campus Almora for extending laboratory facility and to Er. Pawan Kumar for technical assistance in data processing. Category Vegetation Agriculture Barren Built-up Water Sediment 1994 Land Body Vegetation 1660.25 10.25 9.21 48.32 0 0 1728.00 Agriculture 237.66 533.21 76.32 63.26 0 0 910.45 Barren Land 0.98 0.36 97.25 0.25 0 0 98.84 Built-up 0 0.00 0 98.65 0 0 98.65 Water Body 0 0.00 0 0.00 67.58 78.25 145.83 Sediment 0.25 0.00 0 0.00 11.25 87.25 98.75 2016 1899.14 543.82 182.78 210.48 78.83 165.50
  • 10.
    IJARSG– An OpenAccess Journal (ISSN 2320 – 0243) International Journal of Advanced Remote Sensing and GIS 2213 References Abdelhamid, A. 2006. Urban Development and Planning in the Occupied Palestinian Territories: Impacts on Urban Form. The Conference on Nordic and International Urban Morphology: Distinctive and Common Themes, Stockholm, Sweden. Barnes, K.B., Morgan, I., Roberge, J.M. and Lowe, M.C. 2001. Sprawl Development: Its patterns, Consequences, and Measurement. Towson University, Towson. Cohen, B. 2006. Urbanization in developing countries: Current trends, future projections, and key challenges for sustainability. Technology in Society, 28(2), pp.63-80. Epstein, J., Payne, K. and Kramer, E. 2002. Techniques for mapping suburban sprawl. Photogrammetric Engineering & Remote Sensing, 63(9), pp.913-918. Heuvelink, G.B.M. and Burrough, P.A. 2002. Developments in statistical approaches to spatial uncertainty and its propagation. International Journal of Geographical Information Science, 16(2), pp.111-113. Jokar Arsanjani, J., Helbich, M. Kainz, W. and Darvishi Boloorani, A. 2013. Integration of logistic regression, Markov chain and cellular automata models to simulate urban expansion. International Journal of Applied Earth Observation and Geoinformation, 21, pp.265-275. Kiefer Lillesand, T. 1987. Remote sensing and image interpretation. 5th ed. New York: John Wiley & Sons. p.721. Krivoruchko, K., Crawford, C.A.G. and Redlands, C.A. 2005. Assessing the uncertainty resulting from geoprocessing operations. In: Maguire, D.J. Batty, M. and Goodchild, M.F. (eds.) GIS Spatial Analysis, and Modeling. Redlamds, CA: ESRI Press, pp.67-92. Lo, C.P. and Yang, X. 2002. Drivers of land-use/land-cover changes and dynamic modeling for the Atlanta, Georgia metropolitan area. PE & RS-Photogrammetric Engineering & Remote Sensing, 68(10), pp.1073-1082. Pontius, G.R. and Malanson, J. 2005. Comparison of the structure and accuracy of two land change models. International Journal of Geographical Information Science, 19(2), pp.243-265. Rawat Neelam,Thapaliyal A.,Purohit S., Negi,G.S.,Dangwal S., Rawat,S, Aswal A., and Kimothi M.M. 2016. Vegetation loss andecosystem distyrbances on Kedargad Mandakini subwatershed in Rudrapryag duistrict of Uttarakhand due to torrential rainfall during 2013. International Journal of Advanced Rmote Sensing and GIS, 5,pp.1662-1669. Rawat, J.S., Kumar, M. and Biswas, V. 2013a. An integrated approach of remote sensing and GIS for land use/cover change detection: a case study of Bhimtal Tourist Town (India). Bulletin of Environmental and Scientific Research, 2(23), pp.1-6. Rawat, J.S., Biswas, V. and Kumar, M. 2013b. Changes in land use/cover using geospatial techniques - A case study of Ramnagar town area, district Nainital, Uttarakhand, India. The Egyptian Journal of Remote Sensing and Space Sciences, 16, pp.111-117.
  • 11.
    IJARSG– An OpenAccess Journal (ISSN 2320 – 0243) International Journal of Advanced Remote Sensing and GIS 2214 Rawat, J.S., Manish, K. and Pathak, R.N. 2013c. Spatio temporal dynamics of Almora town Area, India. International Journal of Advanced Remote Sensing and GIS, 2(1), pp.425-432. Rawat, J., Vivekananda Biswas and Manish Kumar. 2013d. Quantifying Land Use/Cover Dynamics of Nainital Town (India) Using Remote Sensing and GIS Techniques. Asian Journal of Geoinformatics, 13(2), pp.6-12. Rawat, J.S., Manish Kumar and Vivekananda Biswas. 2014. Land use/cover dynamics using multi- temporal satellite imagery - A case study of Haldwani town area, district Nainital, Uttarakhand, India. International Journal of Geomatics and Geosciences, 4(3), pp.536-543. CH. 2011. Census Handbook 2011. Singh, A., Singh, S., Garga, P.K. and Khanduri, K. 2013. Land Use and Land Cover Change Detection: A Comparative Approach using Post Classification Change Matrix Function Change Detection Methodology of Allahabad City. International Journal of Current Engineering and Technology, 3(1), pp.142-148. Torrens, P.M. and Alberti, M. 2000. Measuring sprawl. Working paper no. 27, Centre for Advanced Spatial Analysis, University College, London. Ye, B. and Bai, Z. 2008. Simulating land use/cover changes of Nenjiang County based on CAMarkov model. Computer and Computing Technologies in Agriculture, I, pp.321-329. Zhang, R., Tang, C., Ma, S., Yuan, H., Gao, L. and Fan, W. 2011. Using Markov chains to analyze changes in wetland trends in arid Yinchuan Plain, China. Mathematical and Computer Modelling, 54(3), pp.924-930. Zubair, A.O. 2006. Change detection in land use and land cover using Remote Sensing data and GIS, A case study of Ilorin and its environs in Kwara State. M.Sc. Thesis, Department of Geography, University of Ibadan.