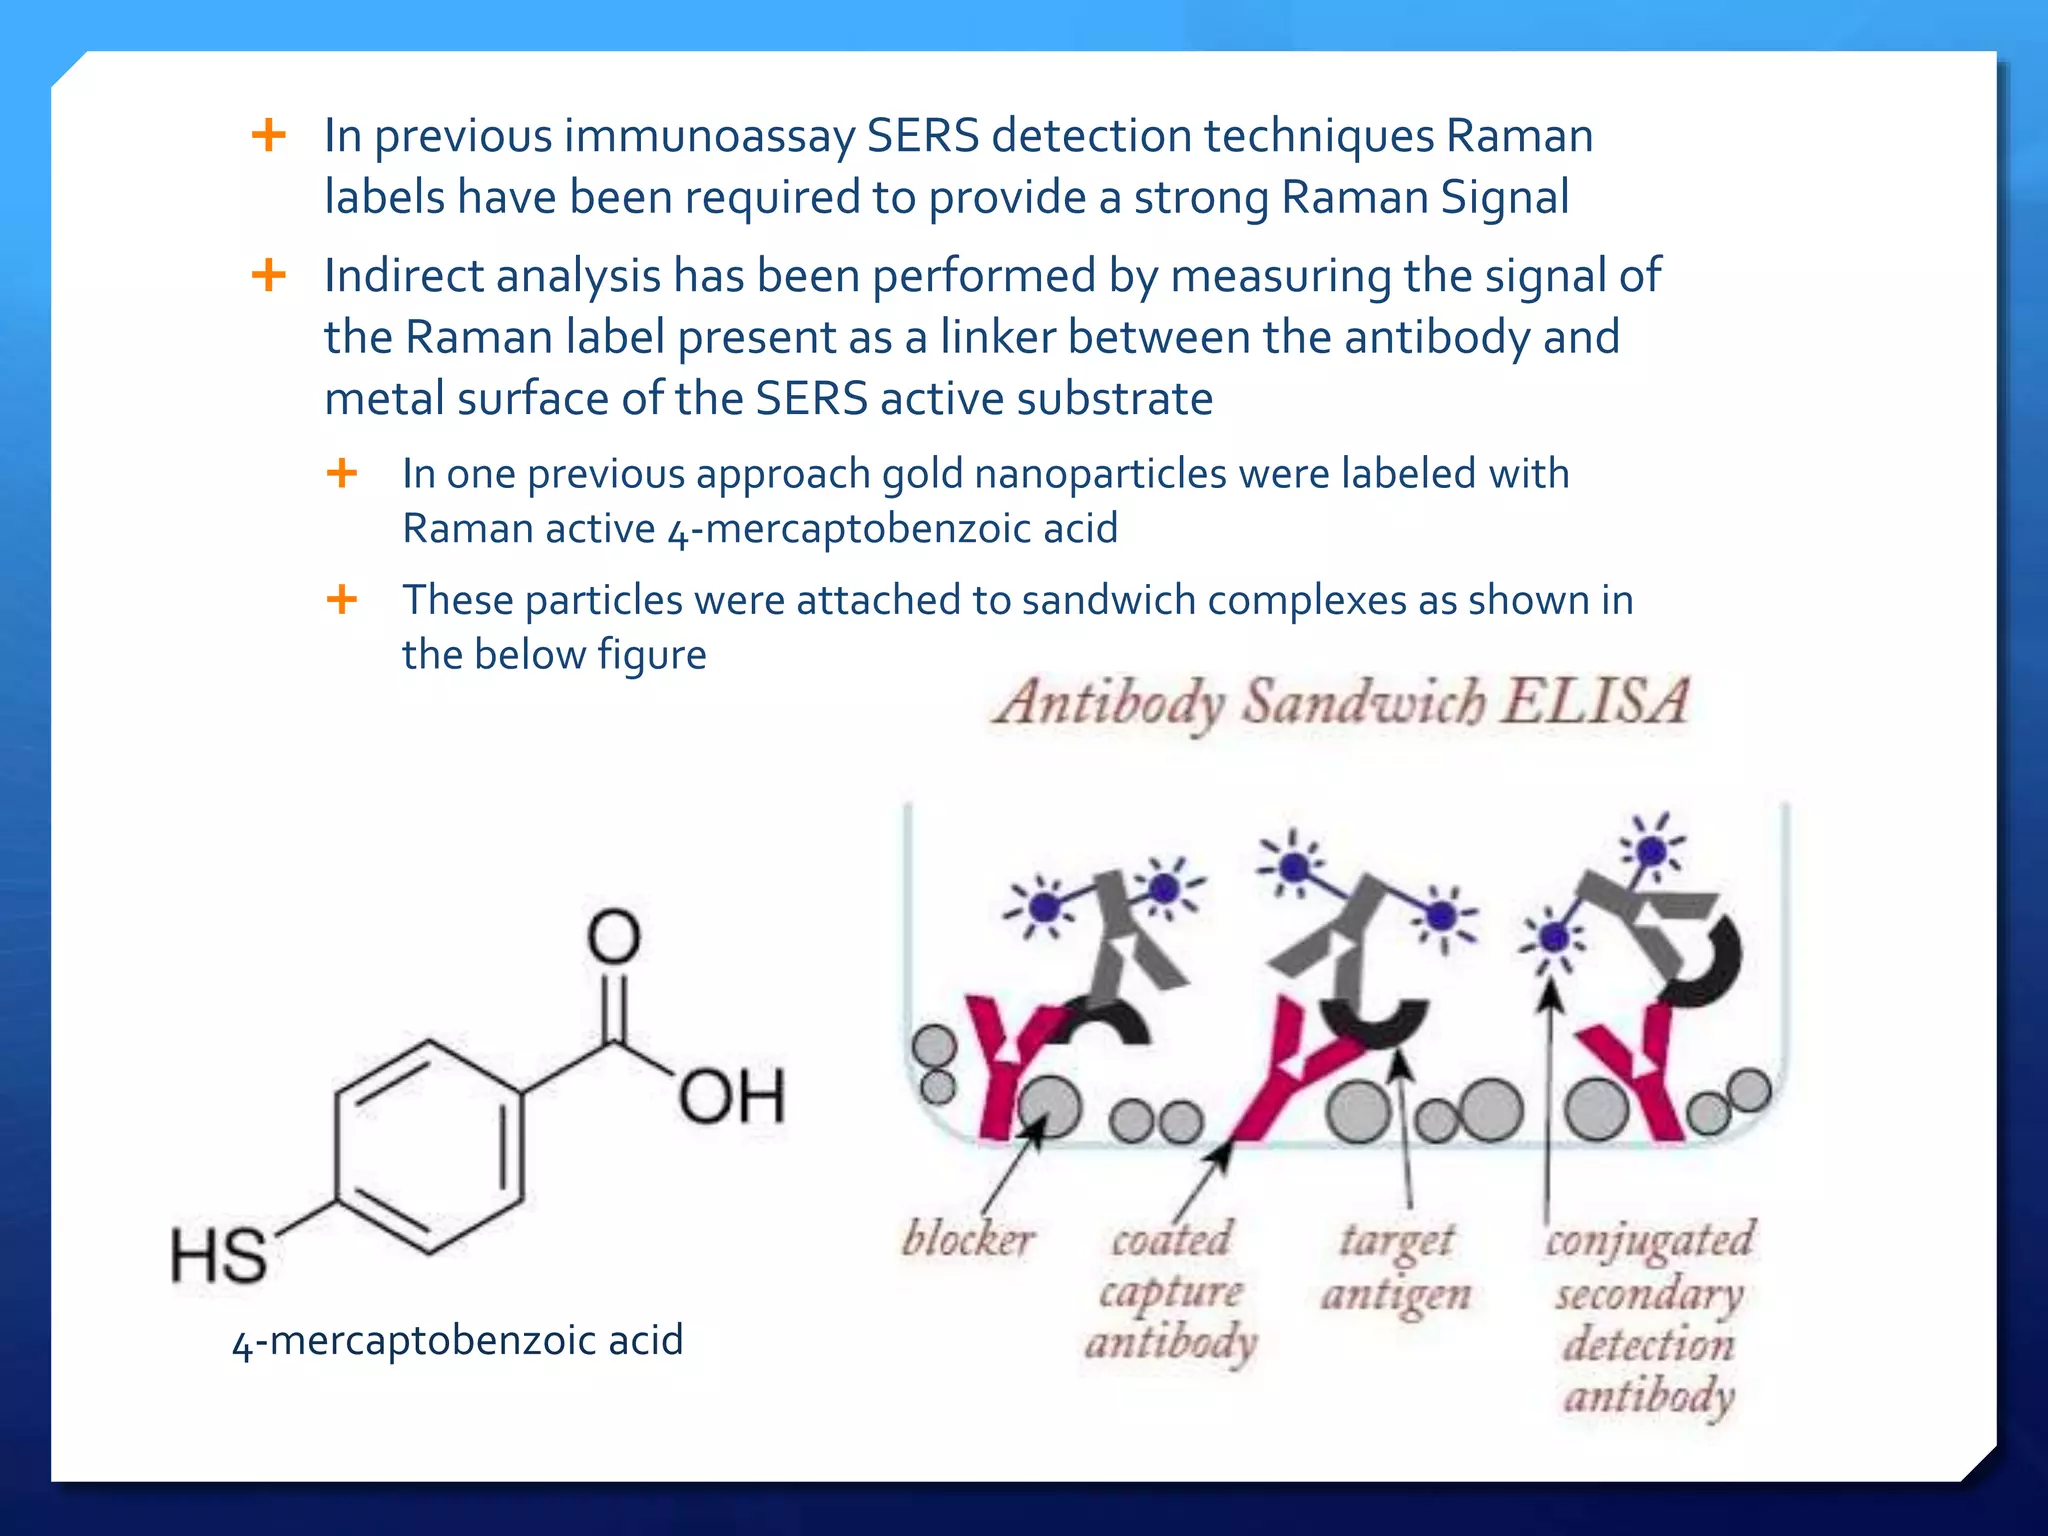
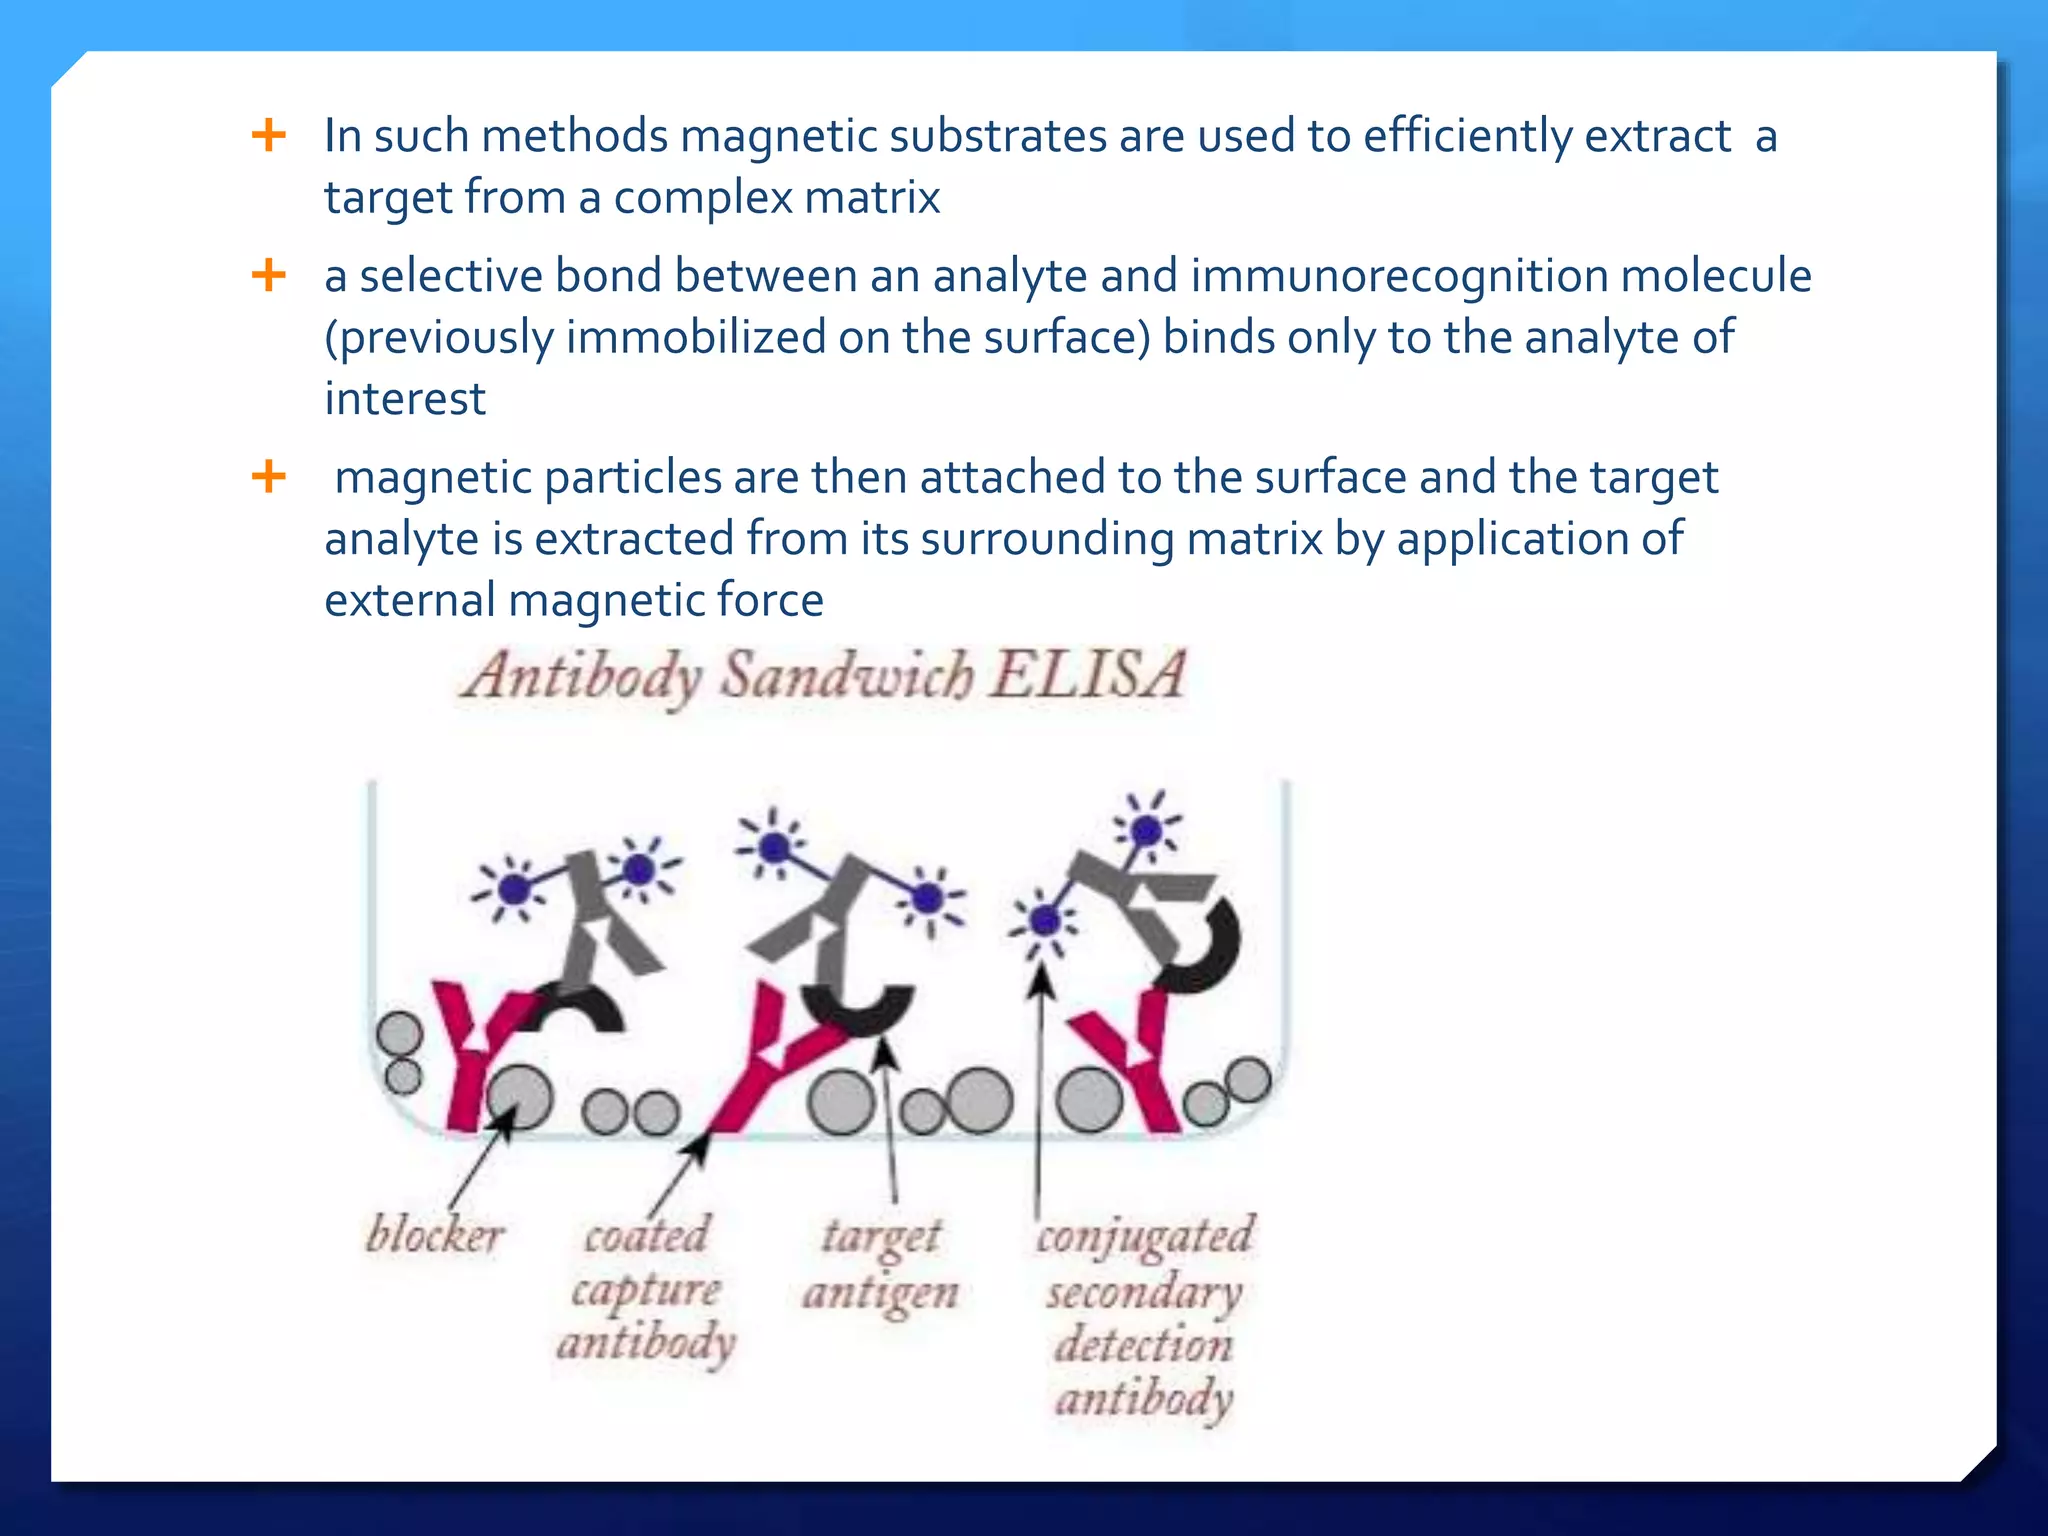
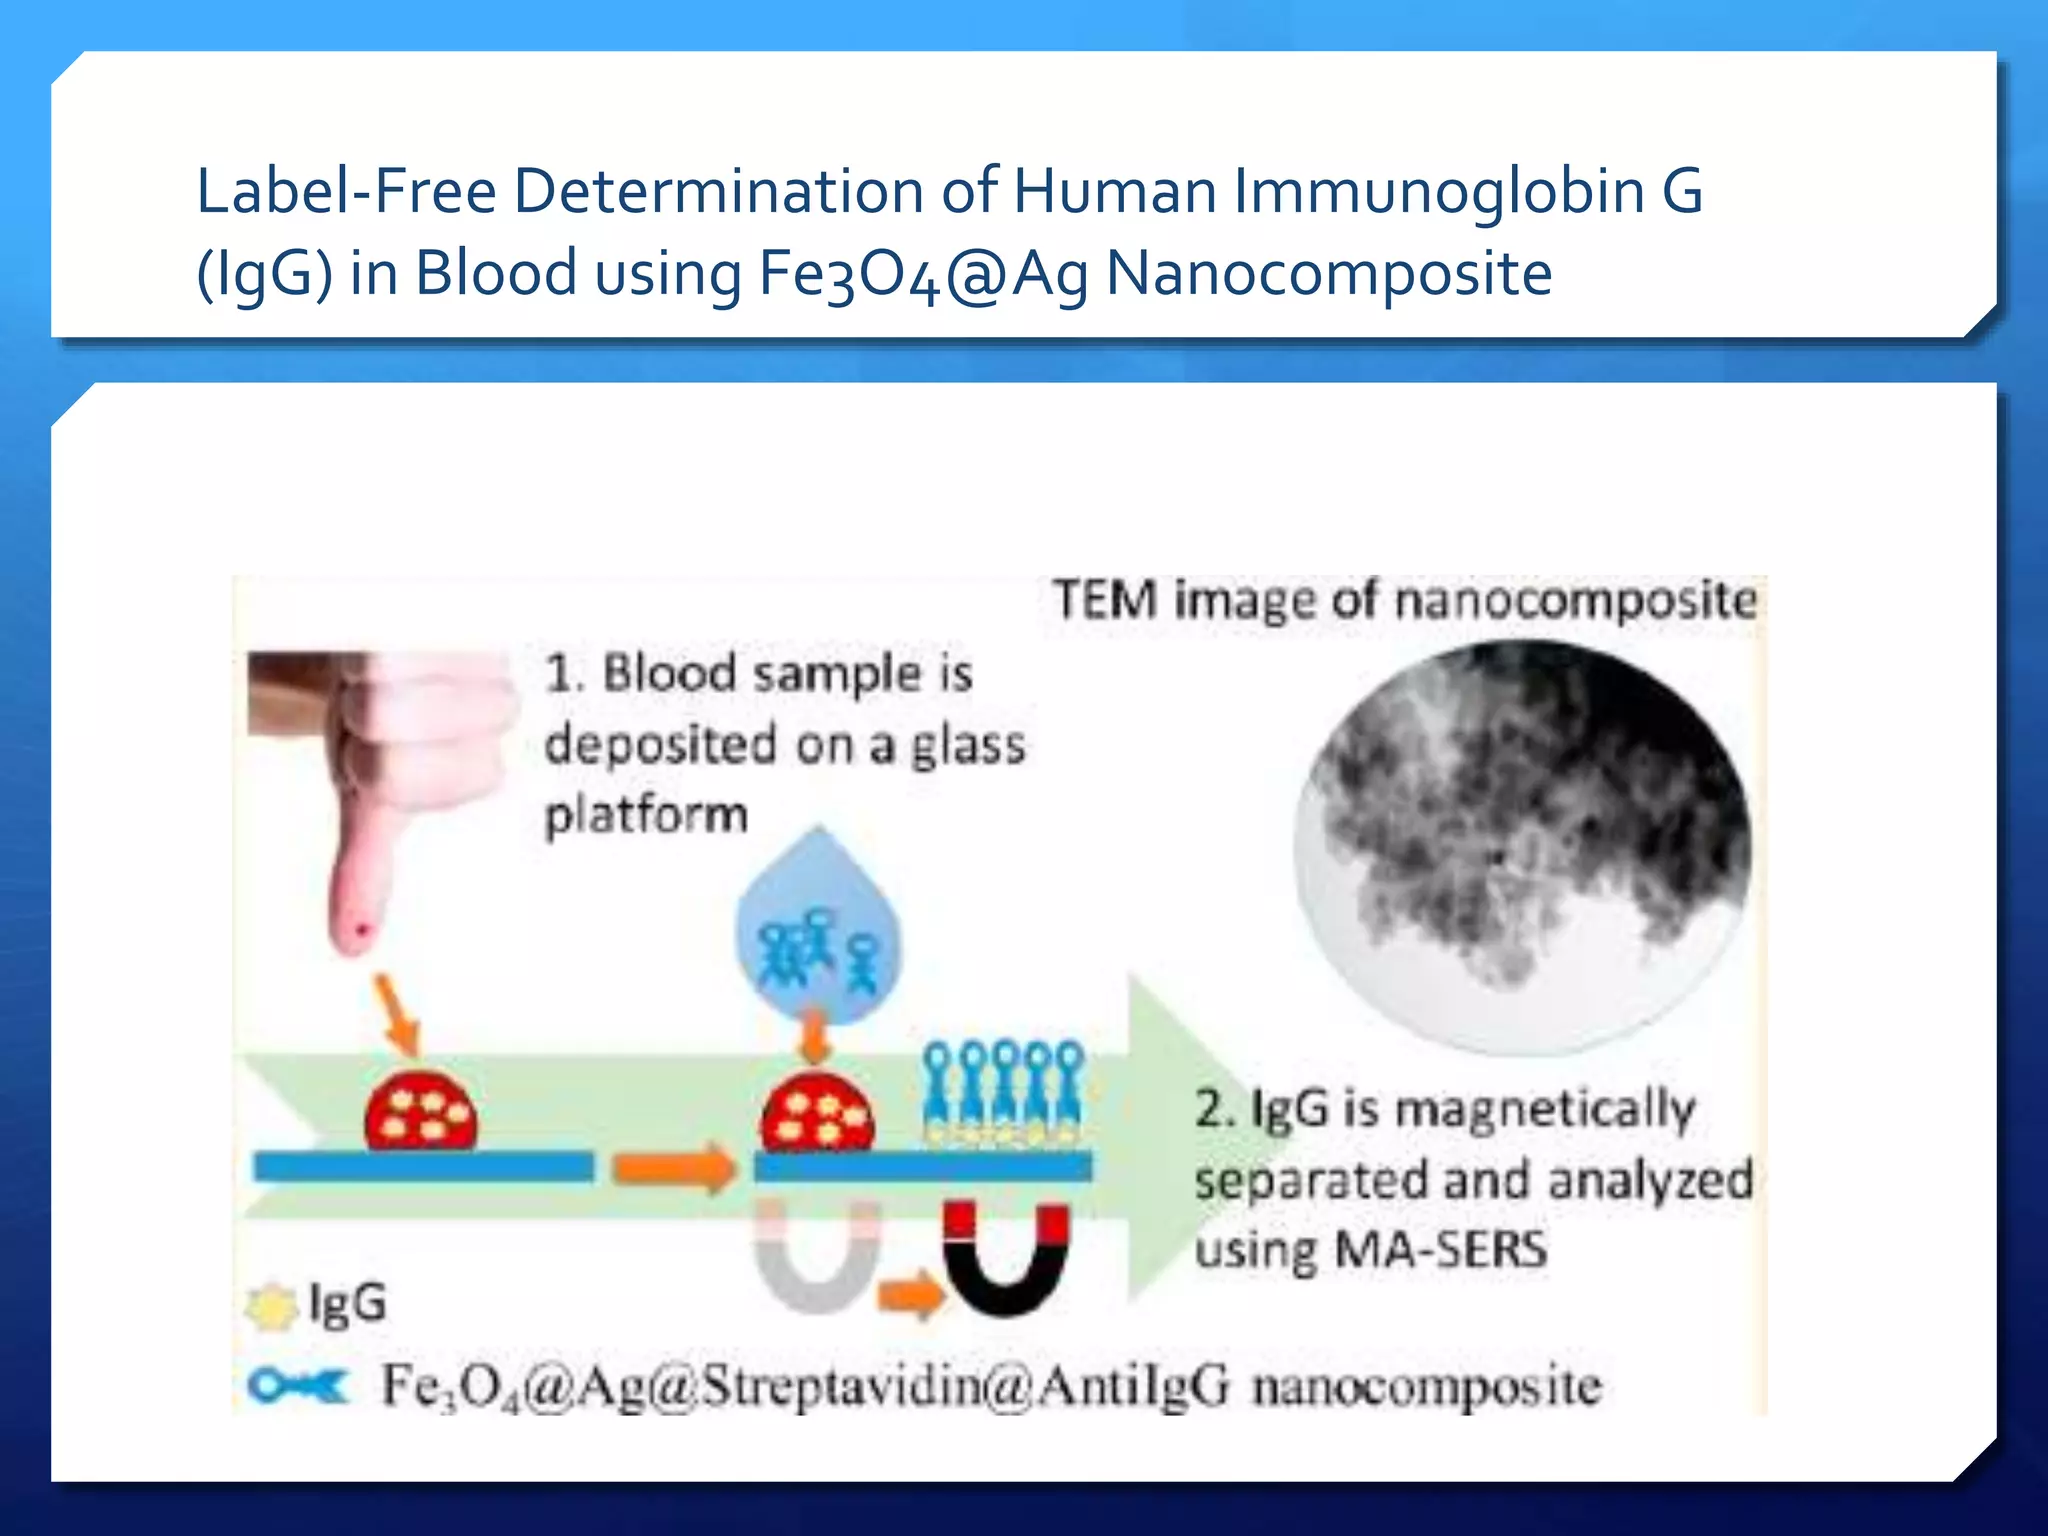
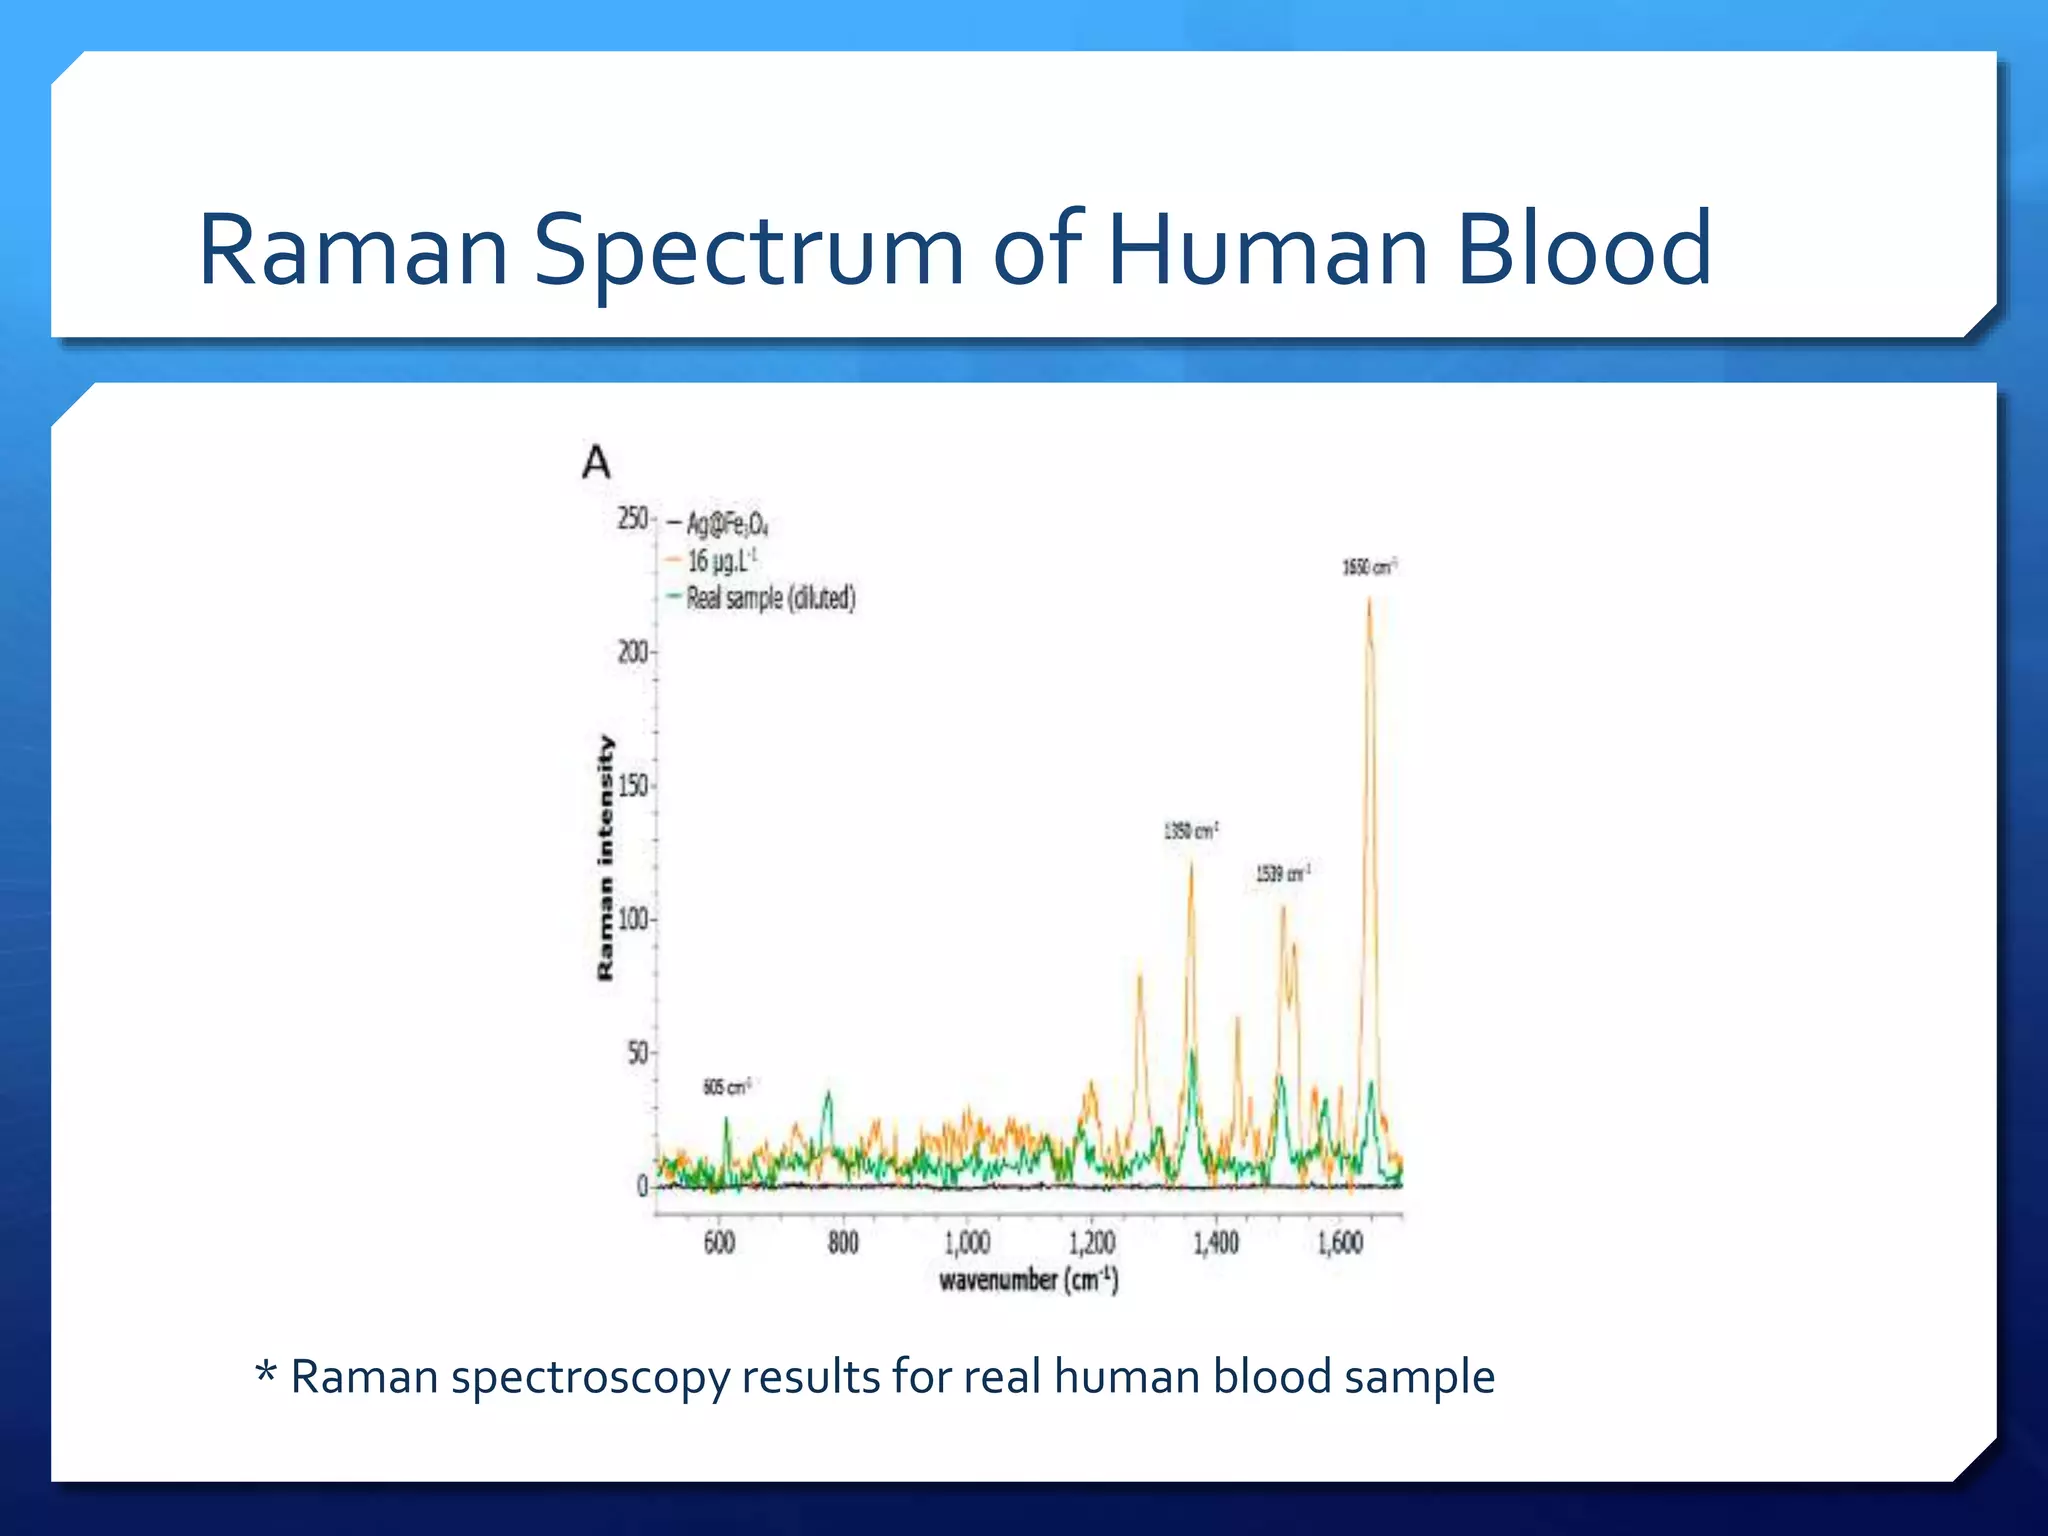
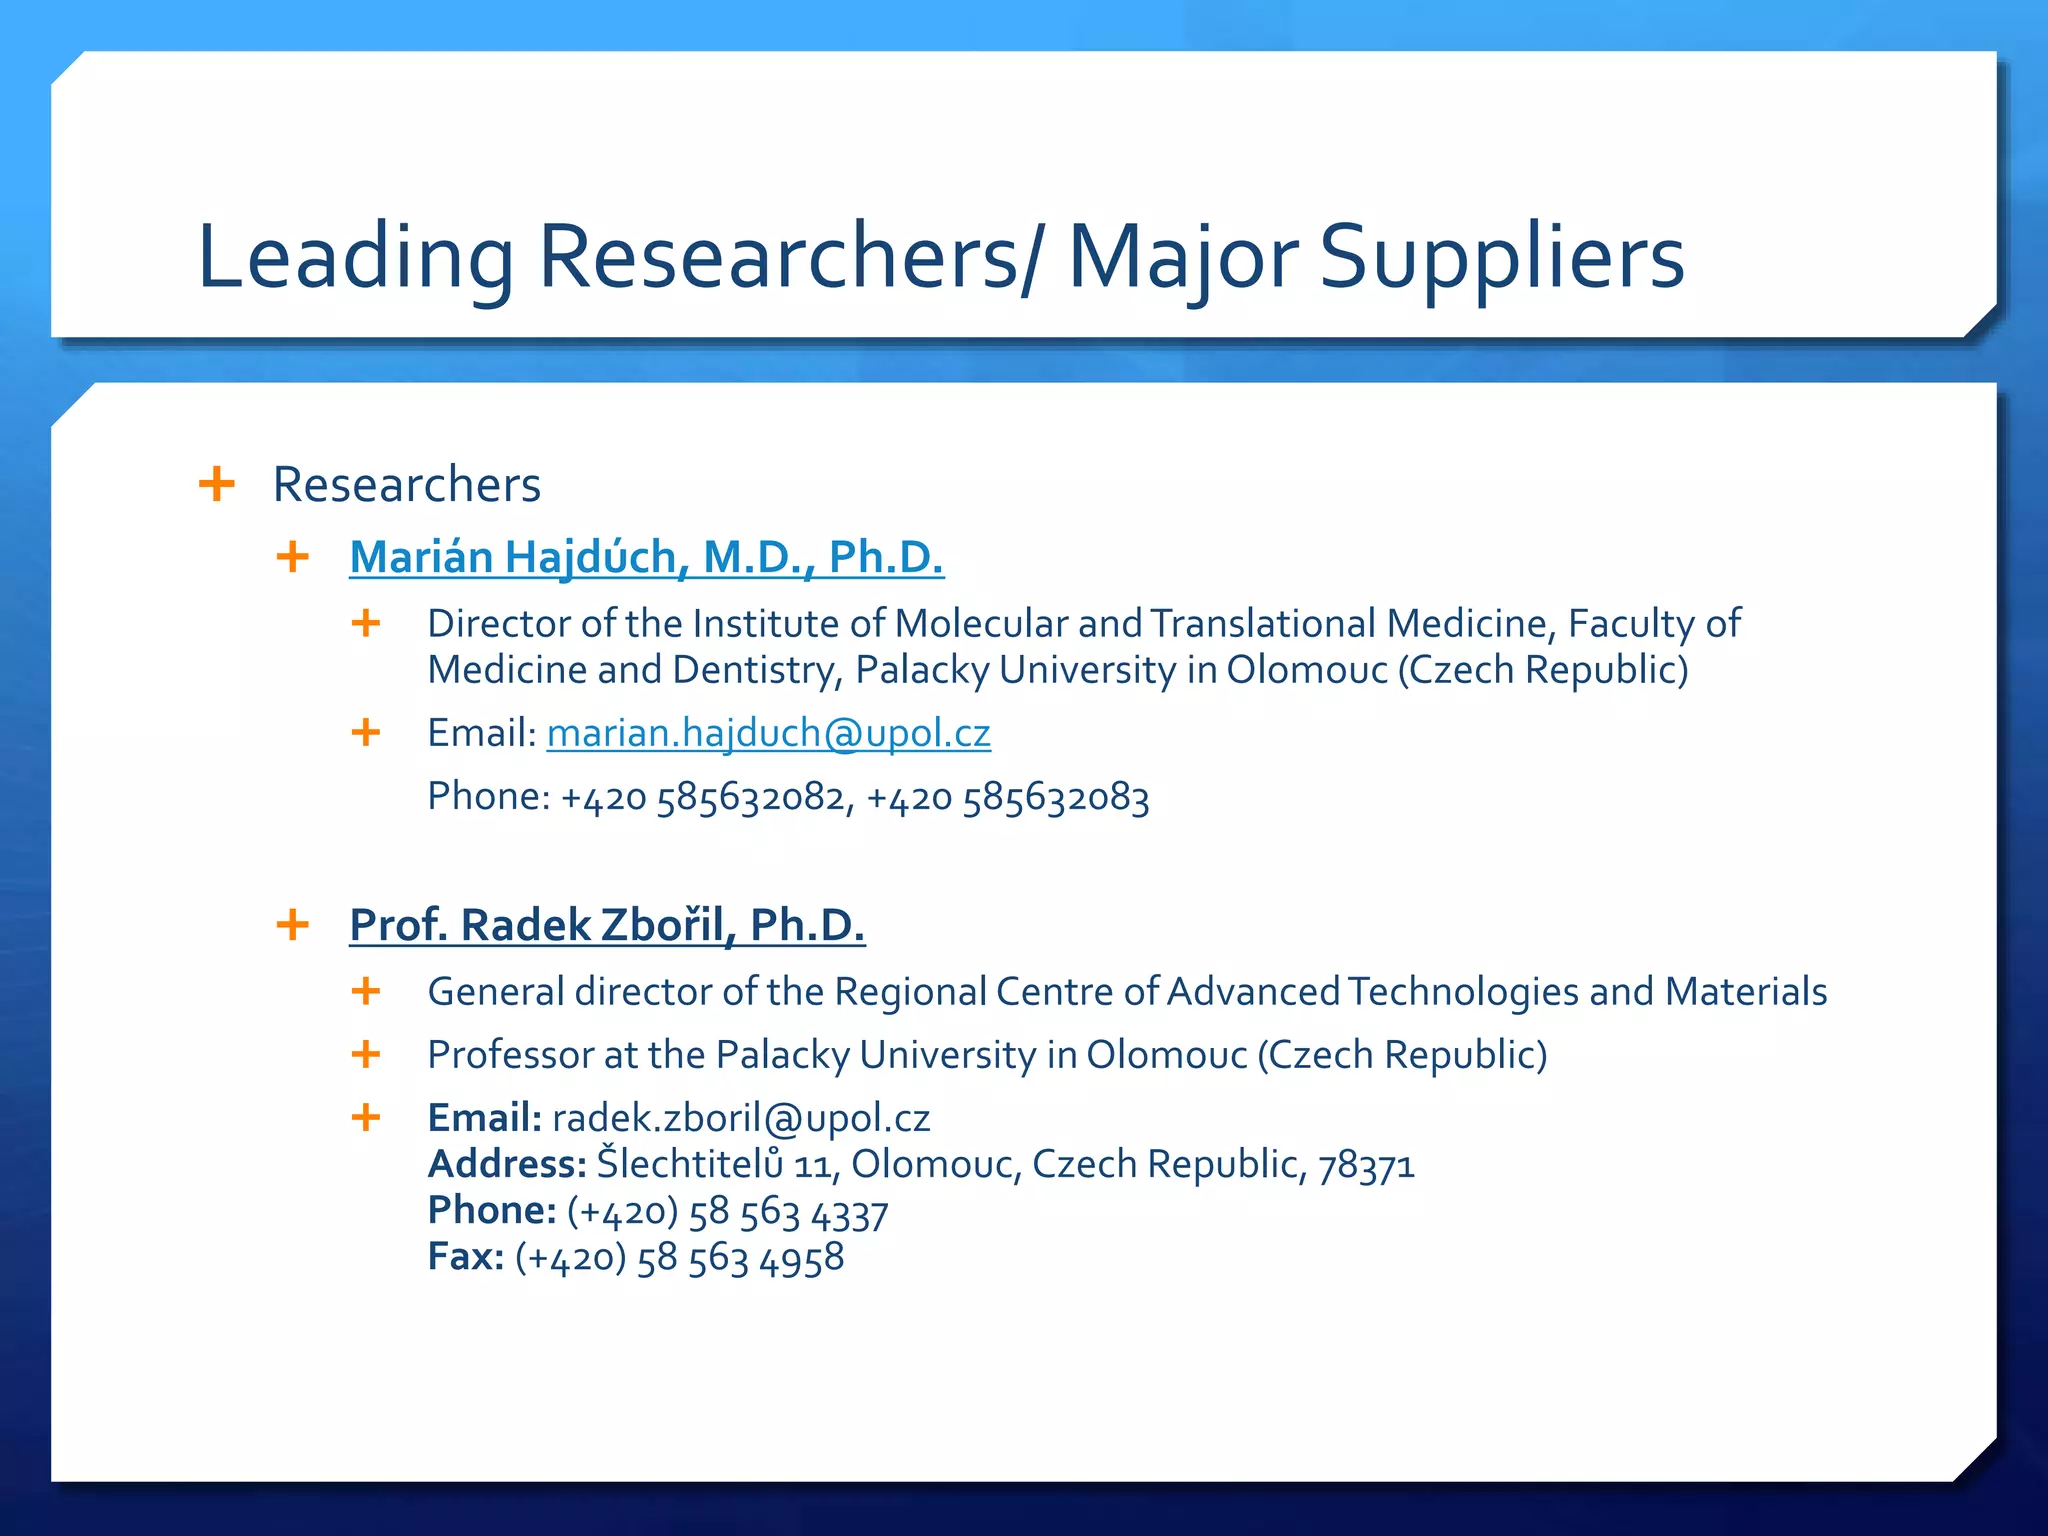
SlideShare a Scribd company logo
MagneticallyAssisted
Surface Enhanced Raman
Spectroscopy(MA-SERS)
An Investigation into the clinical applications of nanocomposite
particles
The Basics: Comparison of Raman and IR
Spectroscopy
 A vibrational spectroscopy
 IR and Raman are the most common vibrational spectroscopies
for assessing molecular motion and fingerprinting species
 Raman is based on inelastic scattering of a monochromatic
excitation source
 Routine energy range: 200 - 4000 cm–1
 Complementary selection rules to IR spectroscopy
 Raman spectroscopy complements IR spectroscopy because, as
we have seen before, not all vibrations result in an IR
absorbance due to lack of dipole moment
The Basics: Comparison of Raman and IR
Spectroscopy
 Raman spectroscopy is a powerful and non-invasive tool for:
 studying molecular vibrations by light scattering
 determining chemical species
 Instead of examining the wavenumber at which a functional group has a vibrational
mode, Raman observes the shift in vibration of the molecule from an incident light
 It complements IR absorption spectroscopy which only results in absorptions if there is a
change in the dipole moment during vibration, symmetric stretches as shown below are
Raman active
 A change in dipole moment is required for a vibrational mode to be IR active, only then
can photons of the same energy as the vibrational state interact
What does Raman Spectroscopy
Measure?
 A change in the polarizability of a bond is required for a vibrational mode to
be Raman active
 Symmetric vibrations give rise to intense Raman lines
 Raman activity depends on the polarizability of a bond and how easily
electrons can be displaced from the bond, or conversely how tightly they are
held to the nuclei
 Distortion of electrons is easier as the bond becomes longer and harder
when it shortens thus polarizability changes with vibration– and this
vibrational mode scatters Raman light
What does Raman Spectroscopy
Measure?
 In an asymmetric stretch the electrons are more easily polarized in the
bond that expands & less easily in the bond that compresses, thus there is
no overall change in the polarizability of the bond in it is Raman inactive
 In general if there is a large number of loosely held electrons the Raman
signal will be strong
 Raman spectroscopy is generally more sensitive to the overall geometry
and framework of the molecule rather than specific functional groups
 Polarizability trend decreases going across a period as the effective
nuclear charge increases as electrons are held closer to nucleus and thus
are not easily deformed
 Increases going down a group as atomic radius increases and effective
nuclear charge decreases
 Inorganic and organic species can be analyzed
 Metals in coordination complexes and their corresponding ligands
generally have many loose electrons and provide strong Raman signals
 It can be used to predict structure and stability of these complexes
 No two compounds ever give the exact same Raman spectra and the intensity
of scatted light is proportional to the amount of analyte present thus is is both
qualitative and quantitative
Principles of Raman Spectroscopy
 Radiation or incident light is scattered when it passes
through a source
Principles of Raman Spectroscopy
 Radiation or incident light is scattered when it passes through a source
 When light is scattered an incident photon( E=hn) raises the vibration
state to any one of an infinite number of states between the ground
and first excited state , called virtual or imaginary states
 3 main types of scattering result
 Rayleigh scattering- photon leaves with its original E, E=hn & molecule
relaxes to original state
 Stokes scattering- photon scattered with less energy than incident
radiation, E=hn -E
 Anti-Stokes scattering – photons scattered with more energy than incident
radiation , E=hn E
 The change in E between the incident light from source and scattered
photons is measured as change wavenumber (cm-1)– thus any source
wavelength may be used ( 400-2000cm-1)
* 3Types of Scattering in Raman Spectroscopy, most common shown in
bold- filters used to reduce Raleigh scattering reaching detector
*E = frequency of IR vibration- if sample is IR active there would be a peak in IR
spectrum at frequency equal to change in E
*Rayleigh scattering is most common/intense transition as no change occurs in
Vibrational state, anti-stokes is the least frequent because molecule must be excited
before incident light strikes
What is Surface enhanced Raman
spectroscopy (MA-SERS)?
 Raman measurements are inherently weak at only .001% of source
intensity because only 1 photon in a million will scatter with a shift in
wavelength
 The main drawback to this techniques is that a very large sample quantity is
necessary for a reliable signal, and low quantities of analyte cannot be
detected
 Surface enhanced Raman spectroscopy requires absorption of species
to be studied on a prepared rough metal surface- the Raman laser
produces electron oscillations on the surface which interact with the
analyte to enhance the signal
What is Surface enhanced Raman
spectroscopy (SERS)?
 Using SERS increases in the intensity of Raman signal have been regularly
observed on the order of 104-106, and can be as high as 108 and 1014 for
some systems
 SERS works best with coinage (Au, Ag, Cu) or alkali (Li, Na, K) metal
surfaces
 The importance of SERS is that the surface selectivity and sensitivity
extends RS applications to a wide variety of interfacial systems previously
inaccessible to RS because RS is not surface sensitive
 These include in-situ and ambient analysis of electrochemical, catalytic,
biological, and organic systems
 An novel technique called magnetic assisted surface enhanced Raman
spectroscopy has made an even greater improvement on SERS
What is magnetically assisted-surface
enhanced Raman spectroscopy (MA-SERS)?
 Magnetically assisted surface enhanced Raman spectroscopy is an
innovative approach which employs a magnetic nanocomposite
and and efficient SERS enhancement inferred by Fe3O4 and silver
nanoparticles
 A magnet is then used to magnetically separate the analyte of
interest from surrounding complex matrix which is immediately
analyzed using SERS
 This technique has many advantages over other preparation
techniques such as sandwich methods because (I)only one
nanoparticle is needed(I)the methods is simpler (III)there is no
possibility of non-specific interaction from other matrix elements
 In previous immunoassay SERS detection techniques Raman
labels have been required to provide a strong Raman Signal
 Indirect analysis has been performed by measuring the signal of
the Raman label present as a linker between the antibody and
metal surface of the SERS active substrate
 In one previous approach gold nanoparticles were labeled with
Raman active 4-mercaptobenzoic acid
 These particles were attached to sandwich complexes as shown in
the below figure
4-mercaptobenzoic acid
 In such methods magnetic substrates are used to efficiently extract a
target from a complex matrix
 a selective bond between an analyte and immunorecognition molecule
(previously immobilized on the surface) binds only to the analyte of
interest
 magnetic particles are then attached to the surface and the target
analyte is extracted from its surrounding matrix by application of
external magnetic force
 The SERS-active silver or gold nanoparticles are added after purification
and selectively attached to the target using the same set of
immunorecognition molecules present on the metal surface
 The Raman label, 4-meraptobenzoic acid, serves as a linker between
the antibody of interest and the SERS active metal substrate
 This techniques has a high LOD of 1-10 ng/mL, however two sets of
nanoparticles must be synthesized, each with limited stability
 Experimental design is highly complicated
 There is a high risk of false positive signals due to non specific
interactions between particles and non targeted compounds
attracted from matrix
 The immobilization of anti-IgG via a bond with streptavidin did not
influence its total activity, in contrast to the approaches mentioned
above, which utilized unspecific direct immobilization on the metal
surface
Label-Free Determination of Human Immunoglobin G
(IgG) in Blood using Fe3O4@Ag Nanocomposite
Fe3O4@Ag@streptavidin@anti-IgG
Synthesis
 The novel
Fe3O4@Ag@streptavidin@anti-IgG
nanocomposite allows for the first
label-free SERS analysis
 Fe3O4@Ag@streptavi-din@anti-
IgG is composed of a magnetic
core(Fe3O4) modified by O-
carboxymethylchitosan
 O-carboxymethylchitosan is used to
encapsulate the magnetic
nanoparticle (MNP) to avoid the
agglomeration & to make the MNPs
monodisperse in suspension
 It can be seen clearly in Raman
spectra that the 680 cm−1 peak of
Fe–O–Fe in Fe3 O4 shifts to 672cm−1
after covering the MNP by OCMCS
Fe3O4@Ag@streptavidin@anti-IgG
Synthesis
 The silver surface was
subsequently modified by
streptavidin and finally anti-
immunoglobulin G
 Streptavidin immobilizes the
anti-IgG( antibody which binds
specifically to IgG) without
affecting the total activity of
the metal surface– meaning
SARS signal will not be
affected
 Streptavidin
*Individidual modification steps in formation of Fe3O4@Ag@streptavidin@anti-
IgG
Potential Applications
 Development of analytical methods to determine ultralow levels of
immunoglobulins in various clinical samples including whole human
blood and plasma is a scientific challenge
 Many essential discoveries in the fields of immunology and
medicine in the past few decades have made this a prominent field
as intravenous immunoglobins have been found to have multiple
clinical applications:
 diopathic thrombocytopenic purpura (ITP)
 Kawasaki disease
 Guillain–Barré syndrome
 other autoimmune neuropathies
 myasthenia gravis
 Dermatomyositis
Potential Application
 As Immunoglobins play an essential role defending the human body against
viruses and disease, they are indispensible to clinical and pharmaceutical
industries
 MA- SERS was successfully used to isolate IgG from whole human blood using
the Fe3O4@Ag@streptavidin@anti-IgG nano-composite
 IgG has a considerable smaller diameter than the other immunoglobins (A,M,
E, and D) and is able to enter the placenta of an unborn baby to protect it
during pre-natal development
 IgG is usually present in human blood samples at 10 g·L−1 which changes
when a disease interrupts the body’s pathological processes
 MA-SERS is capable of detecting human IgG at 1000× lower concentration
level
 The results of the analysis show that samples from two patients 9 g·L−1 of IgG
and 10 g· L−1 of IgG --- what a healthy human should have!
Raman Spectrum of Human Blood
* Raman spectroscopy results for real human blood sample
Conclusion
 Thermo Corp. already offers a DXR Raman spectroscope capable of SERS
and an accompanying SERS analysis package, however the package is very
basic and only contains 70nm gold colloids( gold nanoparticles suspended
in solution)
 Investment in a package containing the necessary nanoparticles and and
magnetic materials needed to perform MA-SERS would be a prudent
investment and would keepThermo Crop. at the forefront of Raman
Spectroscopy
 Would allowThermo to compete with companies such as Kaiser Optical
Systems, the current leader in Raman Spectroscopy!
Leading Researchers/ Major Suppliers
 Researchers
 Marián Hajdúch, M.D., Ph.D.
 Director of the Institute of Molecular andTranslational Medicine, Faculty of
Medicine and Dentistry, Palacky University in Olomouc (Czech Republic)
 Email: marian.hajduch@upol.cz
Phone: +420 585632082, +420 585632083
 Prof. Radek Zbořil, Ph.D.
 General director of the Regional Centre ofAdvancedTechnologies and Materials
 Professor at the Palacky University in Olomouc (Czech Republic)
 Email: radek.zboril@upol.cz
Address: Šlechtitelů 11, Olomouc, Czech Republic, 78371
Phone: (+420) 58 563 4337
Fax: (+420) 58 563 4958

More Related Content

What's hot

Raman Spectroscopy
Raman SpectroscopyRaman Spectroscopy
Raman Spectroscopy
Manas Mantri
 
Applications of raman spectroscopy
Applications of raman spectroscopyApplications of raman spectroscopy
Applications of raman spectroscopy
kaavyabalachandran
 
XRF Basic Principles
XRF Basic PrinciplesXRF Basic Principles
XRF Basic Principles
Marion Becker
 
Raman spectroscopy (raman spectroscop\y)
Raman spectroscopy (raman spectroscop\y)Raman spectroscopy (raman spectroscop\y)
Raman spectroscopy (raman spectroscop\y)
AbdulAhad358
 
Raman spectroscopy
 Raman spectroscopy Raman spectroscopy
Raman spectroscopy
shekhar suman
 
Raman spectroscopy
Raman spectroscopy Raman spectroscopy
Raman spectroscopy
BASANTKUMAR123
 
Raman Effect
Raman EffectRaman Effect
Raman Effect
Yogesh Chauhan
 
RAMAN SPECTROSCOPY.pdf
RAMAN SPECTROSCOPY.pdfRAMAN SPECTROSCOPY.pdf
RAMAN SPECTROSCOPY.pdf
THE CREATORS ACADEMY
 
Raman Spectroscopy
Raman SpectroscopyRaman Spectroscopy
Raman Spectroscopy
krishslide
 
Raman spectroscopy
Raman spectroscopyRaman spectroscopy
Raman spectroscopy
Urvashi Arya
 
XRF Theory and Application
XRF Theory and ApplicationXRF Theory and Application
XRF Theory and Application
Sirwan Hasan
 
Raman spectroscopy
Raman spectroscopyRaman spectroscopy
Raman spectroscopy
ajamilan12
 
X ray fluorescence (X R F)
X ray fluorescence (X R F)X ray fluorescence (X R F)
X ray fluorescence (X R F)
Nani Karnam Vinayakam
 
Xrf
XrfXrf
Raman Spectroscopy and Its Applications
Raman Spectroscopy and Its ApplicationsRaman Spectroscopy and Its Applications
Raman Spectroscopy and Its Applications
Tong Zhang
 
Rasonance raman specroscopy
Rasonance  raman specroscopyRasonance  raman specroscopy
Rasonance raman specroscopy
tidke123
 
Raman spectroscopy
Raman spectroscopyRaman spectroscopy
Raman spectroscopy
Rawat DA Greatt
 
Raman spectroscopy
Raman spectroscopyRaman spectroscopy
Raman spectroscopy
vaishu r
 
Raman spectroscopy jivan_pund
Raman spectroscopy jivan_pundRaman spectroscopy jivan_pund
Raman spectroscopy jivan_pund
shindesushil123
 
Raman spectroscopy
Raman spectroscopy Raman spectroscopy
Raman spectroscopy
Aravind AB
 

What's hot (20)

Raman Spectroscopy
Raman SpectroscopyRaman Spectroscopy
Raman Spectroscopy
 
Applications of raman spectroscopy
Applications of raman spectroscopyApplications of raman spectroscopy
Applications of raman spectroscopy
 
XRF Basic Principles
XRF Basic PrinciplesXRF Basic Principles
XRF Basic Principles
 
Raman spectroscopy (raman spectroscop\y)
Raman spectroscopy (raman spectroscop\y)Raman spectroscopy (raman spectroscop\y)
Raman spectroscopy (raman spectroscop\y)
 
Raman spectroscopy
 Raman spectroscopy Raman spectroscopy
Raman spectroscopy
 
Raman spectroscopy
Raman spectroscopy Raman spectroscopy
Raman spectroscopy
 
Raman Effect
Raman EffectRaman Effect
Raman Effect
 
RAMAN SPECTROSCOPY.pdf
RAMAN SPECTROSCOPY.pdfRAMAN SPECTROSCOPY.pdf
RAMAN SPECTROSCOPY.pdf
 
Raman Spectroscopy
Raman SpectroscopyRaman Spectroscopy
Raman Spectroscopy
 
Raman spectroscopy
Raman spectroscopyRaman spectroscopy
Raman spectroscopy
 
XRF Theory and Application
XRF Theory and ApplicationXRF Theory and Application
XRF Theory and Application
 
Raman spectroscopy
Raman spectroscopyRaman spectroscopy
Raman spectroscopy
 
X ray fluorescence (X R F)
X ray fluorescence (X R F)X ray fluorescence (X R F)
X ray fluorescence (X R F)
 
Xrf
XrfXrf
Xrf
 
Raman Spectroscopy and Its Applications
Raman Spectroscopy and Its ApplicationsRaman Spectroscopy and Its Applications
Raman Spectroscopy and Its Applications
 
Rasonance raman specroscopy
Rasonance  raman specroscopyRasonance  raman specroscopy
Rasonance raman specroscopy
 
Raman spectroscopy
Raman spectroscopyRaman spectroscopy
Raman spectroscopy
 
Raman spectroscopy
Raman spectroscopyRaman spectroscopy
Raman spectroscopy
 
Raman spectroscopy jivan_pund
Raman spectroscopy jivan_pundRaman spectroscopy jivan_pund
Raman spectroscopy jivan_pund
 
Raman spectroscopy
Raman spectroscopy Raman spectroscopy
Raman spectroscopy
 

Viewers also liked

Introduction to raman spectroscopy
Introduction to raman spectroscopyIntroduction to raman spectroscopy
Introduction to raman spectroscopy
amirhosein66
 
Near Infrared Surface Enhanced Raman Spectroscopy Ceh 11 3 2010
Near Infrared Surface Enhanced Raman Spectroscopy Ceh 11 3 2010Near Infrared Surface Enhanced Raman Spectroscopy Ceh 11 3 2010
Near Infrared Surface Enhanced Raman Spectroscopy Ceh 11 3 2010
Chaz874
 
Raman Spectroscopy
Raman SpectroscopyRaman Spectroscopy
Raman Spectroscopy
yomology
 
Raman spectroscopy by nitish kumar
Raman spectroscopy by nitish kumarRaman spectroscopy by nitish kumar
Raman spectroscopy by nitish kumar
NITISH KUMAR
 
Advantages of raman over infrared spectroscopy
Advantages of raman over infrared spectroscopyAdvantages of raman over infrared spectroscopy
Advantages of raman over infrared spectroscopy
Health Tech Facts
 
Raman spectroscopy
Raman spectroscopyRaman spectroscopy
Raman spectroscopy
Bhaumik Bavishi
 

Viewers also liked (6)

Introduction to raman spectroscopy
Introduction to raman spectroscopyIntroduction to raman spectroscopy
Introduction to raman spectroscopy
 
Near Infrared Surface Enhanced Raman Spectroscopy Ceh 11 3 2010
Near Infrared Surface Enhanced Raman Spectroscopy Ceh 11 3 2010Near Infrared Surface Enhanced Raman Spectroscopy Ceh 11 3 2010
Near Infrared Surface Enhanced Raman Spectroscopy Ceh 11 3 2010
 
Raman Spectroscopy
Raman SpectroscopyRaman Spectroscopy
Raman Spectroscopy
 
Raman spectroscopy by nitish kumar
Raman spectroscopy by nitish kumarRaman spectroscopy by nitish kumar
Raman spectroscopy by nitish kumar
 
Advantages of raman over infrared spectroscopy
Advantages of raman over infrared spectroscopyAdvantages of raman over infrared spectroscopy
Advantages of raman over infrared spectroscopy
 
Raman spectroscopy
Raman spectroscopyRaman spectroscopy
Raman spectroscopy
 

Similar to MA-SERS Presentation

ramanspectroscpypresentationbyzakiaafzal-150525070834-lva1-app6891.pdf
ramanspectroscpypresentationbyzakiaafzal-150525070834-lva1-app6891.pdframanspectroscpypresentationbyzakiaafzal-150525070834-lva1-app6891.pdf
ramanspectroscpypresentationbyzakiaafzal-150525070834-lva1-app6891.pdf
RezaJoia
 
Resonance raman spectoscopy
Resonance raman spectoscopyResonance raman spectoscopy
Resonance raman spectoscopy
RukhsarLatif1
 
RAMAN SPECTROSCOPY - ANALYTICAL CHEMISTRY
RAMAN SPECTROSCOPY - ANALYTICAL CHEMISTRYRAMAN SPECTROSCOPY - ANALYTICAL CHEMISTRY
RAMAN SPECTROSCOPY - ANALYTICAL CHEMISTRY
suriyachem27
 
Introduction To Spectroscopy
Introduction To SpectroscopyIntroduction To Spectroscopy
Introduction To Spectroscopy
guest824336
 
Prabhakar singh ii sem-paper-ir spectroscopy & fluorimetry
Prabhakar singh  ii sem-paper-ir spectroscopy & fluorimetryPrabhakar singh  ii sem-paper-ir spectroscopy & fluorimetry
Prabhakar singh ii sem-paper-ir spectroscopy & fluorimetry
Department of Biochemistry, Veer Bahadur Singh Purvanchal Univarsity, Jaunpur
 
Field Ion - Infrared- Raman Spectroscopy
Field Ion - Infrared- Raman SpectroscopyField Ion - Infrared- Raman Spectroscopy
Field Ion - Infrared- Raman Spectroscopy
SAMEER VISHWAKARMA
 
NMR .pdf
NMR .pdfNMR .pdf
NMR .pdf
Nusrat Gulbarga
 
Resonance Raman Spectroscopy
Resonance Raman Spectroscopy Resonance Raman Spectroscopy
Resonance Raman Spectroscopy
SPCGC AJMER
 
Analytical Chemistry
Analytical ChemistryAnalytical Chemistry
Analytical Chemistry
Sidra Javed
 
NMR Spectroscopy
NMR SpectroscopyNMR Spectroscopy
NMR Spectroscopy
tabirsir
 
Quang phổ cầm tay
Quang phổ cầm tayQuang phổ cầm tay
Quang phổ cầm tay
Lê Hòa
 
NDE by magnetic resonance.docx
NDE by magnetic resonance.docxNDE by magnetic resonance.docx
NDE by magnetic resonance.docx
Himasree Viswanadhapalli
 
Nuclear magnetic resonance (NMR)
Nuclear magnetic resonance (NMR)Nuclear magnetic resonance (NMR)
Nuclear magnetic resonance (NMR)
Maham Adnan
 
INTRODUCTION TO VARIOUS SPECTROSCOPY TECHNIQUES
INTRODUCTION TO VARIOUS SPECTROSCOPY TECHNIQUESINTRODUCTION TO VARIOUS SPECTROSCOPY TECHNIQUES
INTRODUCTION TO VARIOUS SPECTROSCOPY TECHNIQUES
ISF COLLEGE OF PHARMACY MOGA
 
Spectroscopy
SpectroscopySpectroscopy
Spectroscopy
beckydaw
 
Raman_Tutorial_05.ppt
Raman_Tutorial_05.pptRaman_Tutorial_05.ppt
Raman_Tutorial_05.ppt
bkacademy
 
Polymer analysis by spectral methods
Polymer analysis by spectral methodsPolymer analysis by spectral methods
Polymer analysis by spectral methods
HASNAIN SAYED
 
CHM 412 LECTURE 2 (IR and RAMAN).pptx
CHM 412 LECTURE 2 (IR and RAMAN).pptxCHM 412 LECTURE 2 (IR and RAMAN).pptx
CHM 412 LECTURE 2 (IR and RAMAN).pptx
OgunsanyaRasheed
 
Raman spectroscopy- General Talak
Raman spectroscopy- General TalakRaman spectroscopy- General Talak
Raman spectroscopy- General Talak
Kamalakkannan K
 
surfaceenhancedramanspectroscopyrahutoshranjan-200729070828 (4).pdf
surfaceenhancedramanspectroscopyrahutoshranjan-200729070828 (4).pdfsurfaceenhancedramanspectroscopyrahutoshranjan-200729070828 (4).pdf
surfaceenhancedramanspectroscopyrahutoshranjan-200729070828 (4).pdf
vimalabdu
 

Similar to MA-SERS Presentation (20)

ramanspectroscpypresentationbyzakiaafzal-150525070834-lva1-app6891.pdf
ramanspectroscpypresentationbyzakiaafzal-150525070834-lva1-app6891.pdframanspectroscpypresentationbyzakiaafzal-150525070834-lva1-app6891.pdf
ramanspectroscpypresentationbyzakiaafzal-150525070834-lva1-app6891.pdf
 
Resonance raman spectoscopy
Resonance raman spectoscopyResonance raman spectoscopy
Resonance raman spectoscopy
 
RAMAN SPECTROSCOPY - ANALYTICAL CHEMISTRY
RAMAN SPECTROSCOPY - ANALYTICAL CHEMISTRYRAMAN SPECTROSCOPY - ANALYTICAL CHEMISTRY
RAMAN SPECTROSCOPY - ANALYTICAL CHEMISTRY
 
Introduction To Spectroscopy
Introduction To SpectroscopyIntroduction To Spectroscopy
Introduction To Spectroscopy
 
Prabhakar singh ii sem-paper-ir spectroscopy & fluorimetry
Prabhakar singh  ii sem-paper-ir spectroscopy & fluorimetryPrabhakar singh  ii sem-paper-ir spectroscopy & fluorimetry
Prabhakar singh ii sem-paper-ir spectroscopy & fluorimetry
 
Field Ion - Infrared- Raman Spectroscopy
Field Ion - Infrared- Raman SpectroscopyField Ion - Infrared- Raman Spectroscopy
Field Ion - Infrared- Raman Spectroscopy
 
NMR .pdf
NMR .pdfNMR .pdf
NMR .pdf
 
Resonance Raman Spectroscopy
Resonance Raman Spectroscopy Resonance Raman Spectroscopy
Resonance Raman Spectroscopy
 
Analytical Chemistry
Analytical ChemistryAnalytical Chemistry
Analytical Chemistry
 
NMR Spectroscopy
NMR SpectroscopyNMR Spectroscopy
NMR Spectroscopy
 
Quang phổ cầm tay
Quang phổ cầm tayQuang phổ cầm tay
Quang phổ cầm tay
 
NDE by magnetic resonance.docx
NDE by magnetic resonance.docxNDE by magnetic resonance.docx
NDE by magnetic resonance.docx
 
Nuclear magnetic resonance (NMR)
Nuclear magnetic resonance (NMR)Nuclear magnetic resonance (NMR)
Nuclear magnetic resonance (NMR)
 
INTRODUCTION TO VARIOUS SPECTROSCOPY TECHNIQUES
INTRODUCTION TO VARIOUS SPECTROSCOPY TECHNIQUESINTRODUCTION TO VARIOUS SPECTROSCOPY TECHNIQUES
INTRODUCTION TO VARIOUS SPECTROSCOPY TECHNIQUES
 
Spectroscopy
SpectroscopySpectroscopy
Spectroscopy
 
Raman_Tutorial_05.ppt
Raman_Tutorial_05.pptRaman_Tutorial_05.ppt
Raman_Tutorial_05.ppt
 
Polymer analysis by spectral methods
Polymer analysis by spectral methodsPolymer analysis by spectral methods
Polymer analysis by spectral methods
 
CHM 412 LECTURE 2 (IR and RAMAN).pptx
CHM 412 LECTURE 2 (IR and RAMAN).pptxCHM 412 LECTURE 2 (IR and RAMAN).pptx
CHM 412 LECTURE 2 (IR and RAMAN).pptx
 
Raman spectroscopy- General Talak
Raman spectroscopy- General TalakRaman spectroscopy- General Talak
Raman spectroscopy- General Talak
 
surfaceenhancedramanspectroscopyrahutoshranjan-200729070828 (4).pdf
surfaceenhancedramanspectroscopyrahutoshranjan-200729070828 (4).pdfsurfaceenhancedramanspectroscopyrahutoshranjan-200729070828 (4).pdf
surfaceenhancedramanspectroscopyrahutoshranjan-200729070828 (4).pdf
 

MA-SERS Presentation

  • 1. MagneticallyAssisted Surface Enhanced Raman Spectroscopy(MA-SERS) An Investigation into the clinical applications of nanocomposite particles
  • 2. The Basics: Comparison of Raman and IR Spectroscopy  A vibrational spectroscopy  IR and Raman are the most common vibrational spectroscopies for assessing molecular motion and fingerprinting species  Raman is based on inelastic scattering of a monochromatic excitation source  Routine energy range: 200 - 4000 cm–1  Complementary selection rules to IR spectroscopy  Raman spectroscopy complements IR spectroscopy because, as we have seen before, not all vibrations result in an IR absorbance due to lack of dipole moment
  • 3. The Basics: Comparison of Raman and IR Spectroscopy  Raman spectroscopy is a powerful and non-invasive tool for:  studying molecular vibrations by light scattering  determining chemical species  Instead of examining the wavenumber at which a functional group has a vibrational mode, Raman observes the shift in vibration of the molecule from an incident light  It complements IR absorption spectroscopy which only results in absorptions if there is a change in the dipole moment during vibration, symmetric stretches as shown below are Raman active  A change in dipole moment is required for a vibrational mode to be IR active, only then can photons of the same energy as the vibrational state interact
  • 4. What does Raman Spectroscopy Measure?  A change in the polarizability of a bond is required for a vibrational mode to be Raman active  Symmetric vibrations give rise to intense Raman lines  Raman activity depends on the polarizability of a bond and how easily electrons can be displaced from the bond, or conversely how tightly they are held to the nuclei  Distortion of electrons is easier as the bond becomes longer and harder when it shortens thus polarizability changes with vibration– and this vibrational mode scatters Raman light
  • 5. What does Raman Spectroscopy Measure?  In an asymmetric stretch the electrons are more easily polarized in the bond that expands & less easily in the bond that compresses, thus there is no overall change in the polarizability of the bond in it is Raman inactive  In general if there is a large number of loosely held electrons the Raman signal will be strong  Raman spectroscopy is generally more sensitive to the overall geometry and framework of the molecule rather than specific functional groups
  • 6.  Polarizability trend decreases going across a period as the effective nuclear charge increases as electrons are held closer to nucleus and thus are not easily deformed  Increases going down a group as atomic radius increases and effective nuclear charge decreases  Inorganic and organic species can be analyzed  Metals in coordination complexes and their corresponding ligands generally have many loose electrons and provide strong Raman signals  It can be used to predict structure and stability of these complexes  No two compounds ever give the exact same Raman spectra and the intensity of scatted light is proportional to the amount of analyte present thus is is both qualitative and quantitative
  • 7. Principles of Raman Spectroscopy  Radiation or incident light is scattered when it passes through a source
  • 8. Principles of Raman Spectroscopy  Radiation or incident light is scattered when it passes through a source  When light is scattered an incident photon( E=hn) raises the vibration state to any one of an infinite number of states between the ground and first excited state , called virtual or imaginary states  3 main types of scattering result  Rayleigh scattering- photon leaves with its original E, E=hn & molecule relaxes to original state  Stokes scattering- photon scattered with less energy than incident radiation, E=hn -E  Anti-Stokes scattering – photons scattered with more energy than incident radiation , E=hn E  The change in E between the incident light from source and scattered photons is measured as change wavenumber (cm-1)– thus any source wavelength may be used ( 400-2000cm-1)
  • 9. * 3Types of Scattering in Raman Spectroscopy, most common shown in bold- filters used to reduce Raleigh scattering reaching detector *E = frequency of IR vibration- if sample is IR active there would be a peak in IR spectrum at frequency equal to change in E
  • 10. *Rayleigh scattering is most common/intense transition as no change occurs in Vibrational state, anti-stokes is the least frequent because molecule must be excited before incident light strikes
  • 11. What is Surface enhanced Raman spectroscopy (MA-SERS)?  Raman measurements are inherently weak at only .001% of source intensity because only 1 photon in a million will scatter with a shift in wavelength  The main drawback to this techniques is that a very large sample quantity is necessary for a reliable signal, and low quantities of analyte cannot be detected  Surface enhanced Raman spectroscopy requires absorption of species to be studied on a prepared rough metal surface- the Raman laser produces electron oscillations on the surface which interact with the analyte to enhance the signal
  • 12. What is Surface enhanced Raman spectroscopy (SERS)?  Using SERS increases in the intensity of Raman signal have been regularly observed on the order of 104-106, and can be as high as 108 and 1014 for some systems  SERS works best with coinage (Au, Ag, Cu) or alkali (Li, Na, K) metal surfaces  The importance of SERS is that the surface selectivity and sensitivity extends RS applications to a wide variety of interfacial systems previously inaccessible to RS because RS is not surface sensitive  These include in-situ and ambient analysis of electrochemical, catalytic, biological, and organic systems  An novel technique called magnetic assisted surface enhanced Raman spectroscopy has made an even greater improvement on SERS
  • 13. What is magnetically assisted-surface enhanced Raman spectroscopy (MA-SERS)?  Magnetically assisted surface enhanced Raman spectroscopy is an innovative approach which employs a magnetic nanocomposite and and efficient SERS enhancement inferred by Fe3O4 and silver nanoparticles  A magnet is then used to magnetically separate the analyte of interest from surrounding complex matrix which is immediately analyzed using SERS  This technique has many advantages over other preparation techniques such as sandwich methods because (I)only one nanoparticle is needed(I)the methods is simpler (III)there is no possibility of non-specific interaction from other matrix elements
  • 14.  In previous immunoassay SERS detection techniques Raman labels have been required to provide a strong Raman Signal  Indirect analysis has been performed by measuring the signal of the Raman label present as a linker between the antibody and metal surface of the SERS active substrate  In one previous approach gold nanoparticles were labeled with Raman active 4-mercaptobenzoic acid  These particles were attached to sandwich complexes as shown in the below figure 4-mercaptobenzoic acid
  • 15.  In such methods magnetic substrates are used to efficiently extract a target from a complex matrix  a selective bond between an analyte and immunorecognition molecule (previously immobilized on the surface) binds only to the analyte of interest  magnetic particles are then attached to the surface and the target analyte is extracted from its surrounding matrix by application of external magnetic force
  • 16.  The SERS-active silver or gold nanoparticles are added after purification and selectively attached to the target using the same set of immunorecognition molecules present on the metal surface  The Raman label, 4-meraptobenzoic acid, serves as a linker between the antibody of interest and the SERS active metal substrate  This techniques has a high LOD of 1-10 ng/mL, however two sets of nanoparticles must be synthesized, each with limited stability  Experimental design is highly complicated  There is a high risk of false positive signals due to non specific interactions between particles and non targeted compounds attracted from matrix  The immobilization of anti-IgG via a bond with streptavidin did not influence its total activity, in contrast to the approaches mentioned above, which utilized unspecific direct immobilization on the metal surface
  • 17. Label-Free Determination of Human Immunoglobin G (IgG) in Blood using Fe3O4@Ag Nanocomposite
  • 18. Fe3O4@Ag@streptavidin@anti-IgG Synthesis  The novel Fe3O4@Ag@streptavidin@anti-IgG nanocomposite allows for the first label-free SERS analysis  Fe3O4@Ag@streptavi-din@anti- IgG is composed of a magnetic core(Fe3O4) modified by O- carboxymethylchitosan  O-carboxymethylchitosan is used to encapsulate the magnetic nanoparticle (MNP) to avoid the agglomeration & to make the MNPs monodisperse in suspension  It can be seen clearly in Raman spectra that the 680 cm−1 peak of Fe–O–Fe in Fe3 O4 shifts to 672cm−1 after covering the MNP by OCMCS
  • 19. Fe3O4@Ag@streptavidin@anti-IgG Synthesis  The silver surface was subsequently modified by streptavidin and finally anti- immunoglobulin G  Streptavidin immobilizes the anti-IgG( antibody which binds specifically to IgG) without affecting the total activity of the metal surface– meaning SARS signal will not be affected  Streptavidin
  • 20. *Individidual modification steps in formation of Fe3O4@Ag@streptavidin@anti- IgG
  • 21. Potential Applications  Development of analytical methods to determine ultralow levels of immunoglobulins in various clinical samples including whole human blood and plasma is a scientific challenge  Many essential discoveries in the fields of immunology and medicine in the past few decades have made this a prominent field as intravenous immunoglobins have been found to have multiple clinical applications:  diopathic thrombocytopenic purpura (ITP)  Kawasaki disease  Guillain–Barré syndrome  other autoimmune neuropathies  myasthenia gravis  Dermatomyositis
  • 22. Potential Application  As Immunoglobins play an essential role defending the human body against viruses and disease, they are indispensible to clinical and pharmaceutical industries  MA- SERS was successfully used to isolate IgG from whole human blood using the Fe3O4@Ag@streptavidin@anti-IgG nano-composite  IgG has a considerable smaller diameter than the other immunoglobins (A,M, E, and D) and is able to enter the placenta of an unborn baby to protect it during pre-natal development  IgG is usually present in human blood samples at 10 g·L−1 which changes when a disease interrupts the body’s pathological processes  MA-SERS is capable of detecting human IgG at 1000× lower concentration level  The results of the analysis show that samples from two patients 9 g·L−1 of IgG and 10 g· L−1 of IgG --- what a healthy human should have!
  • 23. Raman Spectrum of Human Blood * Raman spectroscopy results for real human blood sample
  • 24. Conclusion  Thermo Corp. already offers a DXR Raman spectroscope capable of SERS and an accompanying SERS analysis package, however the package is very basic and only contains 70nm gold colloids( gold nanoparticles suspended in solution)  Investment in a package containing the necessary nanoparticles and and magnetic materials needed to perform MA-SERS would be a prudent investment and would keepThermo Crop. at the forefront of Raman Spectroscopy  Would allowThermo to compete with companies such as Kaiser Optical Systems, the current leader in Raman Spectroscopy!
  • 25. Leading Researchers/ Major Suppliers  Researchers  Marián Hajdúch, M.D., Ph.D.  Director of the Institute of Molecular andTranslational Medicine, Faculty of Medicine and Dentistry, Palacky University in Olomouc (Czech Republic)  Email: marian.hajduch@upol.cz Phone: +420 585632082, +420 585632083  Prof. Radek Zbořil, Ph.D.  General director of the Regional Centre ofAdvancedTechnologies and Materials  Professor at the Palacky University in Olomouc (Czech Republic)  Email: radek.zboril@upol.cz Address: Šlechtitelů 11, Olomouc, Czech Republic, 78371 Phone: (+420) 58 563 4337 Fax: (+420) 58 563 4958

Editor's Notes

  1. Polarizability is a measure of the deformability of ‘squishiness’ of a bond in an electric field ----- whereas homonuclear diatomic molecules such as Cl-Cl are IR-inactive because they have no dipole theay can be measured with Raman because the molecules change in polarizability during stretching
  2. Poolarizability is a measure of the deformability of ‘squishiness’ of a bond in an electric field
  3. Rayleigh scattering is a result of elastic collision between photons and molecule In sample Some photons are scattered with less energy after their interaction and some are scattered with more due to interaction of beam with molecule
  4. Rayleigh scattering The molecule is excited to any virtual state. The molecule relaxes back to its original state. The photon is scattered elastically, leaving with its original energy. Stokes scattering The molecule is excited to any virtual state. The molecule relaxes back to a higher vibrational state than it had originally. The photon leaves with energy hν-ΔE and has been scattered inelastically. Anti-Stokes scattering The molecule begins in a vibrationally excited state. The molecule is excited to any virtual state. The molecule relaxes back to a lower vibrational state than it had originally. The photon leaves with energy hν+ΔE, and has been scattered superelastically.
  5. Polarizability is a measure of the deformability of ‘squishiness’ of a bond in an electric field
  6. Polarizability is a measure of the deformability of ‘squishiness’ of a bond in an electric field
  7. Polarizability is a measure of the deformability of ‘squishiness’ of a bond in an electric field
  8. Poolarizability is a measure of the deformability of ‘squishiness’ of a bond in an electric field
  9. Poolarizability is a measure of the deformability of ‘squishiness’ of a bond in an electric field
  10. Poolarizability is a measure of the deformability of ‘squishiness’ of a bond in an electric field
  11. Poolarizability is a measure of the deformability of ‘squishiness’ of a bond in an electric field
  12. Poolarizability is a measure of the deformability of ‘squishiness’ of a bond in an electric field