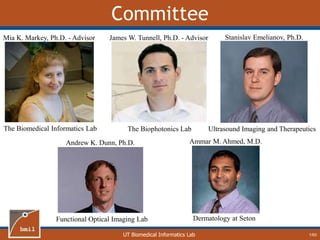
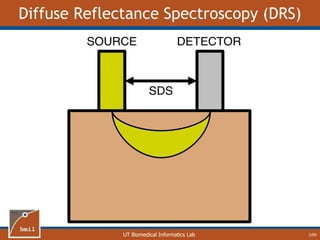
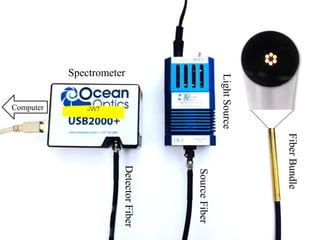
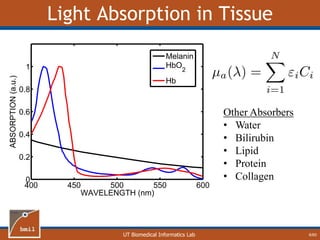
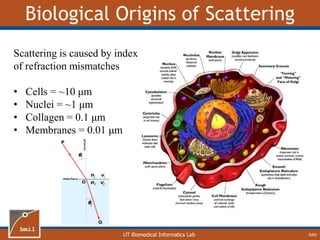
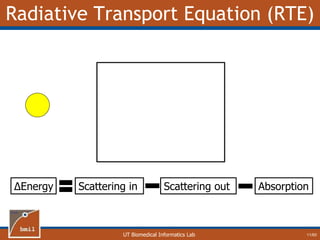
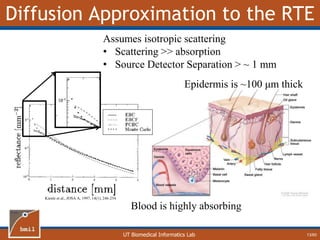
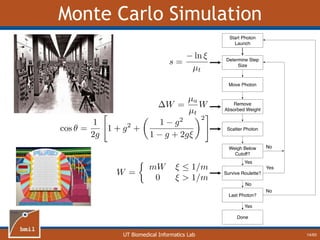
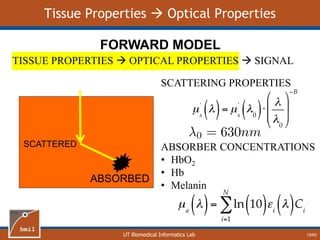
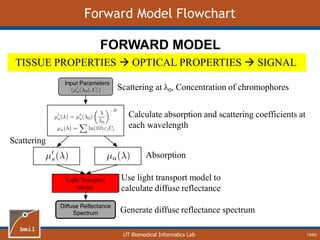
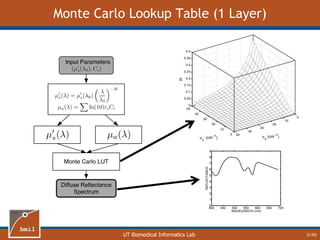
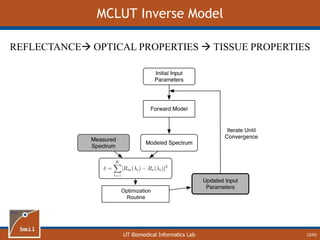
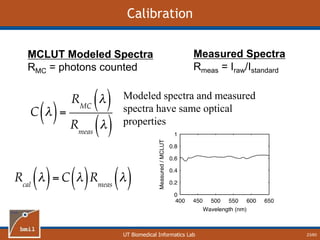
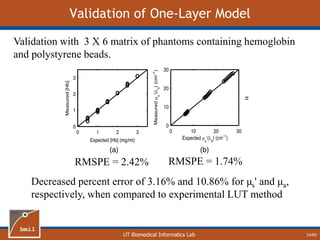
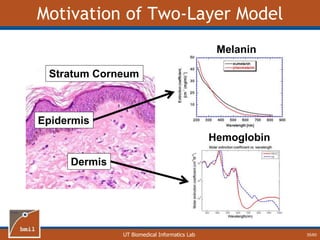
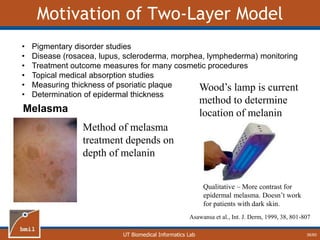
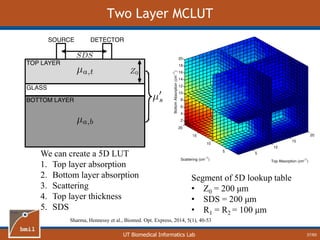
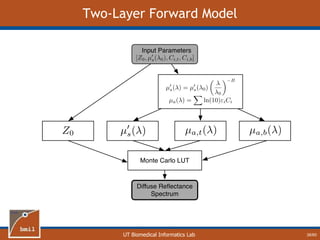
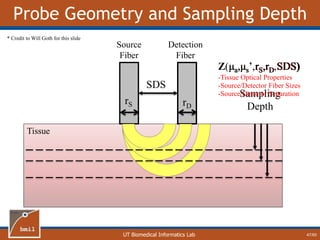
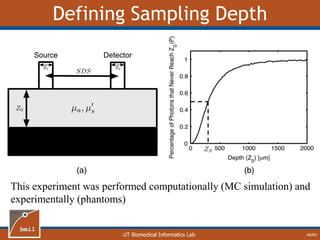
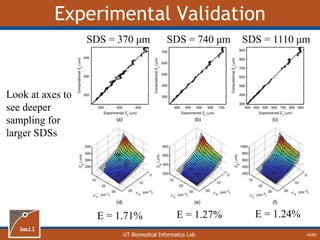
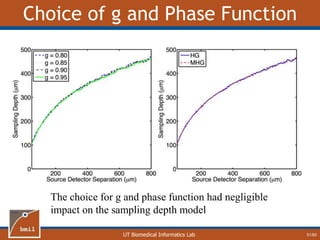
UT Biomedical Informatics Lab
Depth Resolved Diffuse
Reflectance Spectroscopy
Ricky Hennessy
The Biomedical Informatics Lab (BMIL)
The Biophotonics Laboratory
UT Biomedical Informatics Lab
Committee
1/60
Mia K. Markey, Ph.D. - Advisor
The Biomedical Informatics Lab
James W. Tunnell, Ph.D. - Advisor
The Biophotonics Lab
Stanislav Emelianov, Ph.D.
Ultrasound Imaging and Therapeutics
Andrew K. Dunn, Ph.D.
Functional Optical Imaging Lab
Ammar M. Ahmed, M.D.
Dermatology at Seton
UT Biomedical Informatics Lab
Diffuse Reflectance Spectroscopy (DRS)
2/60
UT Biomedical Informatics Lab
Applications of DRS
3
Cancer
Detection
Soil
Characterization
Wearable Tech
Food Quality Endoscopic Surgery
Cosmetic
Applications
UT Biomedical Informatics Lab
Cancer Detection with DRS
4/60
Extract Features from Data Use Features to Create Classifier
Rajaram et al. Lasers Surg Med 42:876-887 (2010)
UT Biomedical Informatics Lab
DRS Instrumentation
5
Spectrometer
LightSource
SourceFiber
DetectorFiber
Computer
FiberBundle
UT Biomedical Informatics Lab
Light Absorption in Tissue
6/60
400 450 500 550 600
0
0.2
0.4
0.6
0.8
1
WAVELENGTH (nm)
ABSORPTION(a.u.)
Melanin
HbO
2
Hb
Other Absorbers
• Water
• Bilirubin
• Lipid
• Protein
• Collagen
UT Biomedical Informatics Lab
Light Scattering in Tissue
7/60
UT Biomedical Informatics Lab
Biological Origins of Scattering
8/60
Scattering is caused by index
of refraction mismatches
• Cells = ~10 μm
• Nuclei = ~1 μm
• Collagen = 0.1 μm
• Membranes = 0.01 μm
UT Biomedical Informatics Lab
Scattering Coefficient (μs)
9/60
Scattering coefficient (μs) is proportional to
concentration of scatterers in a medium
μs
-1 is the average
distance a photon
travels between
scattering events
μs
UT Biomedical Informatics Lab
Direction of Scattering
10/60
Isotropic Scattering Anisotropic Scattering
Tissue scattering is in forward direction
(g = ~0.9)
Henyey-Greenstein Phase Function
g = 0
UT Biomedical Informatics Lab
Radiative Transport Equation (RTE)
11/60
ΔEnergy Scattering in Scattering out Absorption
UT Biomedical Informatics Lab
Reduced Scattering Coefficient
12/60
1
2
10
9
8
7
6
5
43
Using reduced
scattering with isotropic
scattering is equivalent
to larger scattering with
anisotropic scattering
UT Biomedical Informatics Lab
Diffusion Approximation to the RTE
13/60
Kienle et al., JOSA A, 1997, 14(1), 246-254
Assumes isotropic scattering
• Scattering >> absorption
• Source Detector Separation > ~ 1 mm
Blood is highly absorbing
Epidermis is ~100 μm thick
UT Biomedical Informatics Lab
Monte Carlo Simulation
14/60
UT Biomedical Informatics Lab 15
UT Biomedical Informatics Lab 16
UT Biomedical Informatics Lab
The Monte Carlo Lookup Table
(MCLUT) Method
Hennessy et al., JBO, 2013, 18(3), 037003
UT Biomedical Informatics Lab
Tissue Properties  Optical Properties
SCATTERED
ABSORBED
TISSUE PROPERTIES  OPTICAL PROPERTIES  SIGNAL
FORWARD MODEL
SCATTERING PROPERTIES
ABSORBER CONCENTRATIONS
• HbO2
• Hb
• Melanin
18/60
UT Biomedical Informatics Lab
Forward Model Flowchart
TISSUE PROPERTIES  OPTICAL PROPERTIES  SIGNAL
FORWARD MODEL
Light Transport
Model
Scattering at λ0, Concentration of chromophores
Calculate absorption and scattering coefficients at
each wavelength
Scattering
Absorption
Use light transport model to
calculate diffuse reflectance
Generate diffuse reflectance spectrum
19/60
UT Biomedical Informatics Lab
Monte Carlo on GPU
Modern processor w/ 4
cores = 4 times speedup
Modern GPU w/ 500 cores =
 500 times speedup!
 < $300
Alerstam et al., Biomed. Opt. Express., 2010, 1, 658-675
20/60
UT Biomedical Informatics Lab
Monte Carlo Lookup Table (1 Layer)
400 450 500 550 600 650 700
0
1
2
3
4
5
6
7
8
9
WAVELENGTH (nm)
REFLECTANCE
21/60
UT Biomedical Informatics Lab
MCLUT Inverse Model
REFLECTANCE OPTICAL PROPERTIES  TISSUE PROPERTIES
Optimization
Routine
22/60
UT Biomedical Informatics Lab
Calibration
MCLUT Modeled Spectra
RMC = photons counted
Measured Spectra
Rmeas = Iraw/Istandard
Modeled spectra and measured
spectra have same optical
properties
23/60
UT Biomedical Informatics Lab
Validation of One-Layer Model
RMSPE = 2.42% RMSPE = 1.74%
Validation with 3 X 6 matrix of phantoms containing hemoglobin
and polystyrene beads.
Decreased percent error of 3.16% and 10.86% for μs' and μa,
respectively, when compared to experimental LUT method
24/60
UT Biomedical Informatics Lab
Errors Caused by One-Layer
Assumption for Skin
Hennessy et al., JBO, 2015, 20(2), 027001
UT Biomedical Informatics Lab
Fit Two-Layer Data with One Layer Model
26/60
Hb + HbO2
melanin
melanin +
Hb + HbO2
1. Create two-layer
spectra
2. Fit with one-
layer model
• [mel]
• [Hb]
• SO2
• Scattering
• Epidermal thickness
• [mel]
• [Hb]
• SO2
• Scattering
• Vessel radius
Notice that the fit
is very good
UT Biomedical Informatics Lab
Melanin
27/60
• One-Layer model
underestimates [mel]
• Magnitude of error is
dependent on epidermal
thickness (Z0)
• Z0 Error
UT Biomedical Informatics Lab
Hemoglobin
28/60
• One-Layer model
underestimates [Hb]
• Magnitude of error is
dependent on epidermal
thickness (Z0)
• Z0 Error
UT Biomedical Informatics Lab
Oxygen Saturation
29/60
• One-Layer model
overestimates SO2 when
SO2 < 50%
• One-Layer model
underestimates SO2
when SO2 > 50%
• Magnitude of error is
dependent on epidermal
thickness (Z0)
• Z0 Error
UT Biomedical Informatics Lab
Pigment Packaging
30/60
• In tissue, blood is
confined to vessels
• This significantly
reduces the optical
path length where
absorption is high
(Soret Band)
• Causes a flattening of
the absorption
spectrum
UT Biomedical Informatics Lab
Vessel Radius vs. Epidermal Thickness
31/60
0 50 100 150 200 250 300
0
50
100
150
200
250
300
350
400
450
500
Top Layer Thickness (mm)
VesselRadius(mm)
• Vessel radius (pigment
packaging) factor is
highly correlated with
top-layer thickness
• Pigment packaging
factor is likely a
combination of vessel
packaging and
epidermal thickness
UT Biomedical Informatics Lab
Correlation Between [Hb] and [mel]
32/60
R = 0.04 R = 0.80
One-layer assumption causes artificial correlation
between [Hb] and [mel]
UT Biomedical Informatics Lab
Conclusions about One-Layer Errors
Causes underestimation of [Hb] and [mel]
– Magnitude of error is function of epidermal
thickness
Causes error in SO2 that is a function of
epidermal thickness as well as SO2
Vessel Packaging factor and epidermal
thickness are highly correlated
Causes an artificial correlation in [Hb] and
[mel]
33/60
UT Biomedical Informatics Lab
The Two-Layer Monte Carlo
Lookup Table Method
Sharma, Hennessy et al., Biomed Optics Express, 2014, 5(1), 40-53
UT Biomedical Informatics Lab
Motivation of Two-Layer Model
Epidermis
Dermis
Stratum Corneum
Melanin
Hemoglobin
35/60
UT Biomedical Informatics Lab
Motivation of Two-Layer Model
• Pigmentary disorder studies
• Disease (rosacea, lupus, scleroderma, morphea, lymphederma) monitoring
• Treatment outcome measures for many cosmetic procedures
• Topical medical absorption studies
• Measuring thickness of psoriatic plaque
• Determination of epidermal thickness
Melasma
Method of melasma
treatment depends on
depth of melanin
Wood’s lamp is current
method to determine
location of melanin
Qualitative – More contrast for
epidermal melasma. Doesn’t work
for patients with dark skin.
Asawansa et al., Int. J. Derm, 1999, 38, 801-807
36/60
UT Biomedical Informatics Lab
Two Layer MCLUT
We can create a 5D LUT
1. Top layer absorption
2. Bottom layer absorption
3. Scattering
4. Top layer thickness
5. SDS
37/60
Segment of 5D lookup table
• Z0 = 200 μm
• SDS = 200 μm
• R1 = R2 = 100 μm
Sharma, Hennessy et al., Biomed. Opt. Express, 2014, 5(1), 40-53
UT Biomedical Informatics Lab
Two-Layer Forward Model
38/60
UT Biomedical Informatics Lab
Two-Layer MCLUT Inverse Model
39/60
UT Biomedical Informatics Lab
Two-Layer Phantom Construction
40/60
UT Biomedical Informatics Lab
Phantom Validation Study
PHANTOM μs’ (mm-1) μa,t (mm-1) μa,b (mm-1)
1 1.5 0.25 1.275
2 1.5 0.25 1.275
3 1.5 2.3 0.25
4 1.5 2.3 0.25
5 1.5 0.25 2.3
6 1.5 0.25 2.3
7 2.85 0.25 2.3
8 2.85 0.25 2.3
9 2.85 2.3 0.25
10 2.85 1.275 0.25
11 2.85 1.275 2.3
12 0.75 0.25 1.275
13 0.75 1.275 0.25
14 0.75 0.25 2.3
Set of Two Layer Phantoms
Range of scattering and
absorption in skin
μs’ = 1-3 mm-1
μa = 0 – 2.3 mm-1
Nichols et al., JBO, 2012, 17(5), 057001
41/60
UT Biomedical Informatics Lab
Phantom Data
42/60
UT Biomedical Informatics Lab
Results: Top Layer Thickness
43/60
Error = 10% for Z0 < 500 μm
Photons are not
sampling this
deep.
UT Biomedical Informatics Lab
Results: All Optical Properties
44/60
UT Biomedical Informatics Lab
Results: Dependence on SDS
45/60
Main Takeaway
Accuracy of extracted
parameters is dependent on
probe geometry. This is due
to sampling depth of
probe.
UT Biomedical Informatics Lab
Sampling Depth of Diffuse
Reflectance Spectroscopy Probes
Hennessy et al., JBO, 2014, 19(10), 107002
UT Biomedical Informatics Lab
Probe Geometry and Sampling Depth
47
Tissue
Source
Fiber
Detection
Fiber
SDS
Sampling
Depth
Z(μa,μs’,rS,rD,SDS)
rS rD
-Tissue Optical Properties
-Source/Detector Fiber Sizes
-Source/Detector Separation
* Credit to Will Goth for this slide
47/60
UT Biomedical Informatics Lab
Defining Sampling Depth
48/60
This experiment was performed computationally (MC simulation) and
experimentally (phantoms)
UT Biomedical Informatics Lab
Experimental Validation
49/60
E = 1.71% E = 1.27% E = 1.24%
SDS = 370 μm SDS = 740 μm SDS = 1110 μm
Look at axes to
see deeper
sampling for
larger SDSs
UT Biomedical Informatics Lab
Analytical Model of Sampling Depth
50/60
This expression can be
used to aid in the design
of application specific
DRS probesE = 2.89%
Expression was found using
TableCurve 3D. Free parameters
[a1, a2, a3, a4] were selected using a
least-squares fitting algorithm.
UT Biomedical Informatics Lab
Choice of g and Phase Function
51/60
The choice for g and phase function had negligible
impact on the sampling depth model
UT Biomedical Informatics Lab
Applying the Sampling Depth Model
52/60
6-around-1 adjacent fiber
orientation with medium (series
1), high (series 2), and low
(series 3) absorption.
Sampling depth changes
with wavelength
UT Biomedical Informatics Lab
Pilot Study: Two-Layer MCLUT
Method Applied to In Vivo Data
UT Biomedical Informatics Lab
Study Population and Data
54/60
• 80 Subjects
• IRB approval from UT Austin - #00002030
• 51 males, 29 Females
• Average age of 25.7 years
• Ages 18-46
• Measured spectra from the following
anatomical locations
1. Back
2. Calf
3. Cheek
4. Forearm
5. Palm
• Measured the following
1. Melanin
2. Hemoglobin
3. Scattering
4. Epidermal Thickness
This study is still unpublished
UT Biomedical Informatics Lab
Instrumentation
55/60
x 2
Source Diameter = 40 μm
Ring 1 Diameter = 40 μm
Ring 2 Diameter = 200 μm
Ring 1 SDS = 55 μm
Ring 2 SDS = 205 μm
Unfortunately, data from
ring 1 was unusable
UT Biomedical Informatics Lab
Melanin
56/60
Back Calf Cheek Forearm Palm
0
0.5
1
1.5
2
2.5
3
3.5
4
MelaninConcentration(mg/ml)
Palm has less melanin,
which agrees with the
expected result.
Average of 1.83 mg/ml
is within range of
published values for
melanin concentration
[0-5 mg/ml]
UT Biomedical Informatics Lab
Hemoglobin
57/60
Back Calf Cheek Forearm Palm
0
0.5
1
1.5
2
2.5
3
3.5
HemoglobinConcentration(mg/ml)
Higher levels of
hemoglobin in the face
and forearm agrees
with the expected
results.
Average of 1.37 mg/ml
is within range of
published values for
[Hb]
[0.5-10 mg/ml]
UT Biomedical Informatics Lab
Scattering
58/60
No significant
difference between
anatomical locations.
Average of 22.75 cm-1
is within range of
published values for
scattering at 630 nm
[15 – 25 cm-1]
UT Biomedical Informatics Lab
Epidermal Thickness
59/60
Back Calf Cheek Forearm Palm
0
20
40
60
80
100
120
140
160
EpidermalThickness(mm)
No significant
difference between
anatomical locations.
Average of 90 μm is
within range of
published values for
epidermal thickness.
[40 – 200 μm]
We expected to see a
difference between
anatomical locations.
UT Biomedical Informatics Lab
Conclusions about Pilot Study
A two-layer model can be used to extract
depth dependent properties from in vivo DRS
data
The results agree with previously published
values
However, we expected to see a difference
between anatomical locations for epidermal
thickness
– This could be due to the absence of data from
the inner ring of fibers.
60/60
UT Biomedical Informatics Lab
Conclusions about Pilot Study
Data should be recollected with multiple
SDSs
Additional patient data such as race/ethnicity
and skin color should be documented
61
UT Biomedical Informatics Lab
Overall Conclusions
 The MCLUT method is an accurate and fast way to
analyze DRS data
 A one-layer assumption for skin causes significant
errors in DRS data analysis
 The MCLUT method can be extended to two-layers,
allowing the extraction of depth dependent
properties
 Depth sampling of DRS probes can be tuned by
changing the probe geometry
 DRS can be used to measure the depth dependent
properties of skin in vivo
62/60
UT Biomedical Informatics Lab
Contributions to Field
63
The MCLUT Method Two-Layer MCLUT Method
One-Layer Errors Analysis
DRS Sampling Depth Analysis
UT Biomedical Informatics Lab
Funding
The NIH (R21EB0115892)
The NSF (DGE-1110007)
CPRIT (RP130702)
64
UT Biomedical Informatics Lab
Acknowledgements
65
The Biophotonics Lab
• James W. Tunnell
• Will Goth
• Bin Yang
• Manu Sharma
• Sam Lim
• Sheldon Bish
• Xu Feng
• Varun Patani
The Biomedical Informatics Lab
• Mia K. Markey
• Nishant Verma
• Gezheng Wen
• Clement Sun
• Nisha Kumaraswamy
• Hans Huang
• Juhun Lee
• Gautam Muralidhar
• Daifeng Wang
UT BME Staff
• Margo Cousins
• Brittain Sobey
• Michael Don

Bio-optical Sensing Dissertation

  • 1.
    UT Biomedical InformaticsLab Depth Resolved Diffuse Reflectance Spectroscopy Ricky Hennessy The Biomedical Informatics Lab (BMIL) The Biophotonics Laboratory
  • 2.
    UT Biomedical InformaticsLab Committee 1/60 Mia K. Markey, Ph.D. - Advisor The Biomedical Informatics Lab James W. Tunnell, Ph.D. - Advisor The Biophotonics Lab Stanislav Emelianov, Ph.D. Ultrasound Imaging and Therapeutics Andrew K. Dunn, Ph.D. Functional Optical Imaging Lab Ammar M. Ahmed, M.D. Dermatology at Seton
  • 3.
    UT Biomedical InformaticsLab Diffuse Reflectance Spectroscopy (DRS) 2/60
  • 4.
    UT Biomedical InformaticsLab Applications of DRS 3 Cancer Detection Soil Characterization Wearable Tech Food Quality Endoscopic Surgery Cosmetic Applications
  • 5.
    UT Biomedical InformaticsLab Cancer Detection with DRS 4/60 Extract Features from Data Use Features to Create Classifier Rajaram et al. Lasers Surg Med 42:876-887 (2010)
  • 6.
    UT Biomedical InformaticsLab DRS Instrumentation 5 Spectrometer LightSource SourceFiber DetectorFiber Computer FiberBundle
  • 7.
    UT Biomedical InformaticsLab Light Absorption in Tissue 6/60 400 450 500 550 600 0 0.2 0.4 0.6 0.8 1 WAVELENGTH (nm) ABSORPTION(a.u.) Melanin HbO 2 Hb Other Absorbers • Water • Bilirubin • Lipid • Protein • Collagen
  • 8.
    UT Biomedical InformaticsLab Light Scattering in Tissue 7/60
  • 9.
    UT Biomedical InformaticsLab Biological Origins of Scattering 8/60 Scattering is caused by index of refraction mismatches • Cells = ~10 μm • Nuclei = ~1 μm • Collagen = 0.1 μm • Membranes = 0.01 μm
  • 10.
    UT Biomedical InformaticsLab Scattering Coefficient (μs) 9/60 Scattering coefficient (μs) is proportional to concentration of scatterers in a medium μs -1 is the average distance a photon travels between scattering events μs
  • 11.
    UT Biomedical InformaticsLab Direction of Scattering 10/60 Isotropic Scattering Anisotropic Scattering Tissue scattering is in forward direction (g = ~0.9) Henyey-Greenstein Phase Function g = 0
  • 12.
    UT Biomedical InformaticsLab Radiative Transport Equation (RTE) 11/60 ΔEnergy Scattering in Scattering out Absorption
  • 13.
    UT Biomedical InformaticsLab Reduced Scattering Coefficient 12/60 1 2 10 9 8 7 6 5 43 Using reduced scattering with isotropic scattering is equivalent to larger scattering with anisotropic scattering
  • 14.
    UT Biomedical InformaticsLab Diffusion Approximation to the RTE 13/60 Kienle et al., JOSA A, 1997, 14(1), 246-254 Assumes isotropic scattering • Scattering >> absorption • Source Detector Separation > ~ 1 mm Blood is highly absorbing Epidermis is ~100 μm thick
  • 15.
    UT Biomedical InformaticsLab Monte Carlo Simulation 14/60
  • 16.
  • 17.
  • 18.
    UT Biomedical InformaticsLab The Monte Carlo Lookup Table (MCLUT) Method Hennessy et al., JBO, 2013, 18(3), 037003
  • 19.
    UT Biomedical InformaticsLab Tissue Properties  Optical Properties SCATTERED ABSORBED TISSUE PROPERTIES  OPTICAL PROPERTIES  SIGNAL FORWARD MODEL SCATTERING PROPERTIES ABSORBER CONCENTRATIONS • HbO2 • Hb • Melanin 18/60
  • 20.
    UT Biomedical InformaticsLab Forward Model Flowchart TISSUE PROPERTIES  OPTICAL PROPERTIES  SIGNAL FORWARD MODEL Light Transport Model Scattering at λ0, Concentration of chromophores Calculate absorption and scattering coefficients at each wavelength Scattering Absorption Use light transport model to calculate diffuse reflectance Generate diffuse reflectance spectrum 19/60
  • 21.
    UT Biomedical InformaticsLab Monte Carlo on GPU Modern processor w/ 4 cores = 4 times speedup Modern GPU w/ 500 cores =  500 times speedup!  < $300 Alerstam et al., Biomed. Opt. Express., 2010, 1, 658-675 20/60
  • 22.
    UT Biomedical InformaticsLab Monte Carlo Lookup Table (1 Layer) 400 450 500 550 600 650 700 0 1 2 3 4 5 6 7 8 9 WAVELENGTH (nm) REFLECTANCE 21/60
  • 23.
    UT Biomedical InformaticsLab MCLUT Inverse Model REFLECTANCE OPTICAL PROPERTIES  TISSUE PROPERTIES Optimization Routine 22/60
  • 24.
    UT Biomedical InformaticsLab Calibration MCLUT Modeled Spectra RMC = photons counted Measured Spectra Rmeas = Iraw/Istandard Modeled spectra and measured spectra have same optical properties 23/60
  • 25.
    UT Biomedical InformaticsLab Validation of One-Layer Model RMSPE = 2.42% RMSPE = 1.74% Validation with 3 X 6 matrix of phantoms containing hemoglobin and polystyrene beads. Decreased percent error of 3.16% and 10.86% for μs' and μa, respectively, when compared to experimental LUT method 24/60
  • 26.
    UT Biomedical InformaticsLab Errors Caused by One-Layer Assumption for Skin Hennessy et al., JBO, 2015, 20(2), 027001
  • 27.
    UT Biomedical InformaticsLab Fit Two-Layer Data with One Layer Model 26/60 Hb + HbO2 melanin melanin + Hb + HbO2 1. Create two-layer spectra 2. Fit with one- layer model • [mel] • [Hb] • SO2 • Scattering • Epidermal thickness • [mel] • [Hb] • SO2 • Scattering • Vessel radius Notice that the fit is very good
  • 28.
    UT Biomedical InformaticsLab Melanin 27/60 • One-Layer model underestimates [mel] • Magnitude of error is dependent on epidermal thickness (Z0) • Z0 Error
  • 29.
    UT Biomedical InformaticsLab Hemoglobin 28/60 • One-Layer model underestimates [Hb] • Magnitude of error is dependent on epidermal thickness (Z0) • Z0 Error
  • 30.
    UT Biomedical InformaticsLab Oxygen Saturation 29/60 • One-Layer model overestimates SO2 when SO2 < 50% • One-Layer model underestimates SO2 when SO2 > 50% • Magnitude of error is dependent on epidermal thickness (Z0) • Z0 Error
  • 31.
    UT Biomedical InformaticsLab Pigment Packaging 30/60 • In tissue, blood is confined to vessels • This significantly reduces the optical path length where absorption is high (Soret Band) • Causes a flattening of the absorption spectrum
  • 32.
    UT Biomedical InformaticsLab Vessel Radius vs. Epidermal Thickness 31/60 0 50 100 150 200 250 300 0 50 100 150 200 250 300 350 400 450 500 Top Layer Thickness (mm) VesselRadius(mm) • Vessel radius (pigment packaging) factor is highly correlated with top-layer thickness • Pigment packaging factor is likely a combination of vessel packaging and epidermal thickness
  • 33.
    UT Biomedical InformaticsLab Correlation Between [Hb] and [mel] 32/60 R = 0.04 R = 0.80 One-layer assumption causes artificial correlation between [Hb] and [mel]
  • 34.
    UT Biomedical InformaticsLab Conclusions about One-Layer Errors Causes underestimation of [Hb] and [mel] – Magnitude of error is function of epidermal thickness Causes error in SO2 that is a function of epidermal thickness as well as SO2 Vessel Packaging factor and epidermal thickness are highly correlated Causes an artificial correlation in [Hb] and [mel] 33/60
  • 35.
    UT Biomedical InformaticsLab The Two-Layer Monte Carlo Lookup Table Method Sharma, Hennessy et al., Biomed Optics Express, 2014, 5(1), 40-53
  • 36.
    UT Biomedical InformaticsLab Motivation of Two-Layer Model Epidermis Dermis Stratum Corneum Melanin Hemoglobin 35/60
  • 37.
    UT Biomedical InformaticsLab Motivation of Two-Layer Model • Pigmentary disorder studies • Disease (rosacea, lupus, scleroderma, morphea, lymphederma) monitoring • Treatment outcome measures for many cosmetic procedures • Topical medical absorption studies • Measuring thickness of psoriatic plaque • Determination of epidermal thickness Melasma Method of melasma treatment depends on depth of melanin Wood’s lamp is current method to determine location of melanin Qualitative – More contrast for epidermal melasma. Doesn’t work for patients with dark skin. Asawansa et al., Int. J. Derm, 1999, 38, 801-807 36/60
  • 38.
    UT Biomedical InformaticsLab Two Layer MCLUT We can create a 5D LUT 1. Top layer absorption 2. Bottom layer absorption 3. Scattering 4. Top layer thickness 5. SDS 37/60 Segment of 5D lookup table • Z0 = 200 μm • SDS = 200 μm • R1 = R2 = 100 μm Sharma, Hennessy et al., Biomed. Opt. Express, 2014, 5(1), 40-53
  • 39.
    UT Biomedical InformaticsLab Two-Layer Forward Model 38/60
  • 40.
    UT Biomedical InformaticsLab Two-Layer MCLUT Inverse Model 39/60
  • 41.
    UT Biomedical InformaticsLab Two-Layer Phantom Construction 40/60
  • 42.
    UT Biomedical InformaticsLab Phantom Validation Study PHANTOM μs’ (mm-1) μa,t (mm-1) μa,b (mm-1) 1 1.5 0.25 1.275 2 1.5 0.25 1.275 3 1.5 2.3 0.25 4 1.5 2.3 0.25 5 1.5 0.25 2.3 6 1.5 0.25 2.3 7 2.85 0.25 2.3 8 2.85 0.25 2.3 9 2.85 2.3 0.25 10 2.85 1.275 0.25 11 2.85 1.275 2.3 12 0.75 0.25 1.275 13 0.75 1.275 0.25 14 0.75 0.25 2.3 Set of Two Layer Phantoms Range of scattering and absorption in skin μs’ = 1-3 mm-1 μa = 0 – 2.3 mm-1 Nichols et al., JBO, 2012, 17(5), 057001 41/60
  • 43.
    UT Biomedical InformaticsLab Phantom Data 42/60
  • 44.
    UT Biomedical InformaticsLab Results: Top Layer Thickness 43/60 Error = 10% for Z0 < 500 μm Photons are not sampling this deep.
  • 45.
    UT Biomedical InformaticsLab Results: All Optical Properties 44/60
  • 46.
    UT Biomedical InformaticsLab Results: Dependence on SDS 45/60 Main Takeaway Accuracy of extracted parameters is dependent on probe geometry. This is due to sampling depth of probe.
  • 47.
    UT Biomedical InformaticsLab Sampling Depth of Diffuse Reflectance Spectroscopy Probes Hennessy et al., JBO, 2014, 19(10), 107002
  • 48.
    UT Biomedical InformaticsLab Probe Geometry and Sampling Depth 47 Tissue Source Fiber Detection Fiber SDS Sampling Depth Z(μa,μs’,rS,rD,SDS) rS rD -Tissue Optical Properties -Source/Detector Fiber Sizes -Source/Detector Separation * Credit to Will Goth for this slide 47/60
  • 49.
    UT Biomedical InformaticsLab Defining Sampling Depth 48/60 This experiment was performed computationally (MC simulation) and experimentally (phantoms)
  • 50.
    UT Biomedical InformaticsLab Experimental Validation 49/60 E = 1.71% E = 1.27% E = 1.24% SDS = 370 μm SDS = 740 μm SDS = 1110 μm Look at axes to see deeper sampling for larger SDSs
  • 51.
    UT Biomedical InformaticsLab Analytical Model of Sampling Depth 50/60 This expression can be used to aid in the design of application specific DRS probesE = 2.89% Expression was found using TableCurve 3D. Free parameters [a1, a2, a3, a4] were selected using a least-squares fitting algorithm.
  • 52.
    UT Biomedical InformaticsLab Choice of g and Phase Function 51/60 The choice for g and phase function had negligible impact on the sampling depth model
  • 53.
    UT Biomedical InformaticsLab Applying the Sampling Depth Model 52/60 6-around-1 adjacent fiber orientation with medium (series 1), high (series 2), and low (series 3) absorption. Sampling depth changes with wavelength
  • 54.
    UT Biomedical InformaticsLab Pilot Study: Two-Layer MCLUT Method Applied to In Vivo Data
  • 55.
    UT Biomedical InformaticsLab Study Population and Data 54/60 • 80 Subjects • IRB approval from UT Austin - #00002030 • 51 males, 29 Females • Average age of 25.7 years • Ages 18-46 • Measured spectra from the following anatomical locations 1. Back 2. Calf 3. Cheek 4. Forearm 5. Palm • Measured the following 1. Melanin 2. Hemoglobin 3. Scattering 4. Epidermal Thickness This study is still unpublished
  • 56.
    UT Biomedical InformaticsLab Instrumentation 55/60 x 2 Source Diameter = 40 μm Ring 1 Diameter = 40 μm Ring 2 Diameter = 200 μm Ring 1 SDS = 55 μm Ring 2 SDS = 205 μm Unfortunately, data from ring 1 was unusable
  • 57.
    UT Biomedical InformaticsLab Melanin 56/60 Back Calf Cheek Forearm Palm 0 0.5 1 1.5 2 2.5 3 3.5 4 MelaninConcentration(mg/ml) Palm has less melanin, which agrees with the expected result. Average of 1.83 mg/ml is within range of published values for melanin concentration [0-5 mg/ml]
  • 58.
    UT Biomedical InformaticsLab Hemoglobin 57/60 Back Calf Cheek Forearm Palm 0 0.5 1 1.5 2 2.5 3 3.5 HemoglobinConcentration(mg/ml) Higher levels of hemoglobin in the face and forearm agrees with the expected results. Average of 1.37 mg/ml is within range of published values for [Hb] [0.5-10 mg/ml]
  • 59.
    UT Biomedical InformaticsLab Scattering 58/60 No significant difference between anatomical locations. Average of 22.75 cm-1 is within range of published values for scattering at 630 nm [15 – 25 cm-1]
  • 60.
    UT Biomedical InformaticsLab Epidermal Thickness 59/60 Back Calf Cheek Forearm Palm 0 20 40 60 80 100 120 140 160 EpidermalThickness(mm) No significant difference between anatomical locations. Average of 90 μm is within range of published values for epidermal thickness. [40 – 200 μm] We expected to see a difference between anatomical locations.
  • 61.
    UT Biomedical InformaticsLab Conclusions about Pilot Study A two-layer model can be used to extract depth dependent properties from in vivo DRS data The results agree with previously published values However, we expected to see a difference between anatomical locations for epidermal thickness – This could be due to the absence of data from the inner ring of fibers. 60/60
  • 62.
    UT Biomedical InformaticsLab Conclusions about Pilot Study Data should be recollected with multiple SDSs Additional patient data such as race/ethnicity and skin color should be documented 61
  • 63.
    UT Biomedical InformaticsLab Overall Conclusions  The MCLUT method is an accurate and fast way to analyze DRS data  A one-layer assumption for skin causes significant errors in DRS data analysis  The MCLUT method can be extended to two-layers, allowing the extraction of depth dependent properties  Depth sampling of DRS probes can be tuned by changing the probe geometry  DRS can be used to measure the depth dependent properties of skin in vivo 62/60
  • 64.
    UT Biomedical InformaticsLab Contributions to Field 63 The MCLUT Method Two-Layer MCLUT Method One-Layer Errors Analysis DRS Sampling Depth Analysis
  • 65.
    UT Biomedical InformaticsLab Funding The NIH (R21EB0115892) The NSF (DGE-1110007) CPRIT (RP130702) 64
  • 66.
    UT Biomedical InformaticsLab Acknowledgements 65 The Biophotonics Lab • James W. Tunnell • Will Goth • Bin Yang • Manu Sharma • Sam Lim • Sheldon Bish • Xu Feng • Varun Patani The Biomedical Informatics Lab • Mia K. Markey • Nishant Verma • Gezheng Wen • Clement Sun • Nisha Kumaraswamy • Hans Huang • Juhun Lee • Gautam Muralidhar • Daifeng Wang UT BME Staff • Margo Cousins • Brittain Sobey • Michael Don