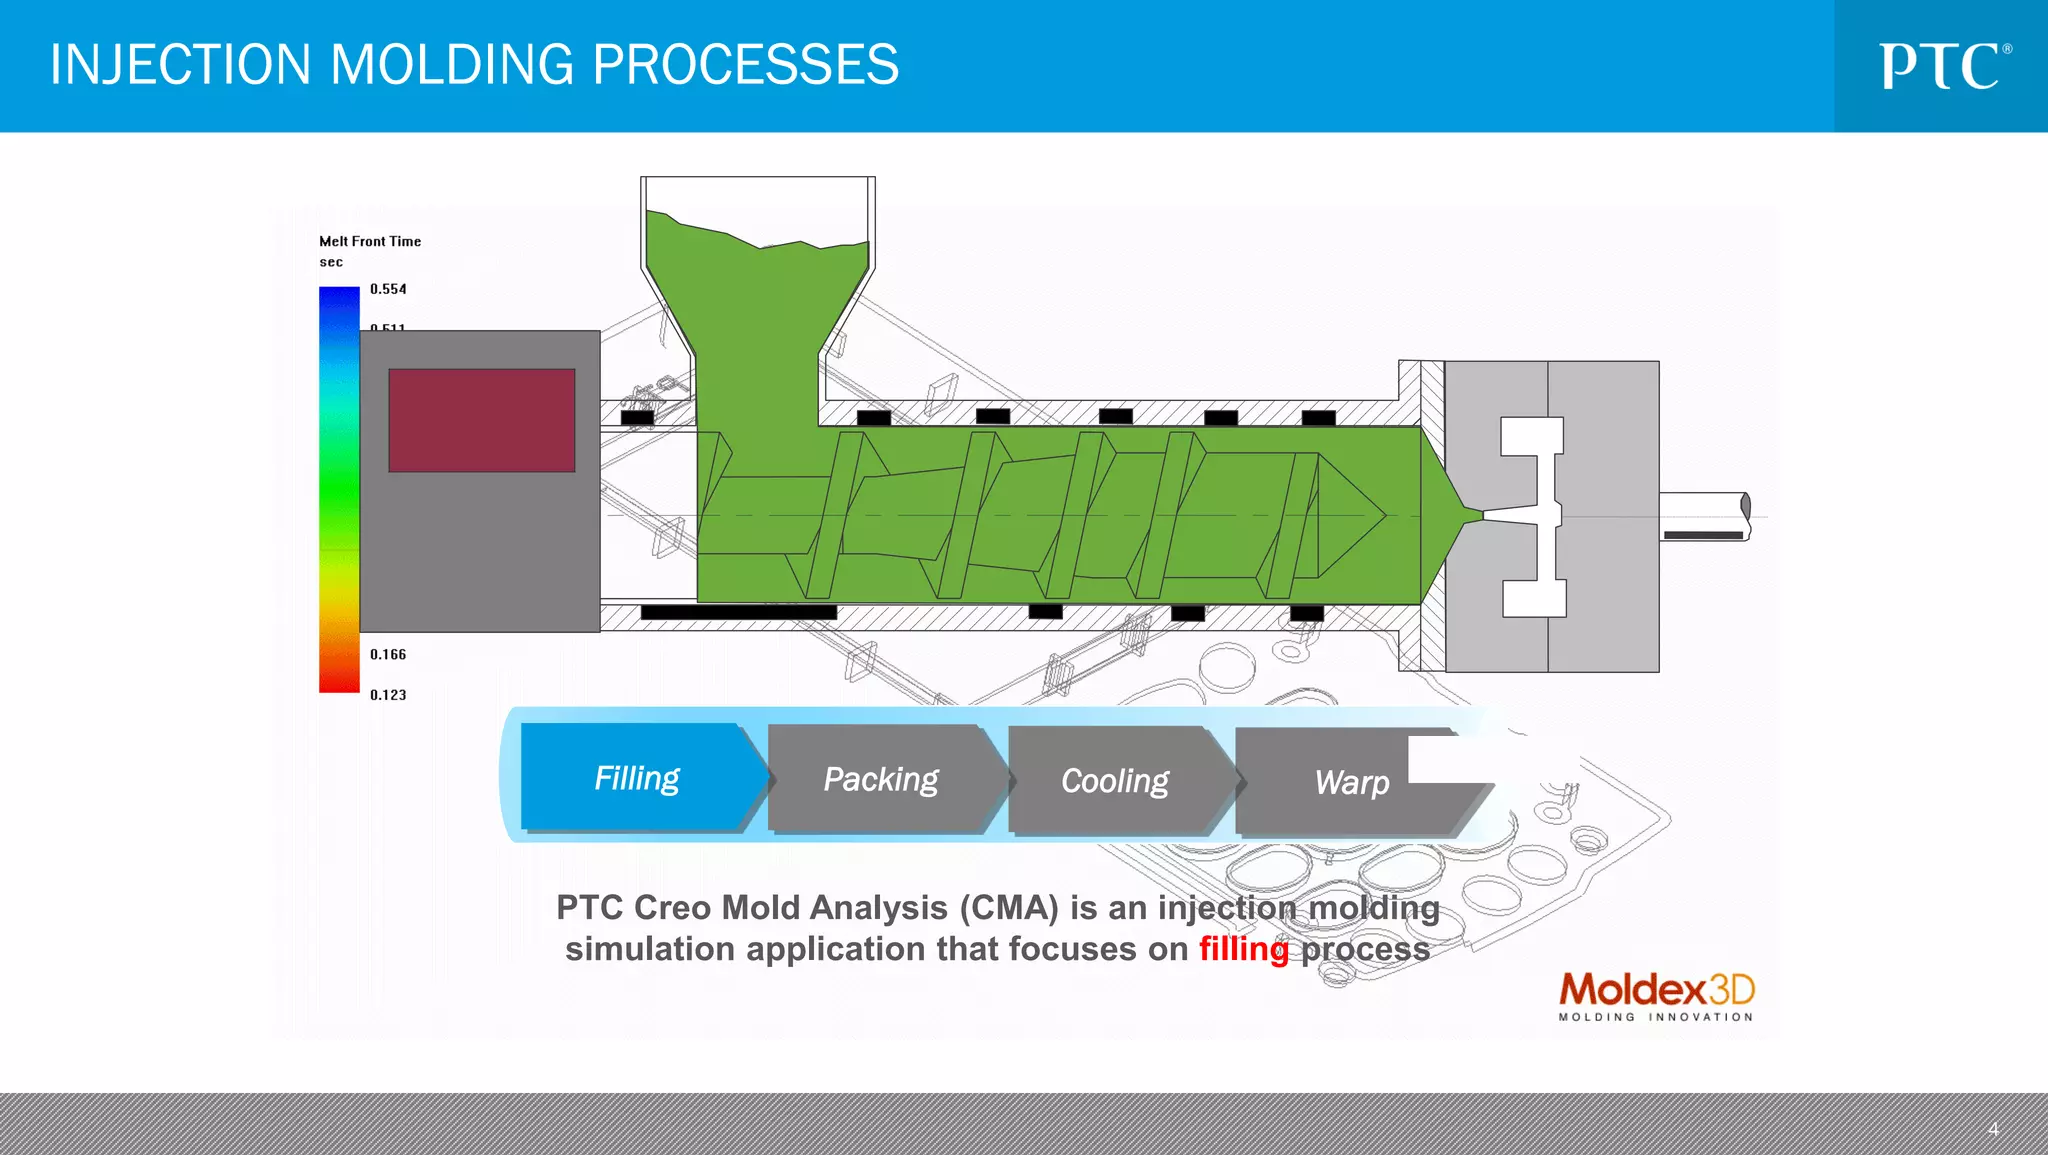
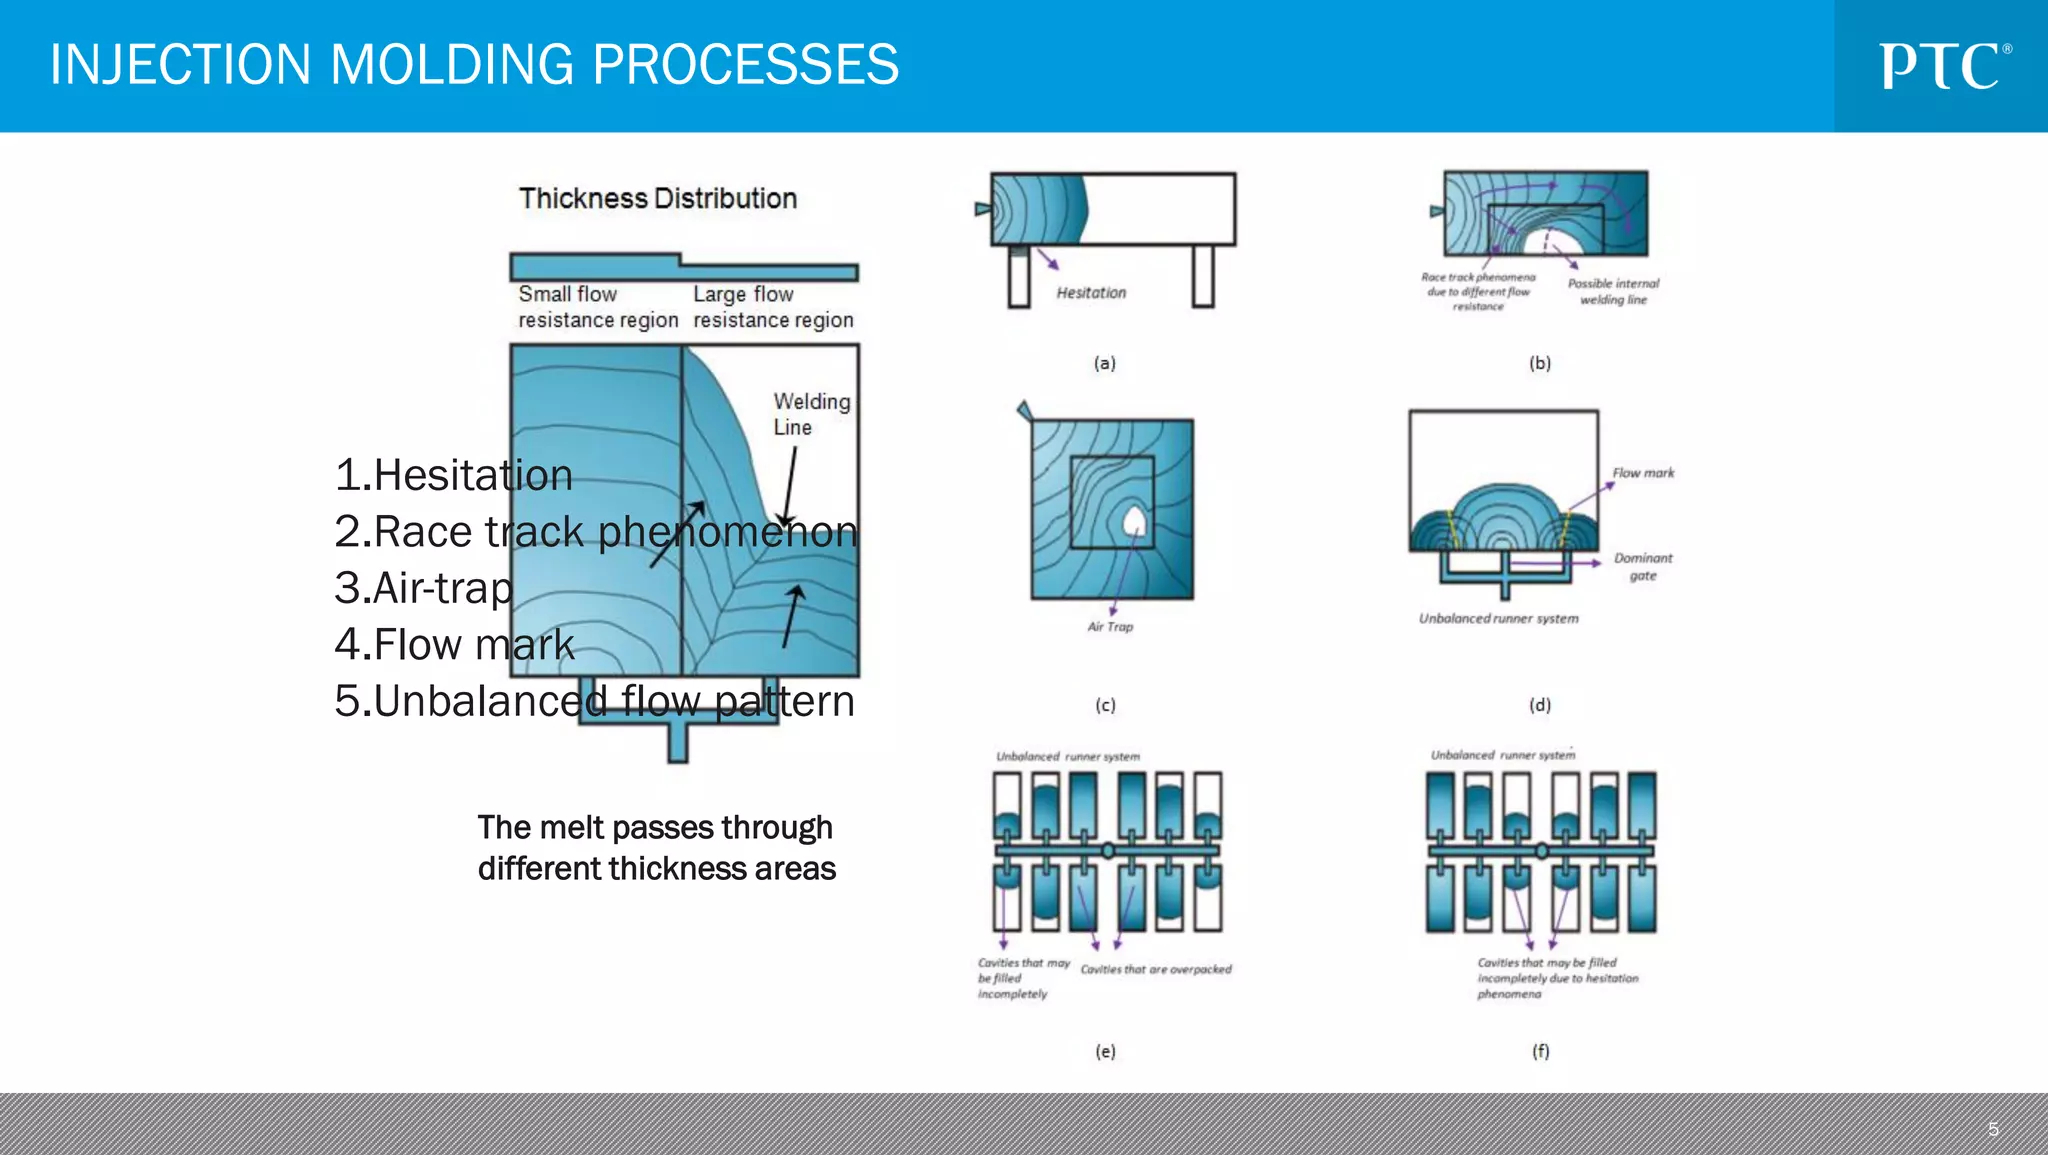
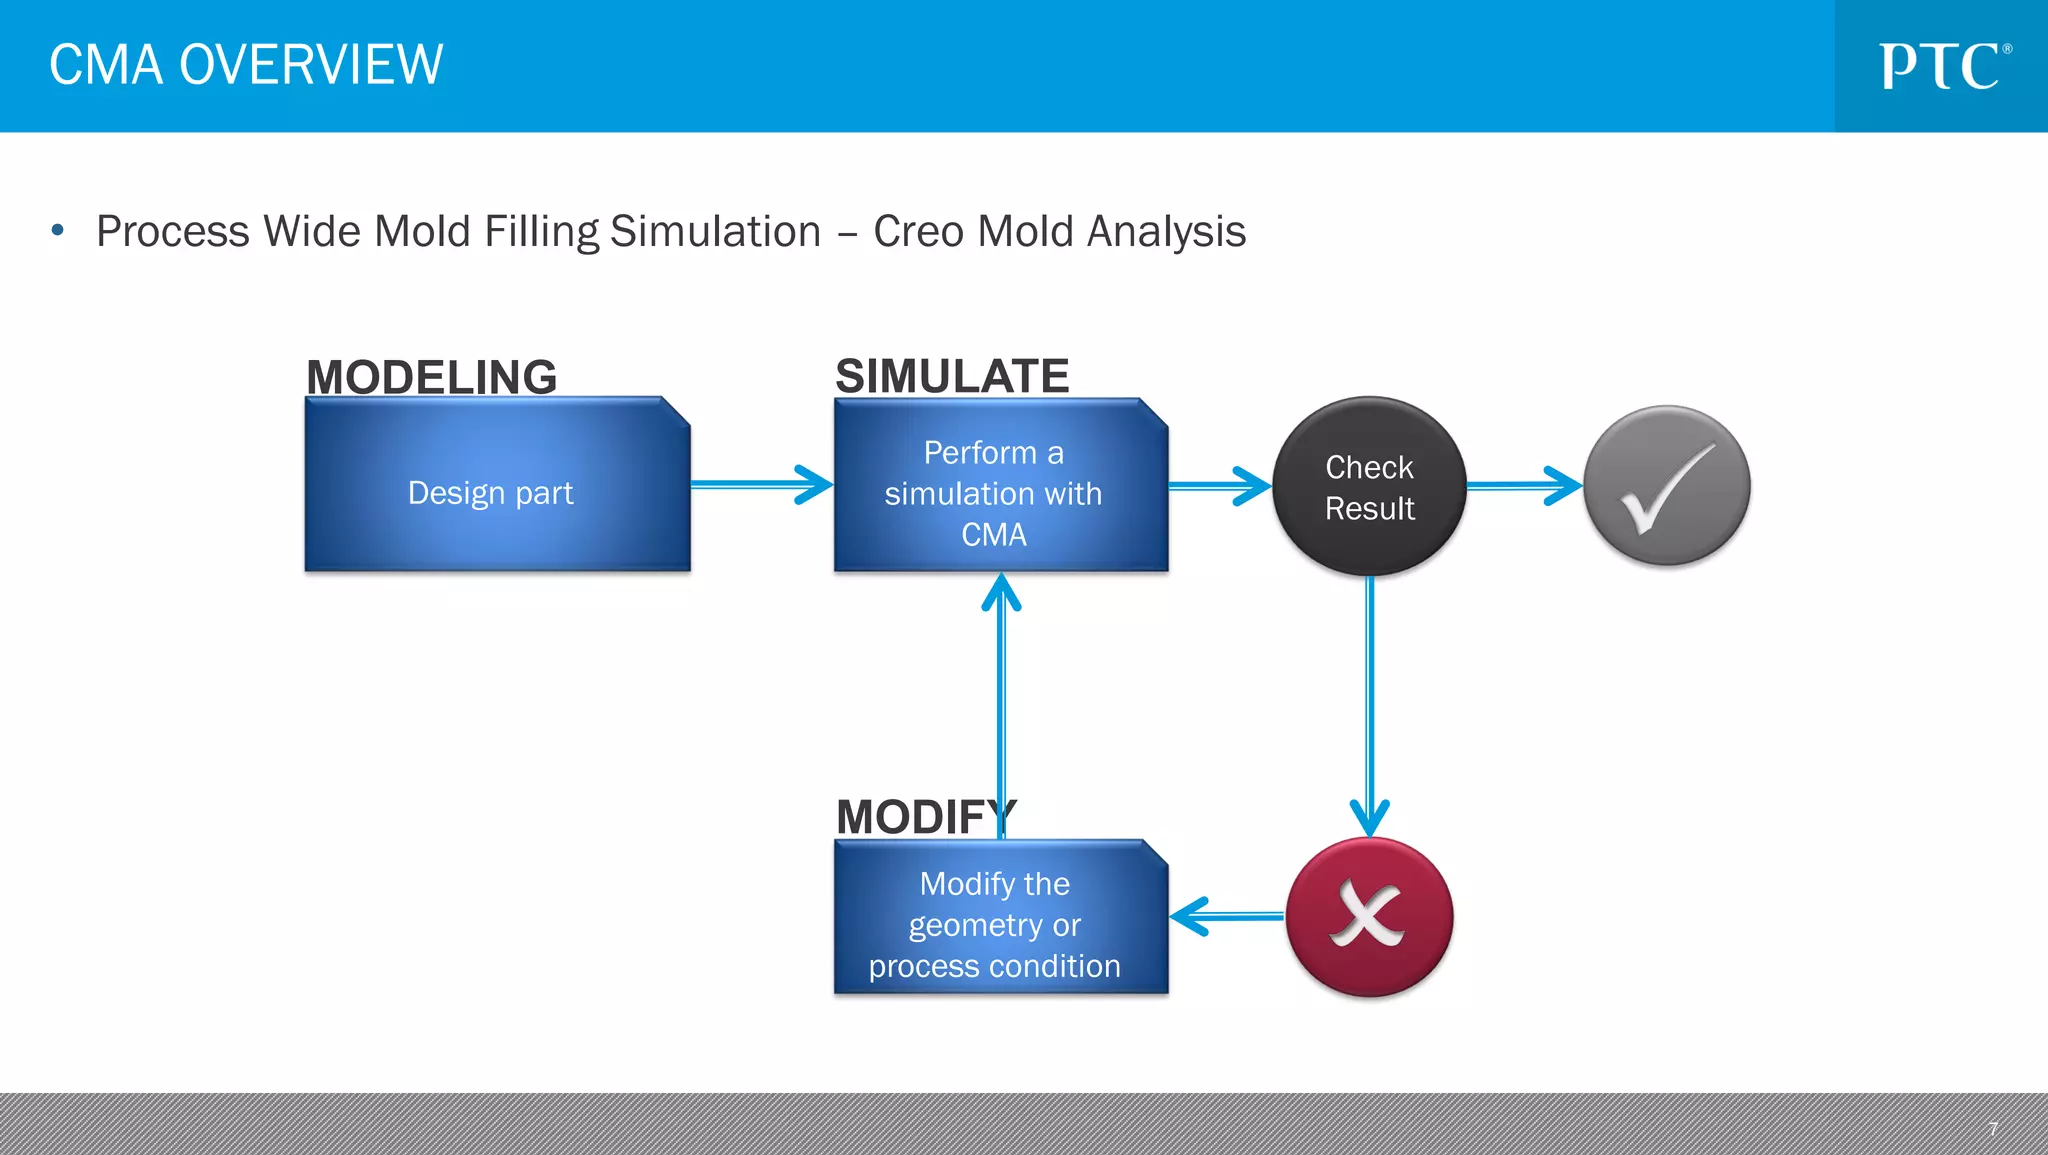
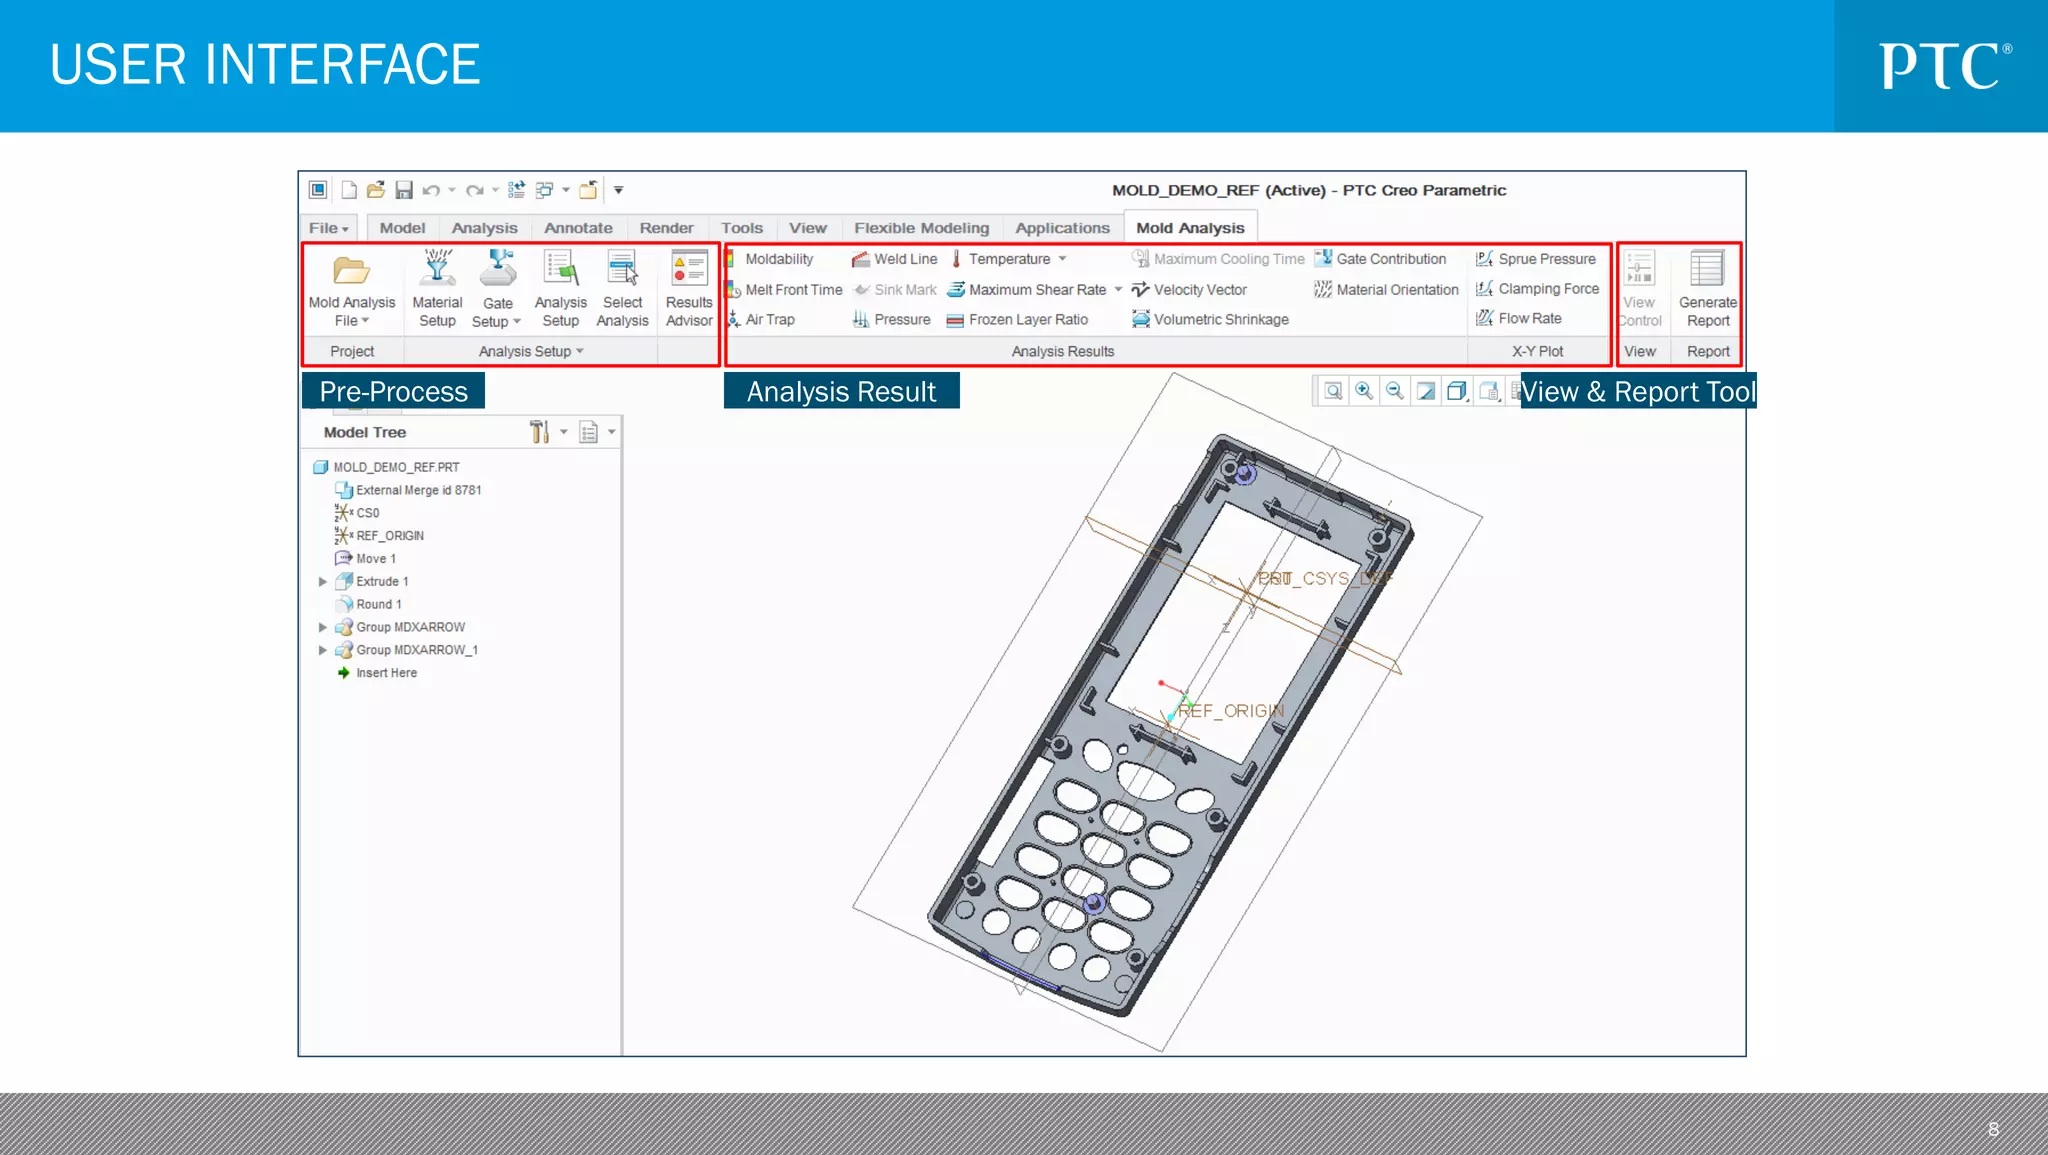
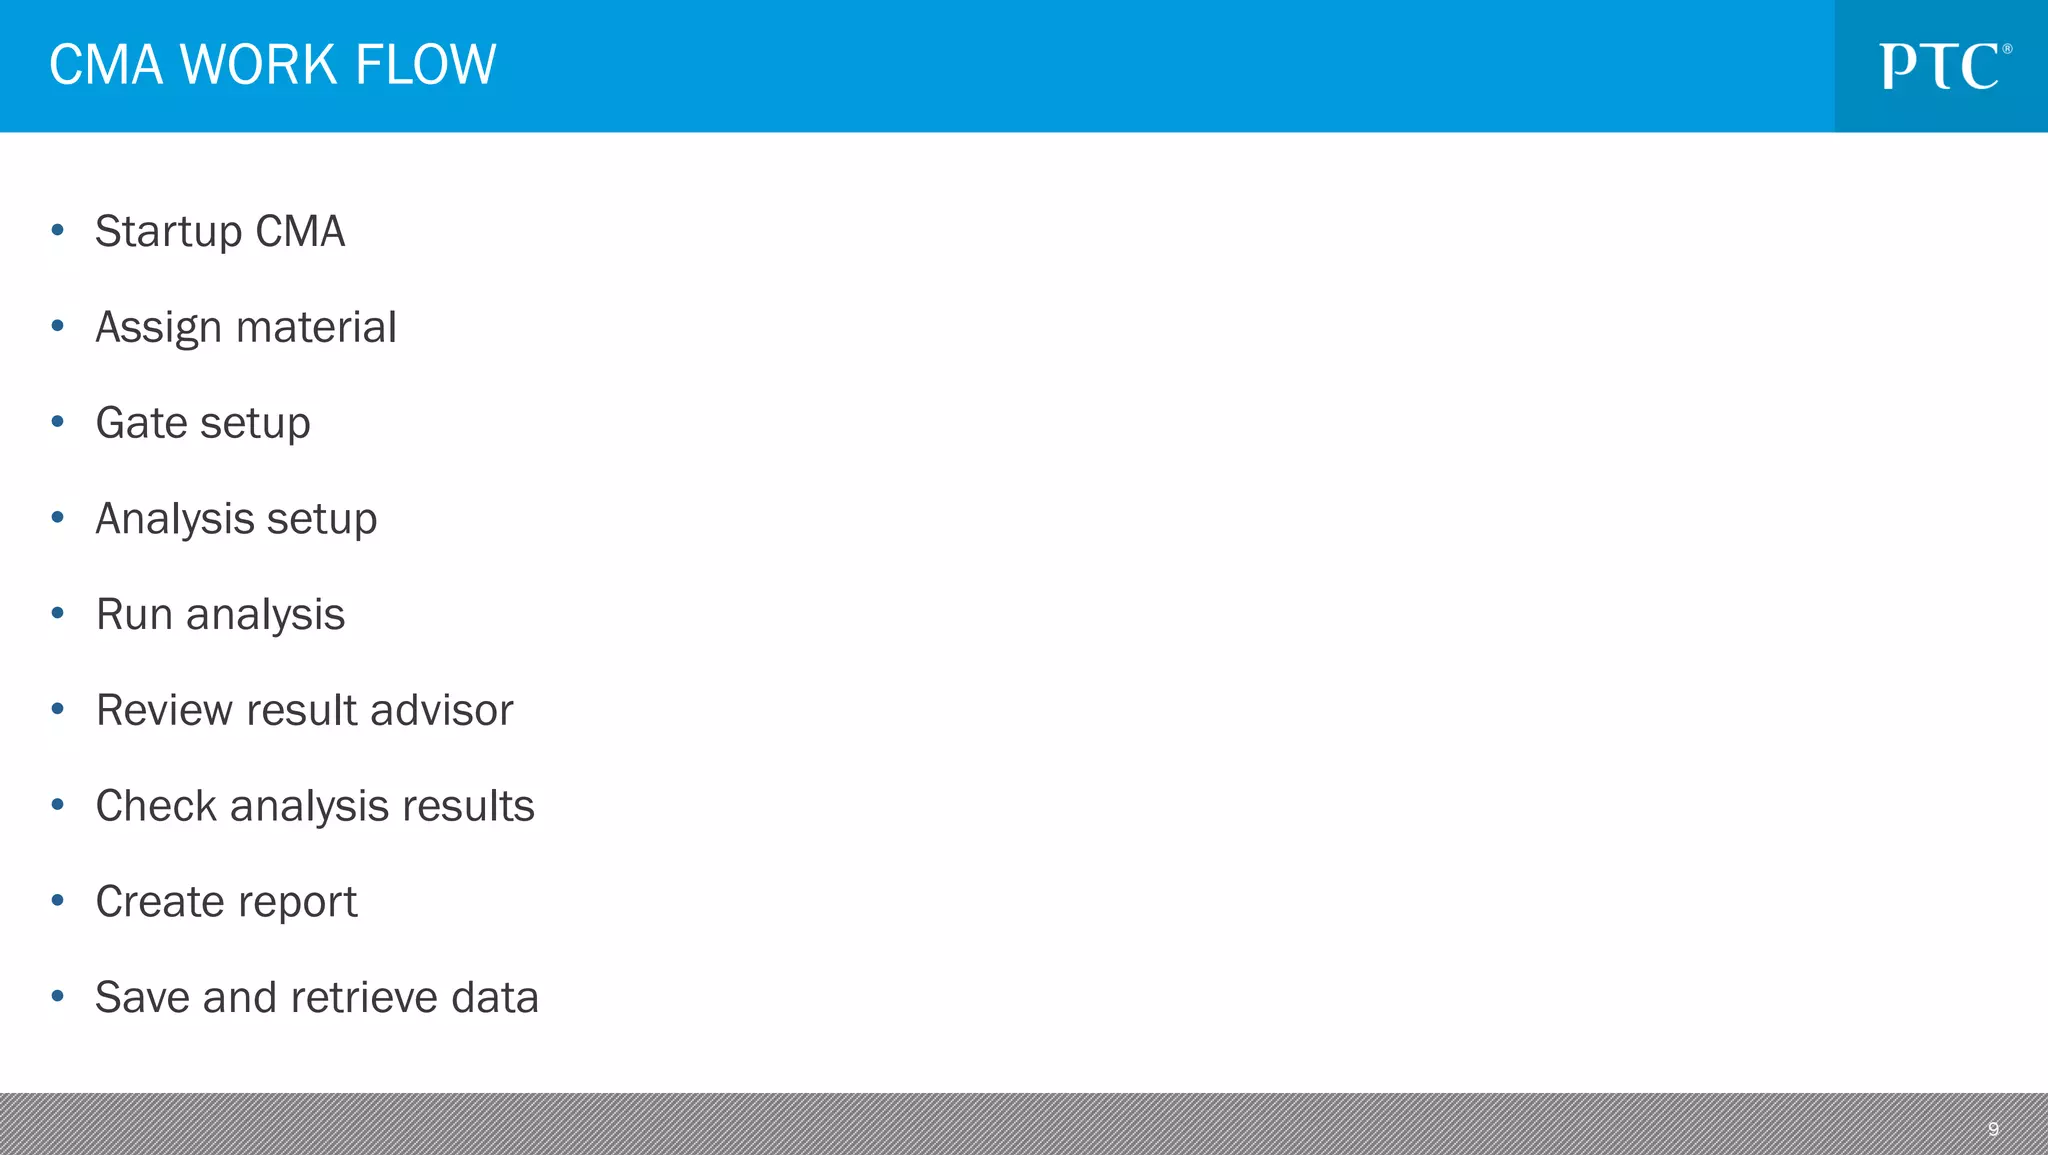
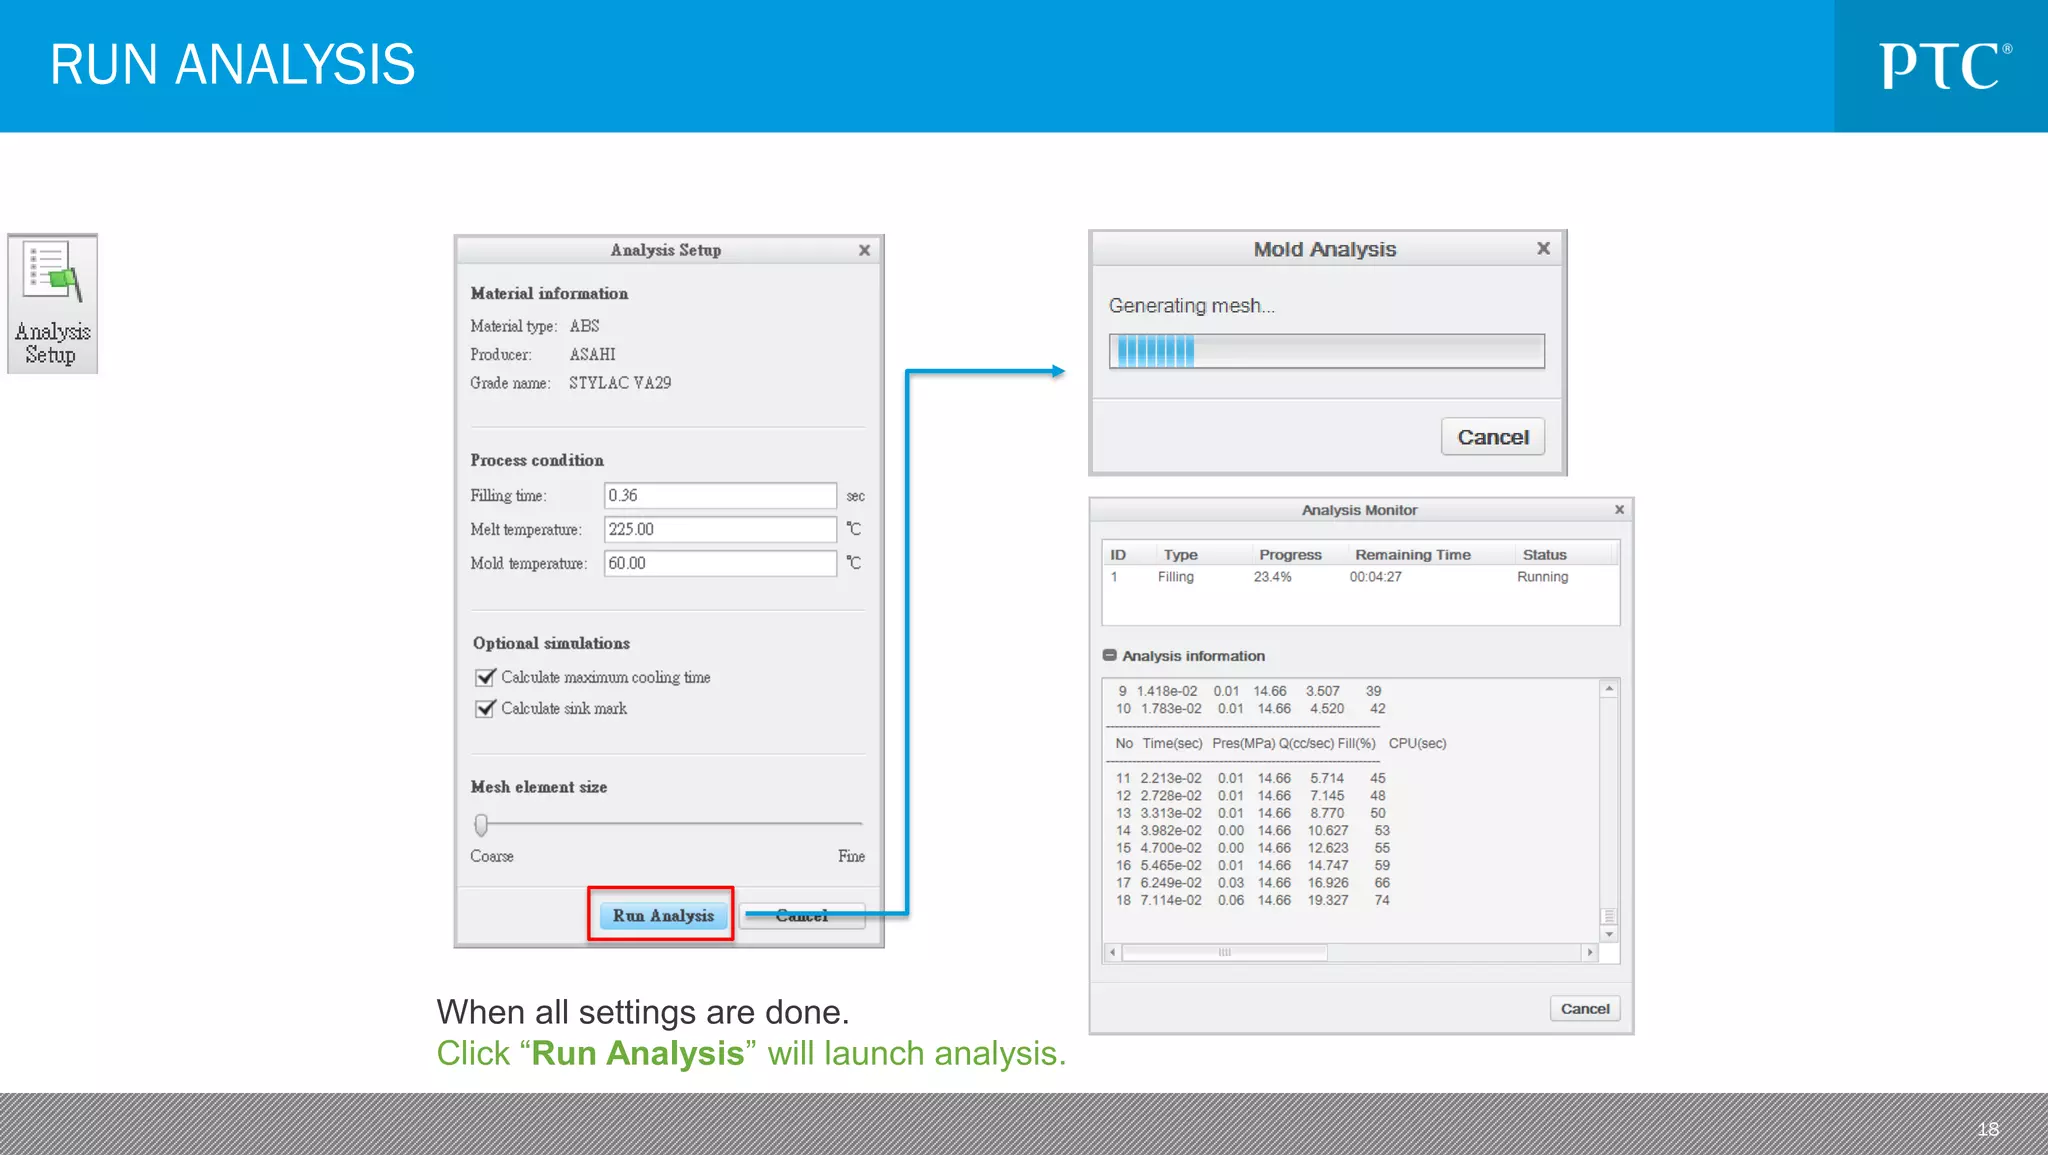
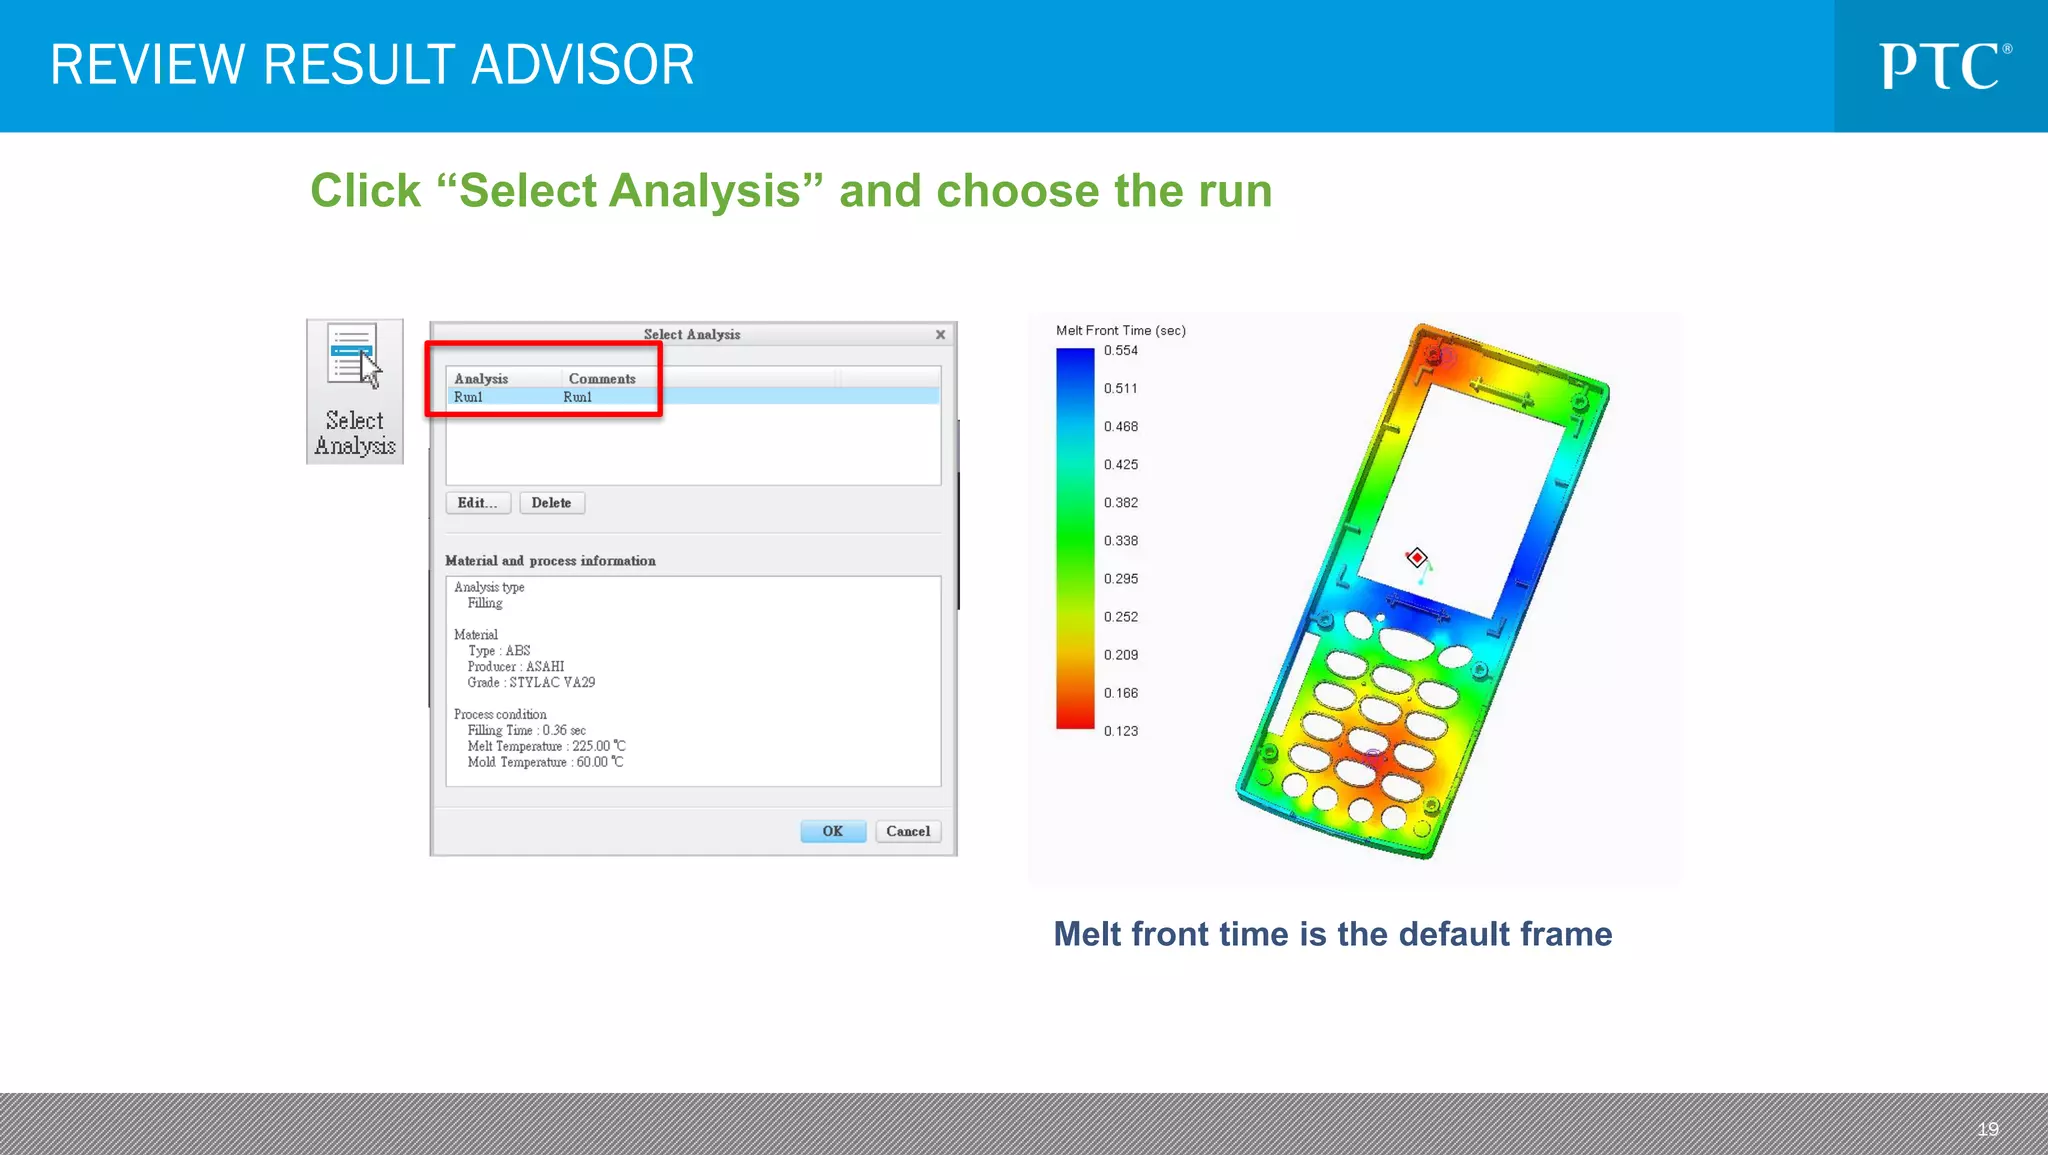
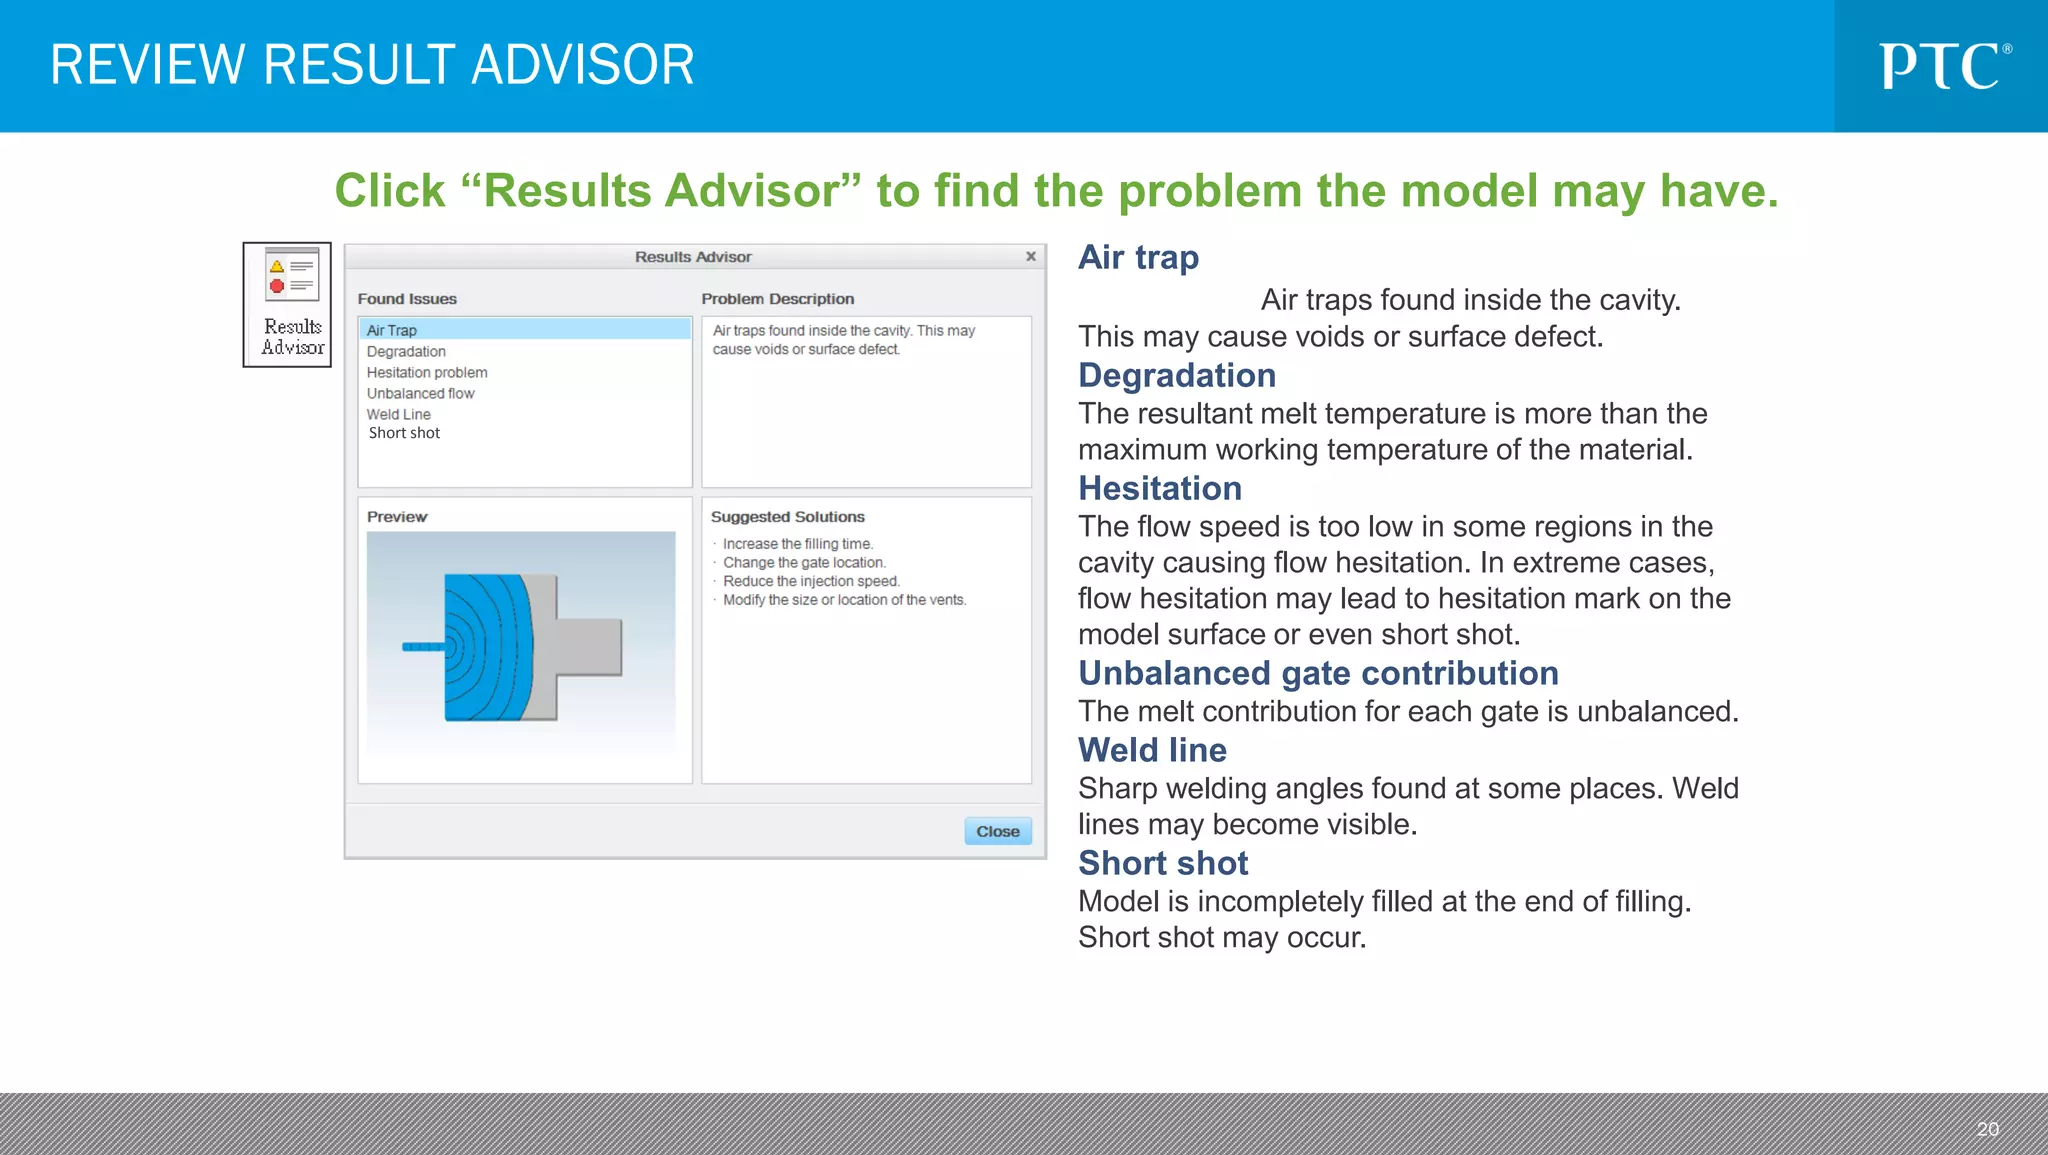
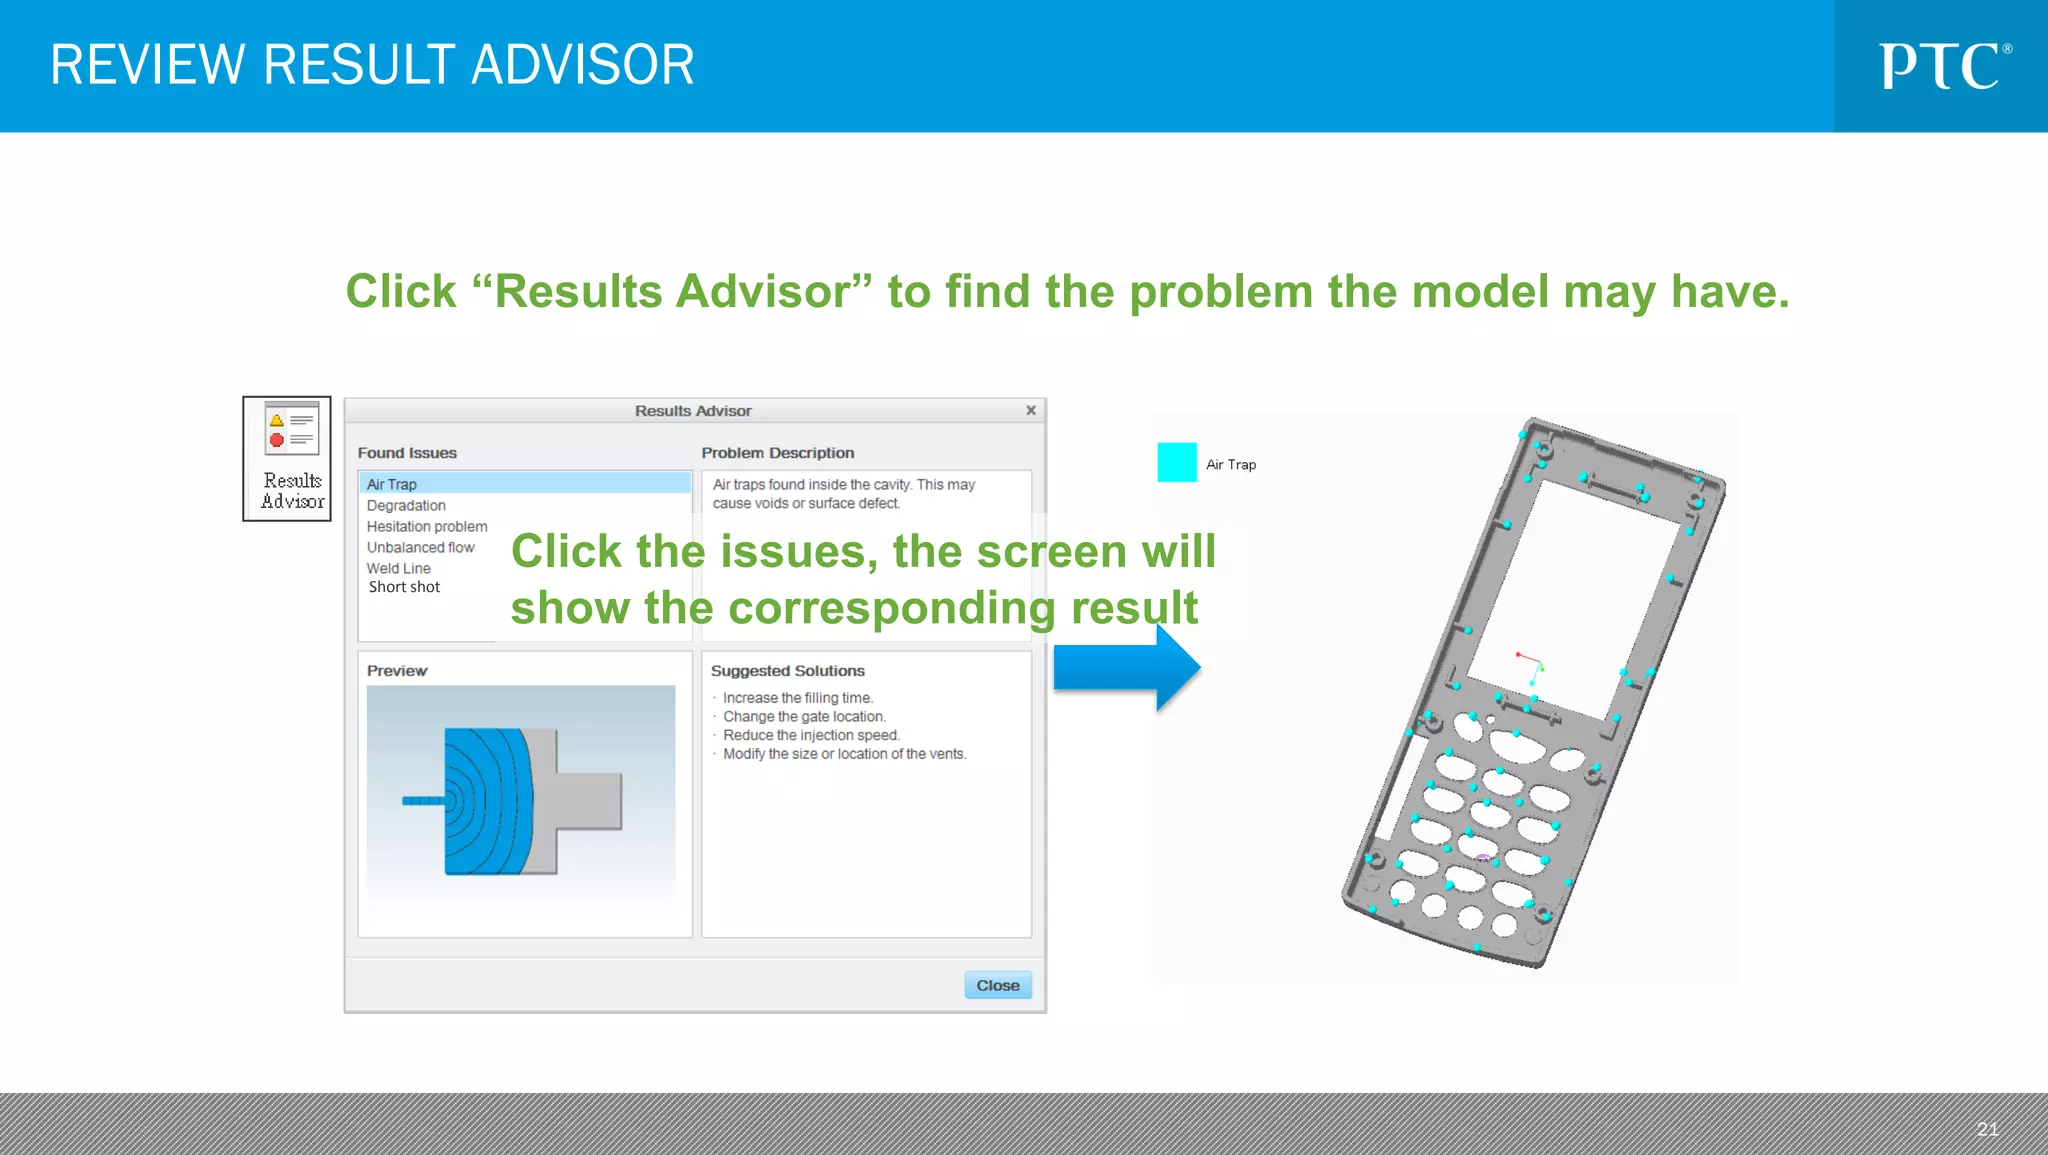
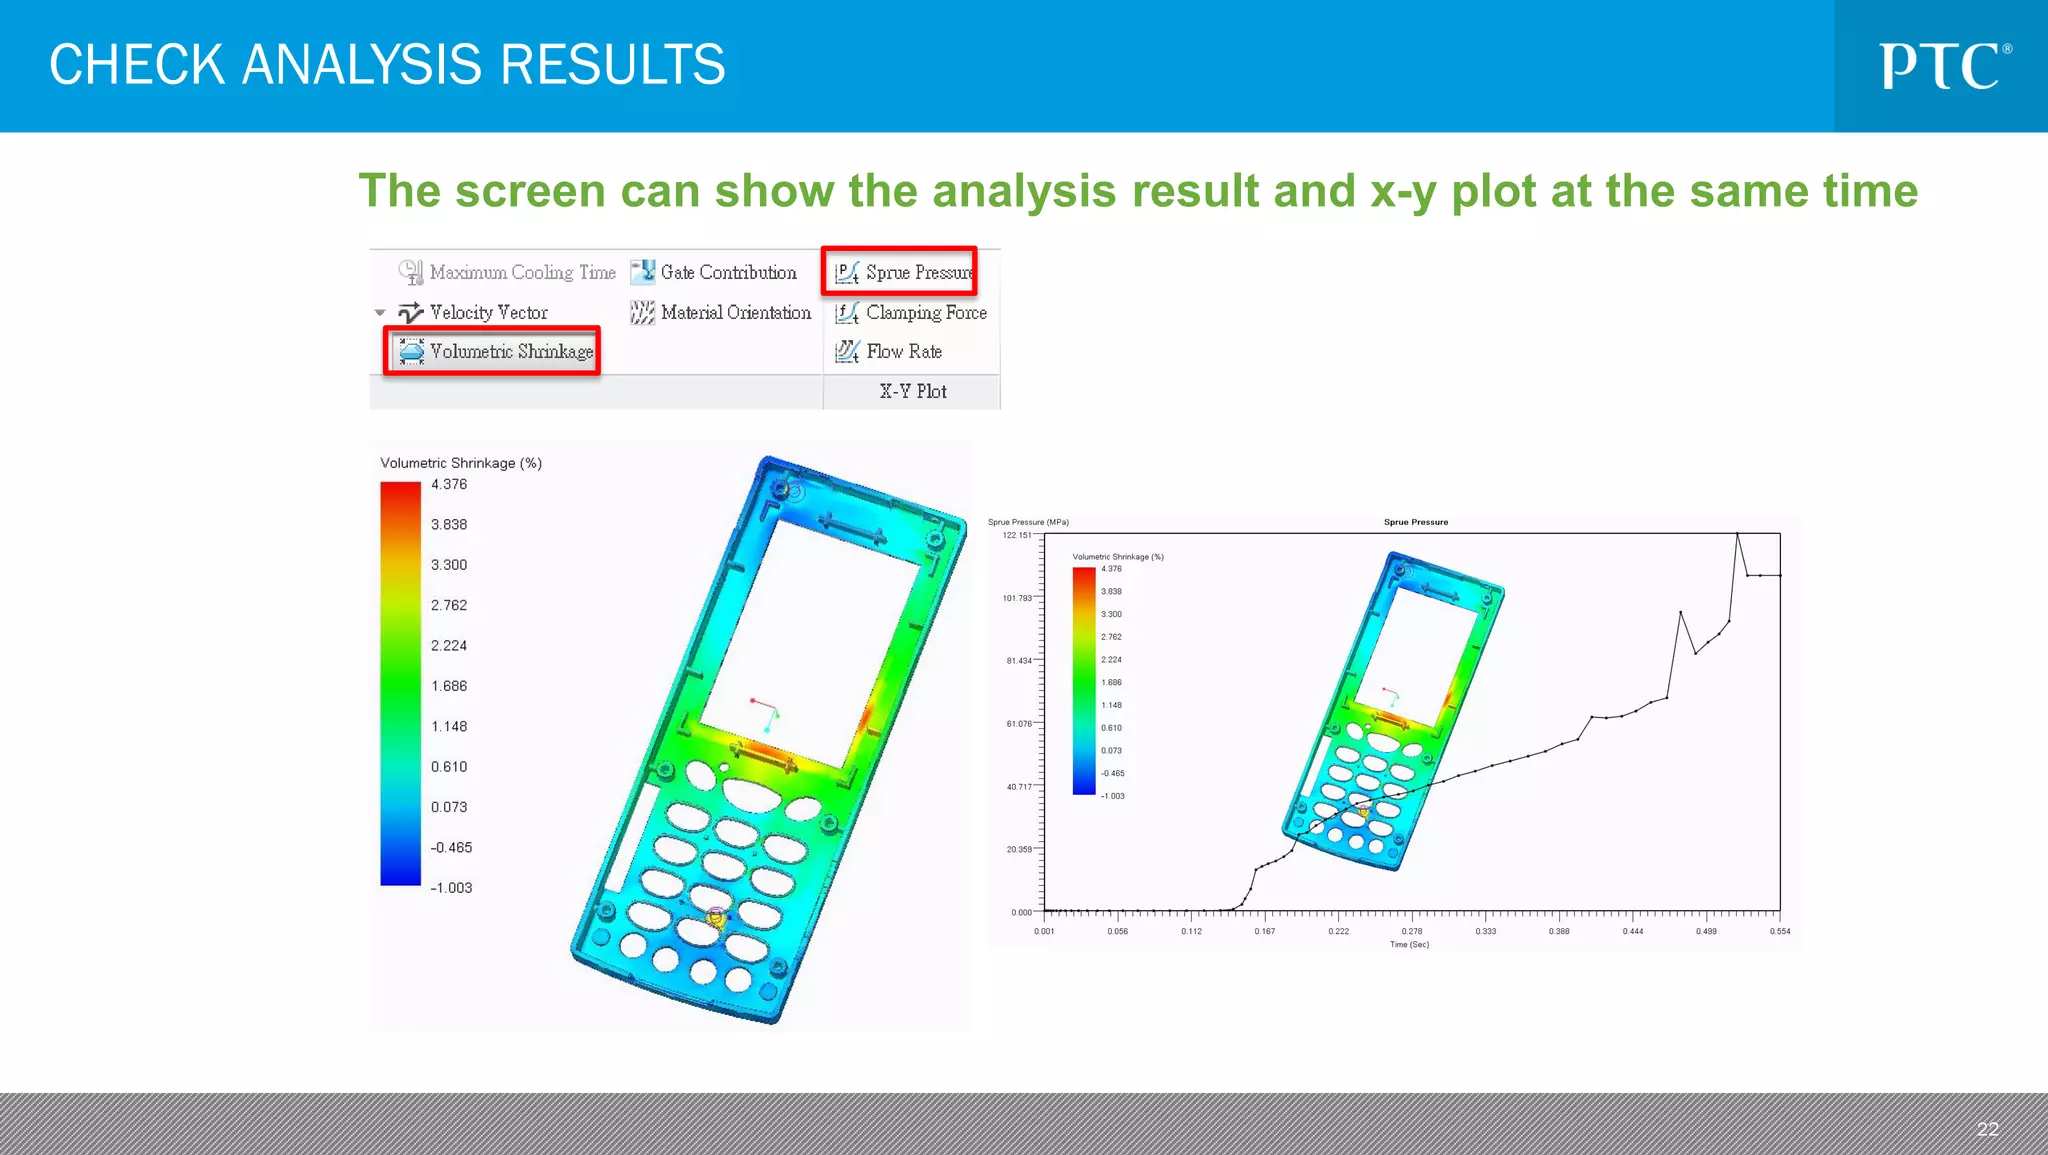
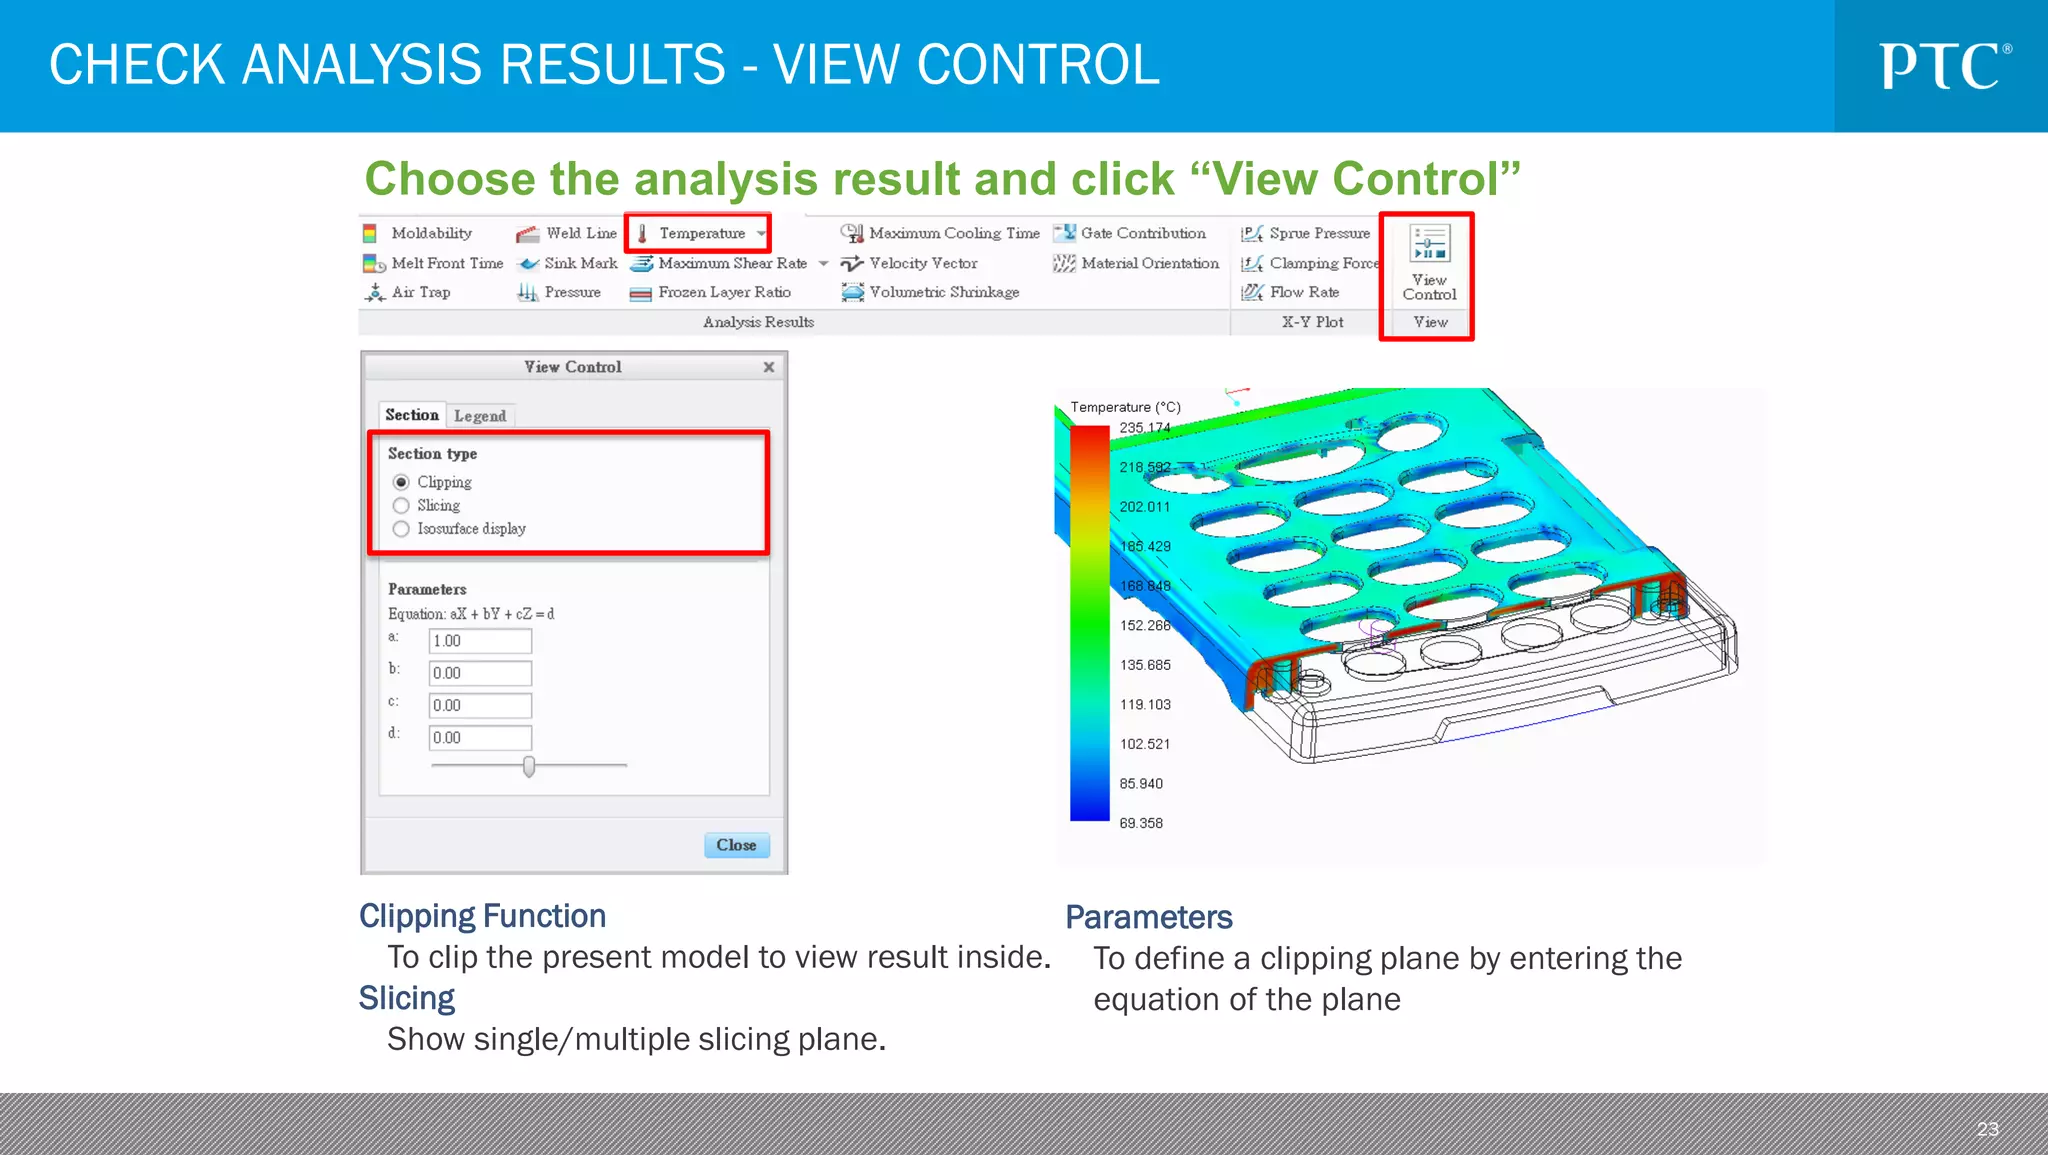
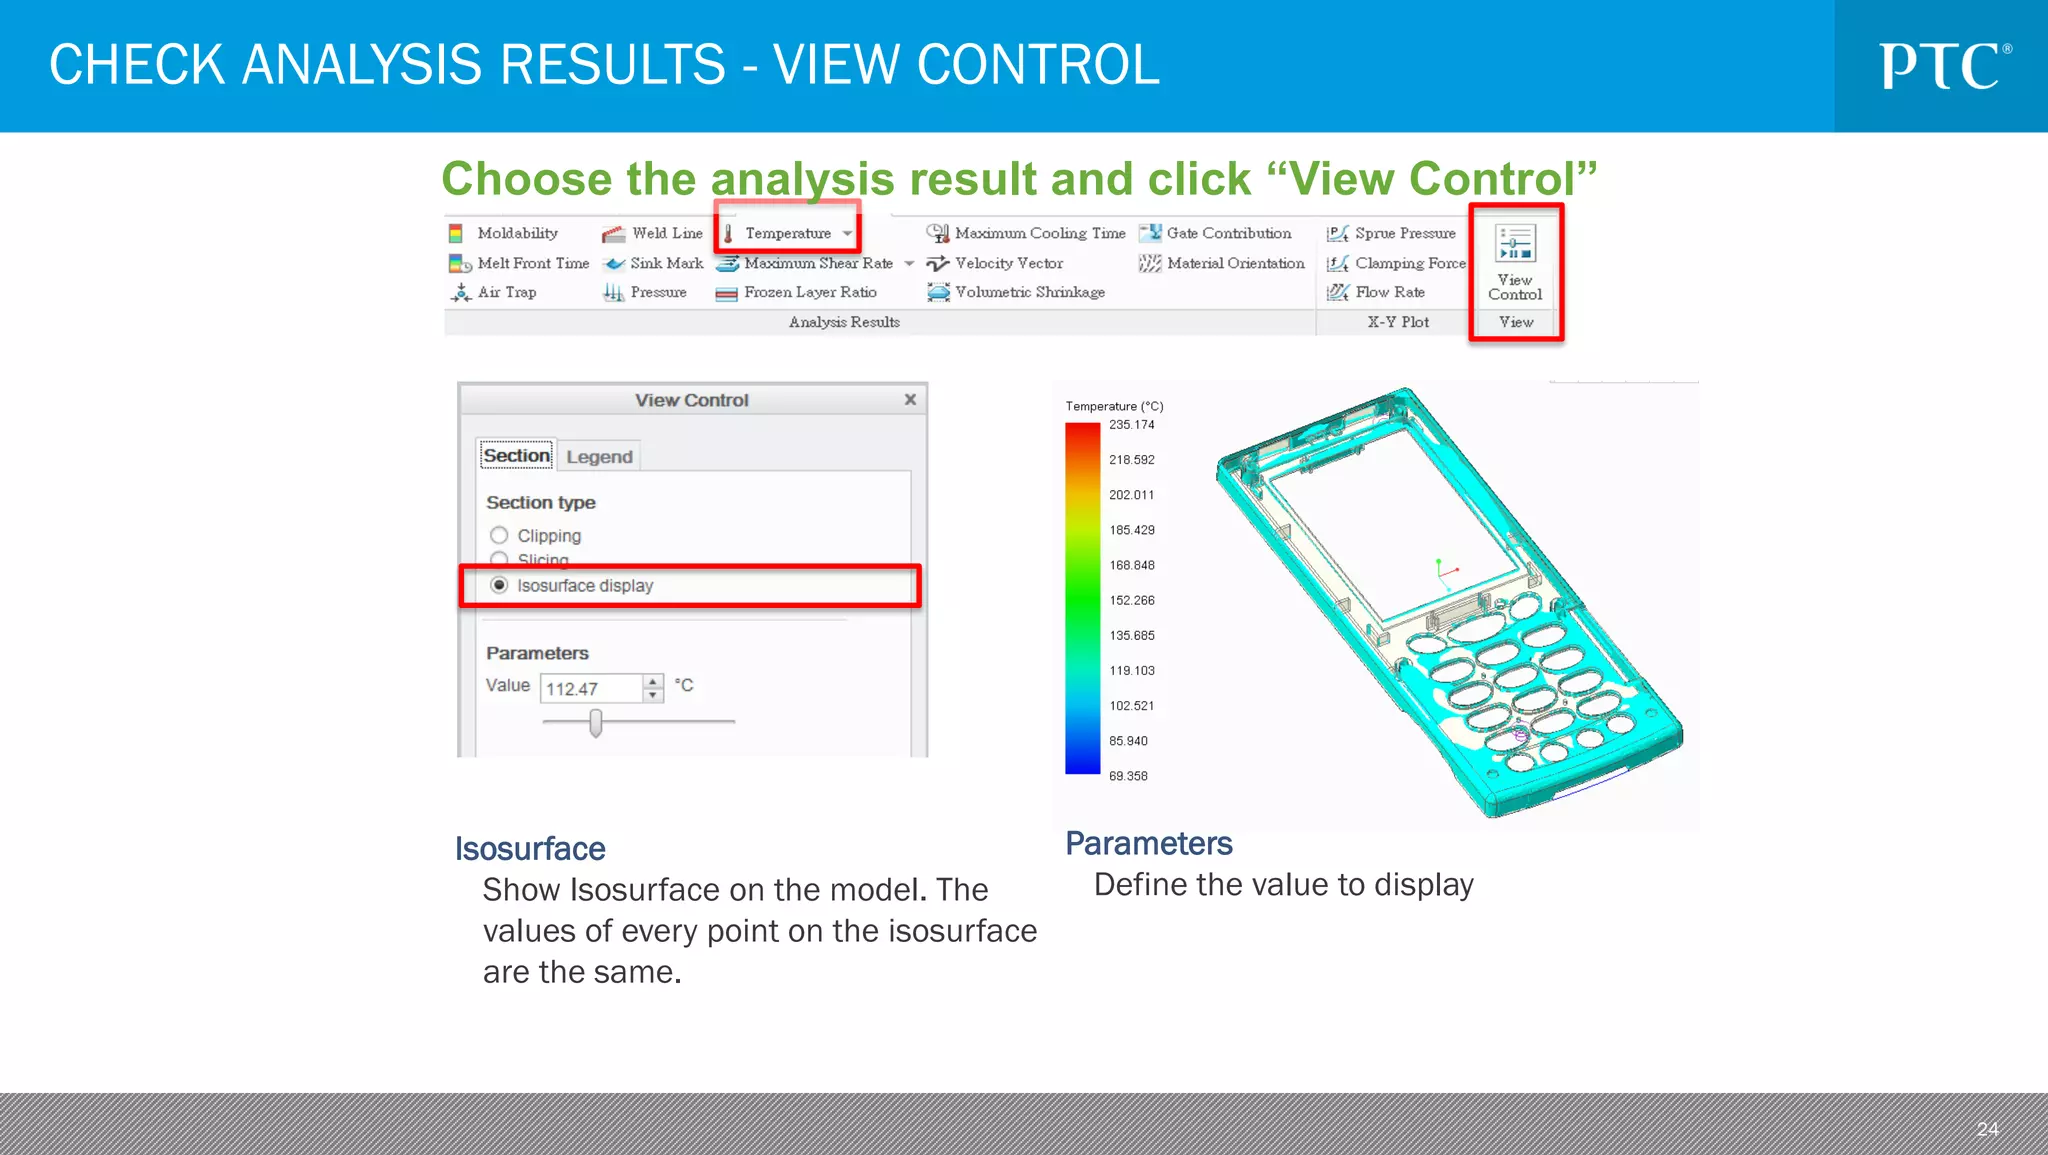
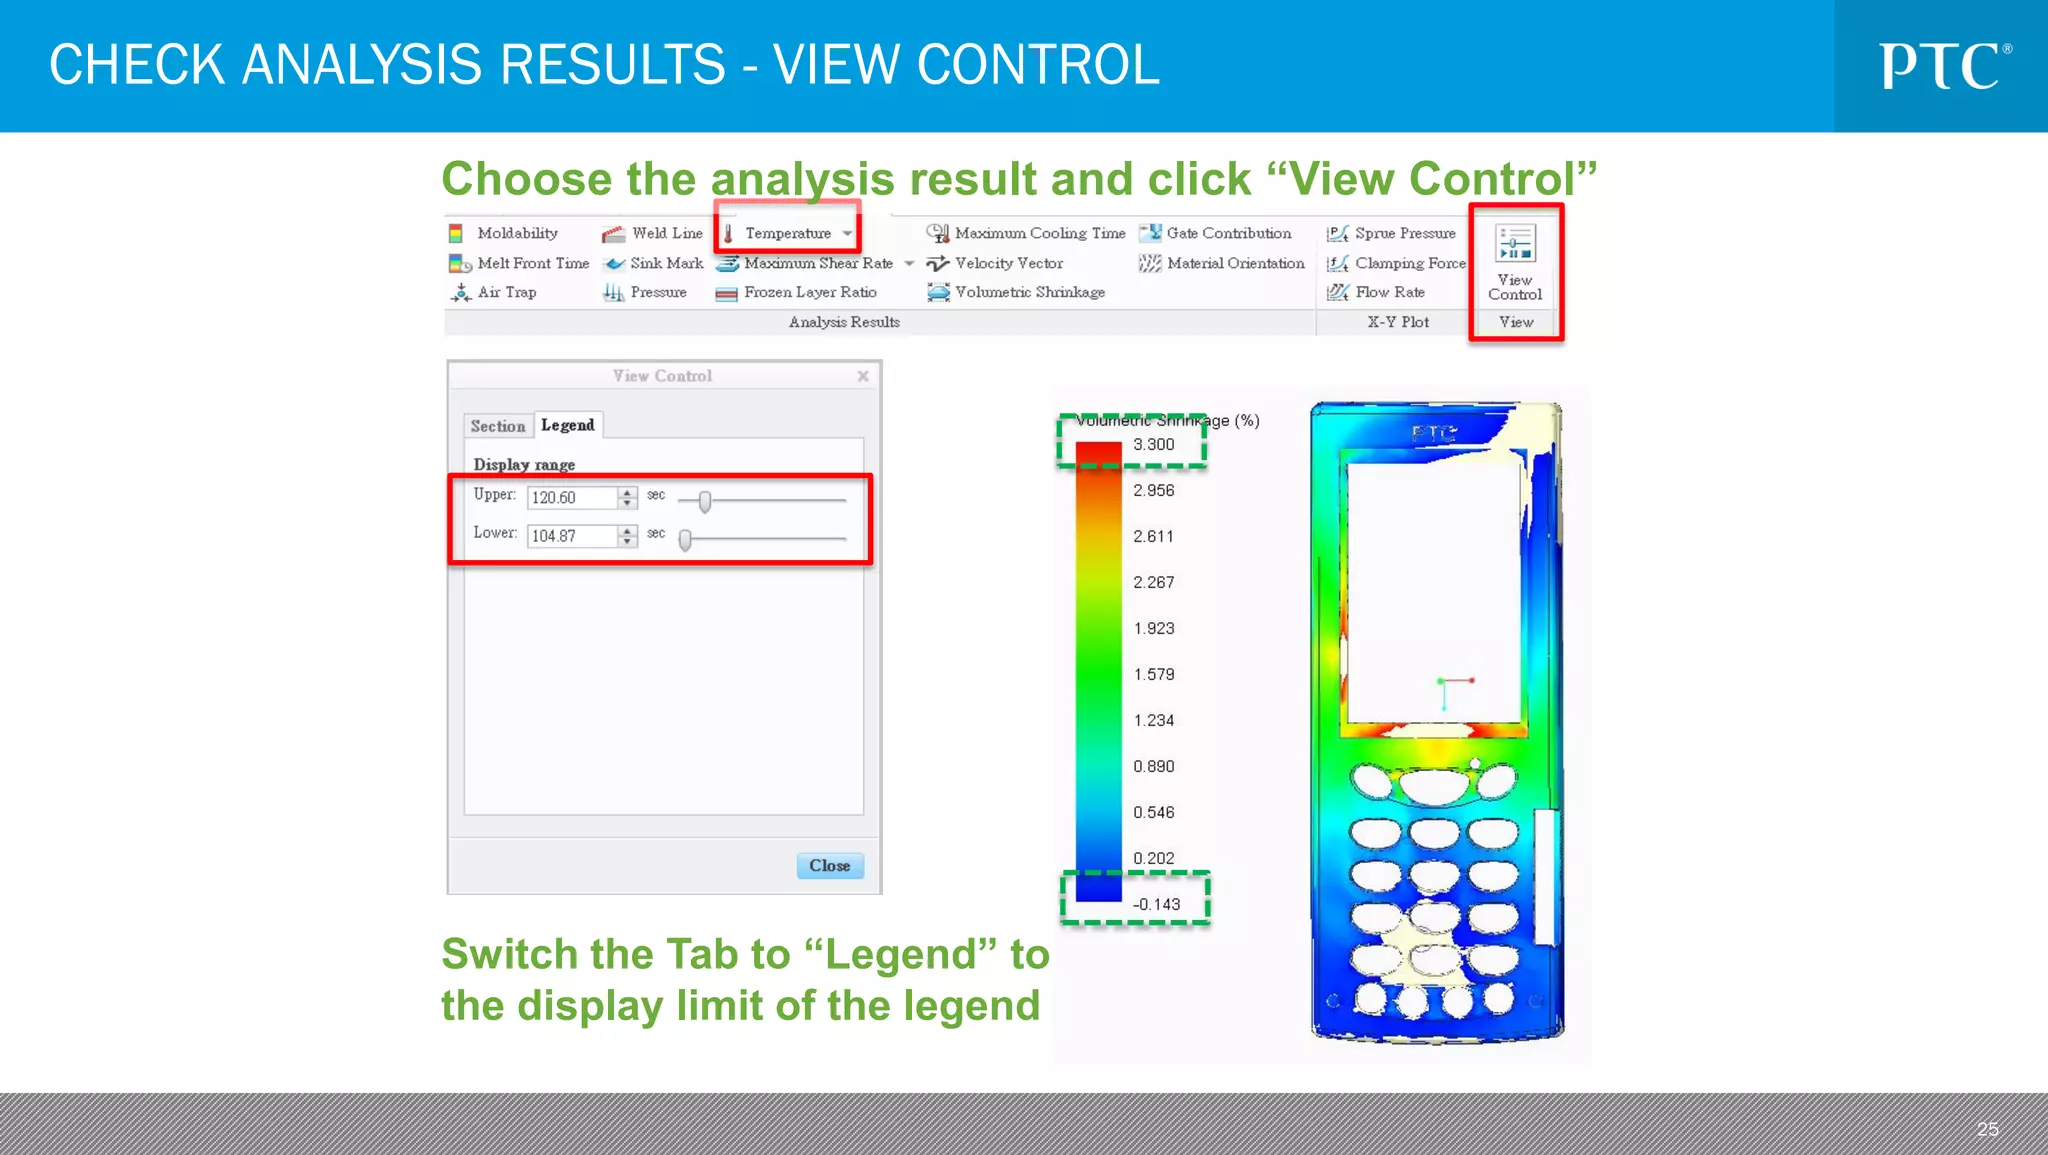
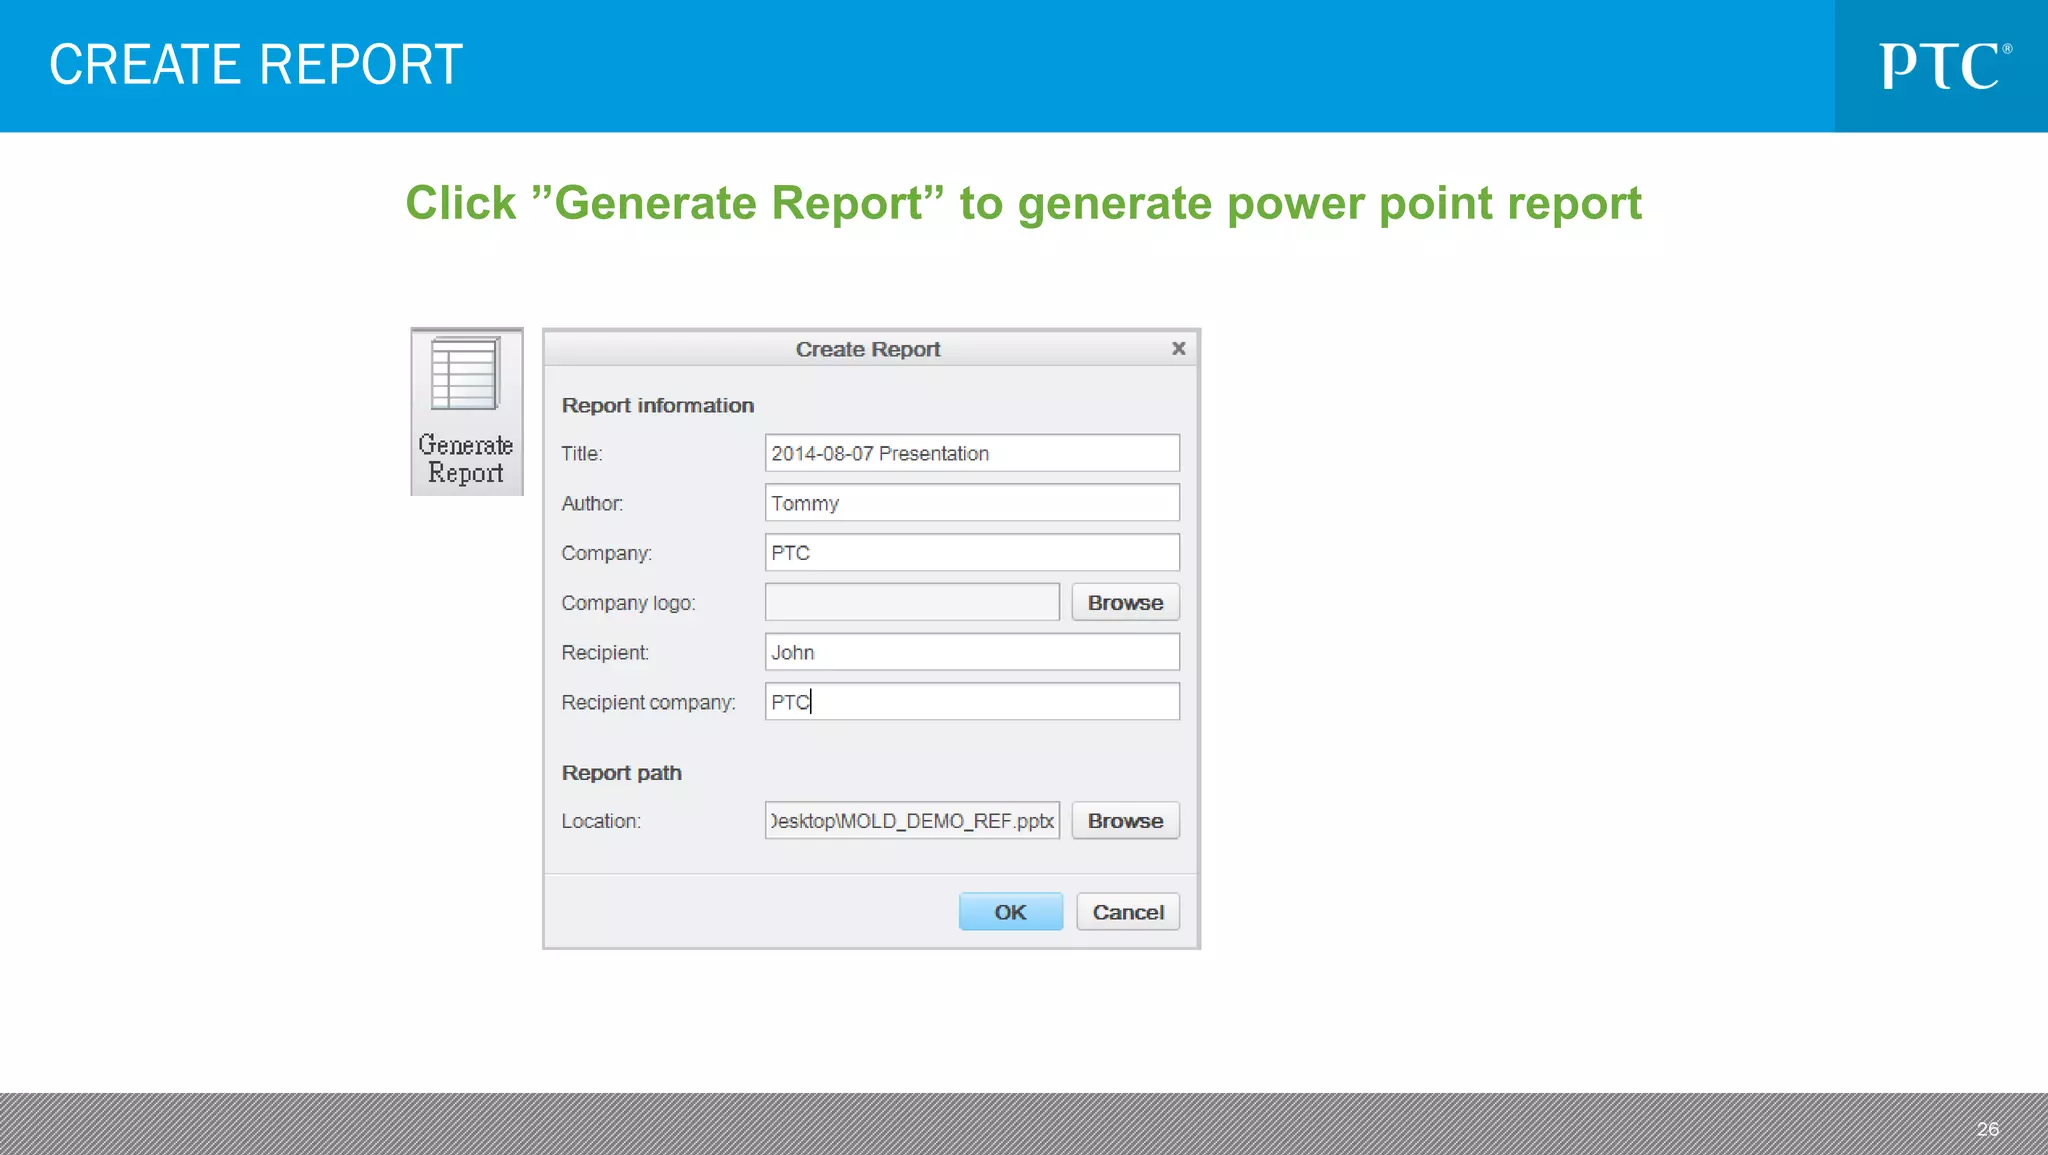
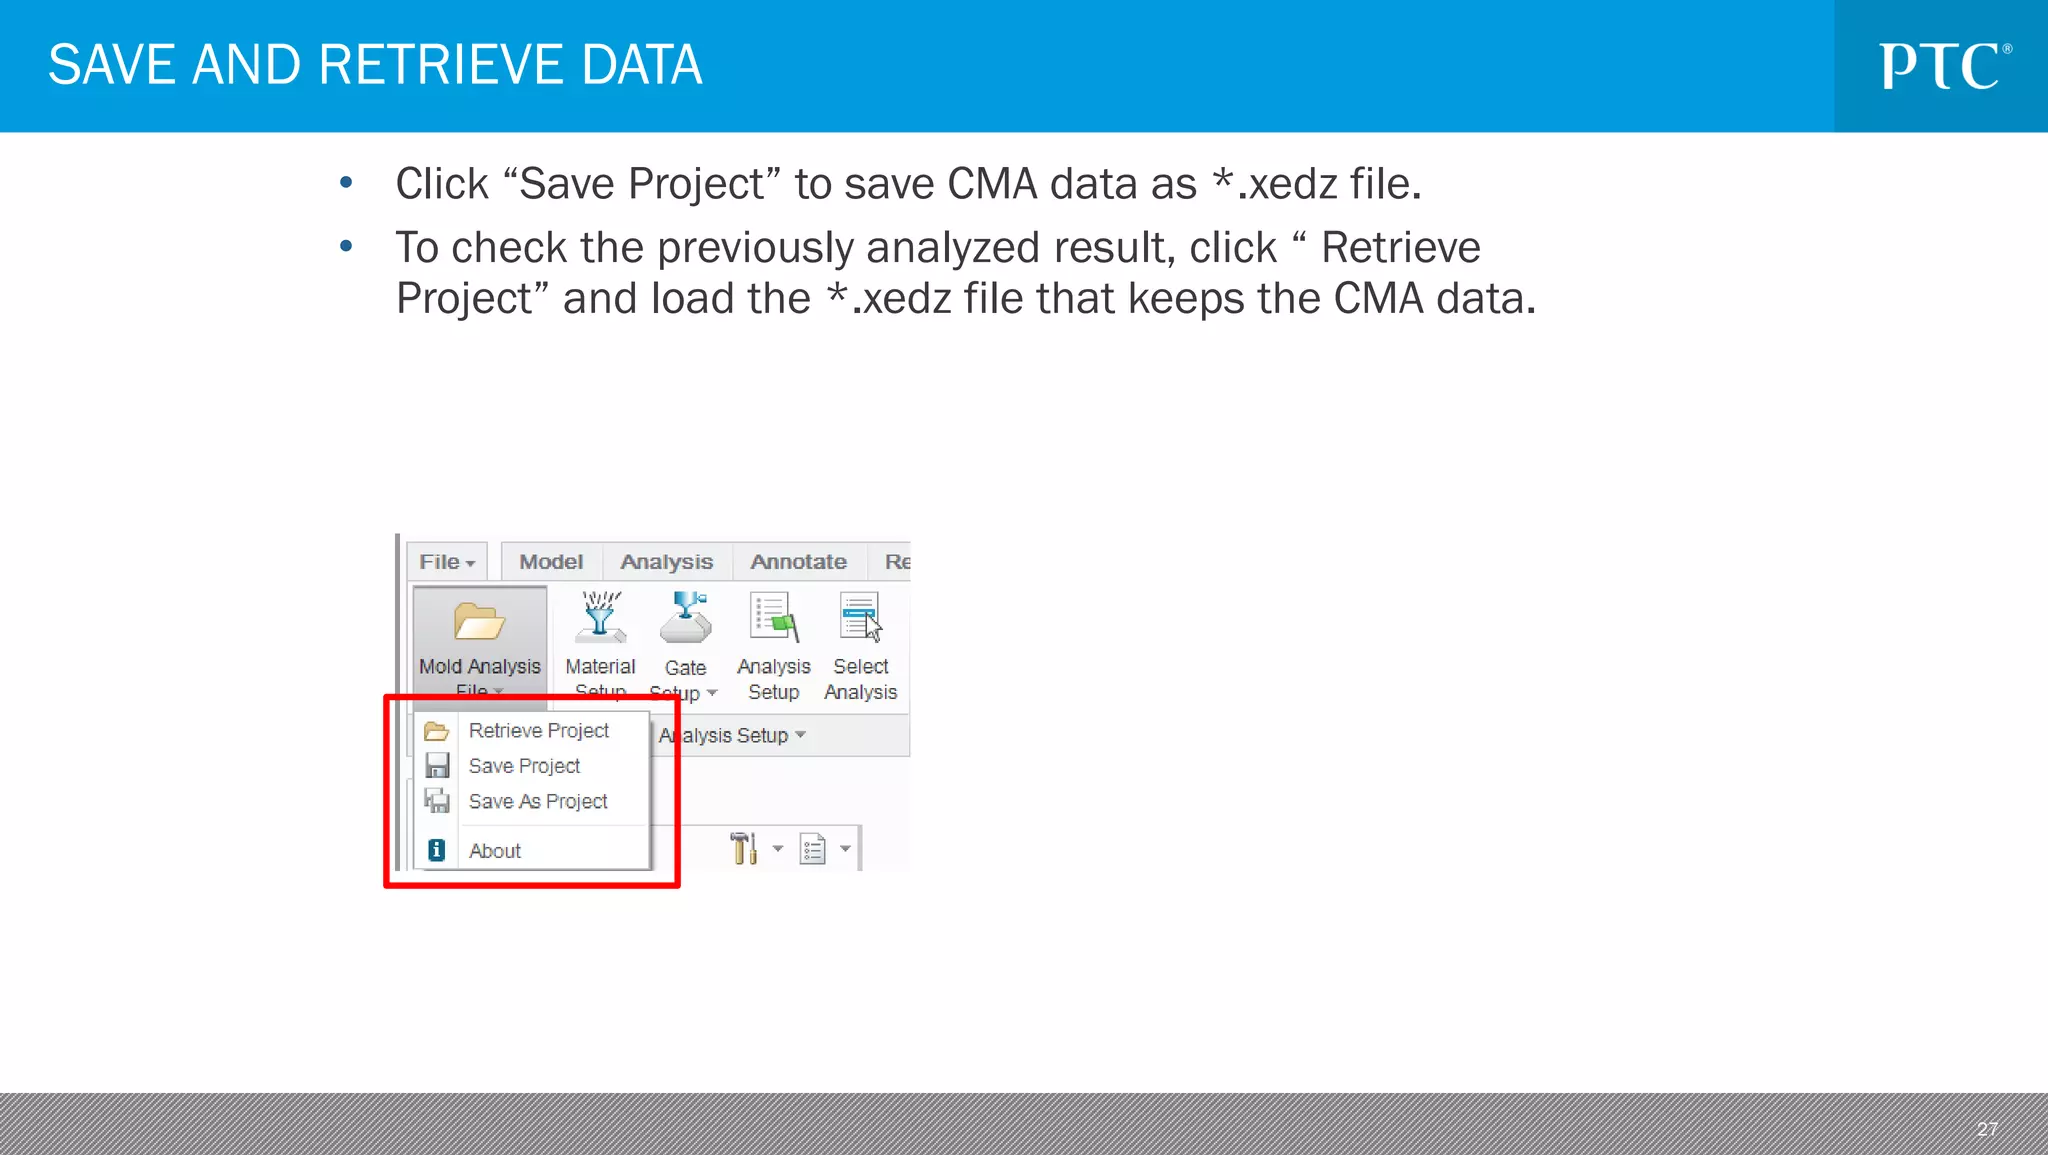
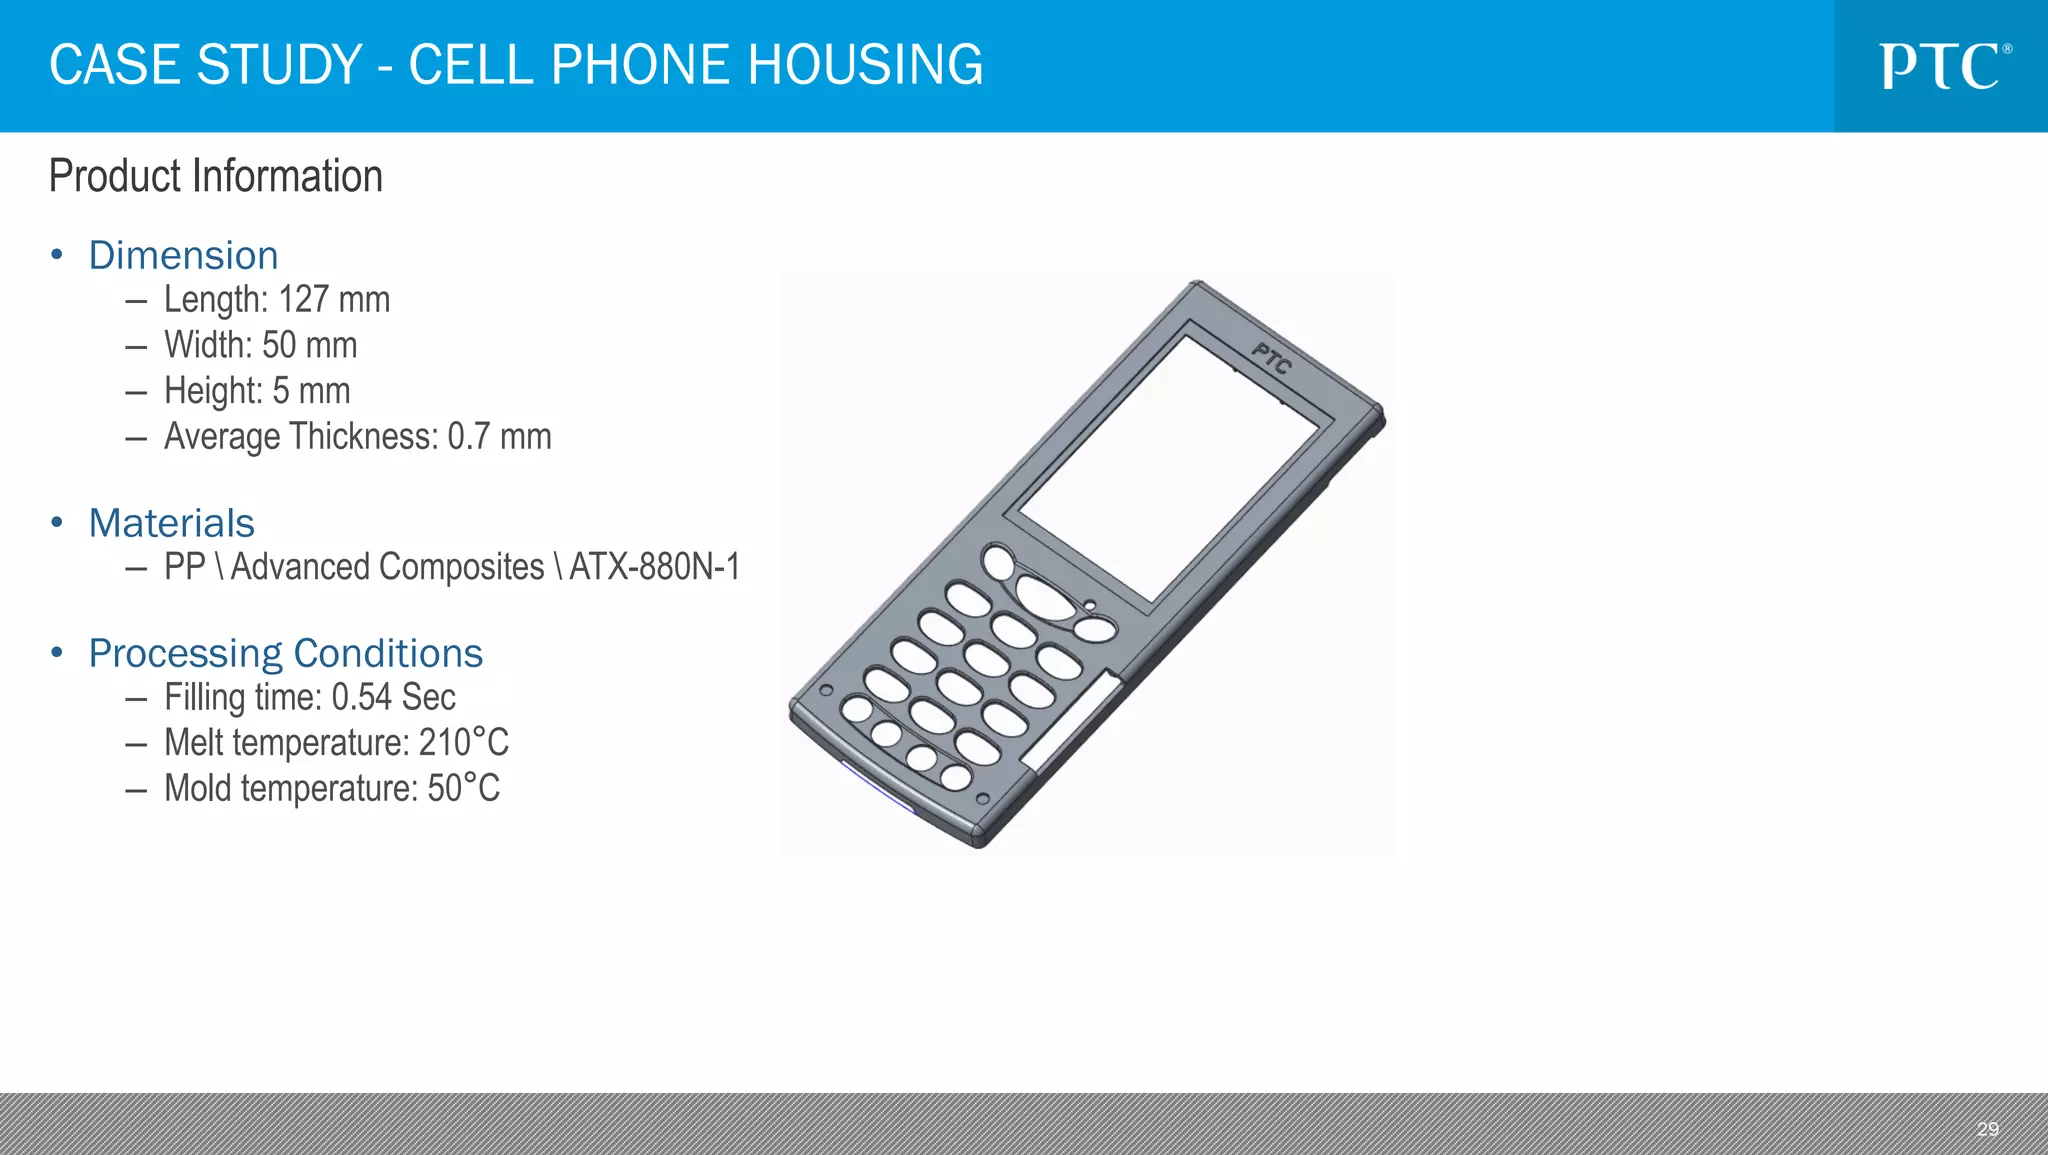
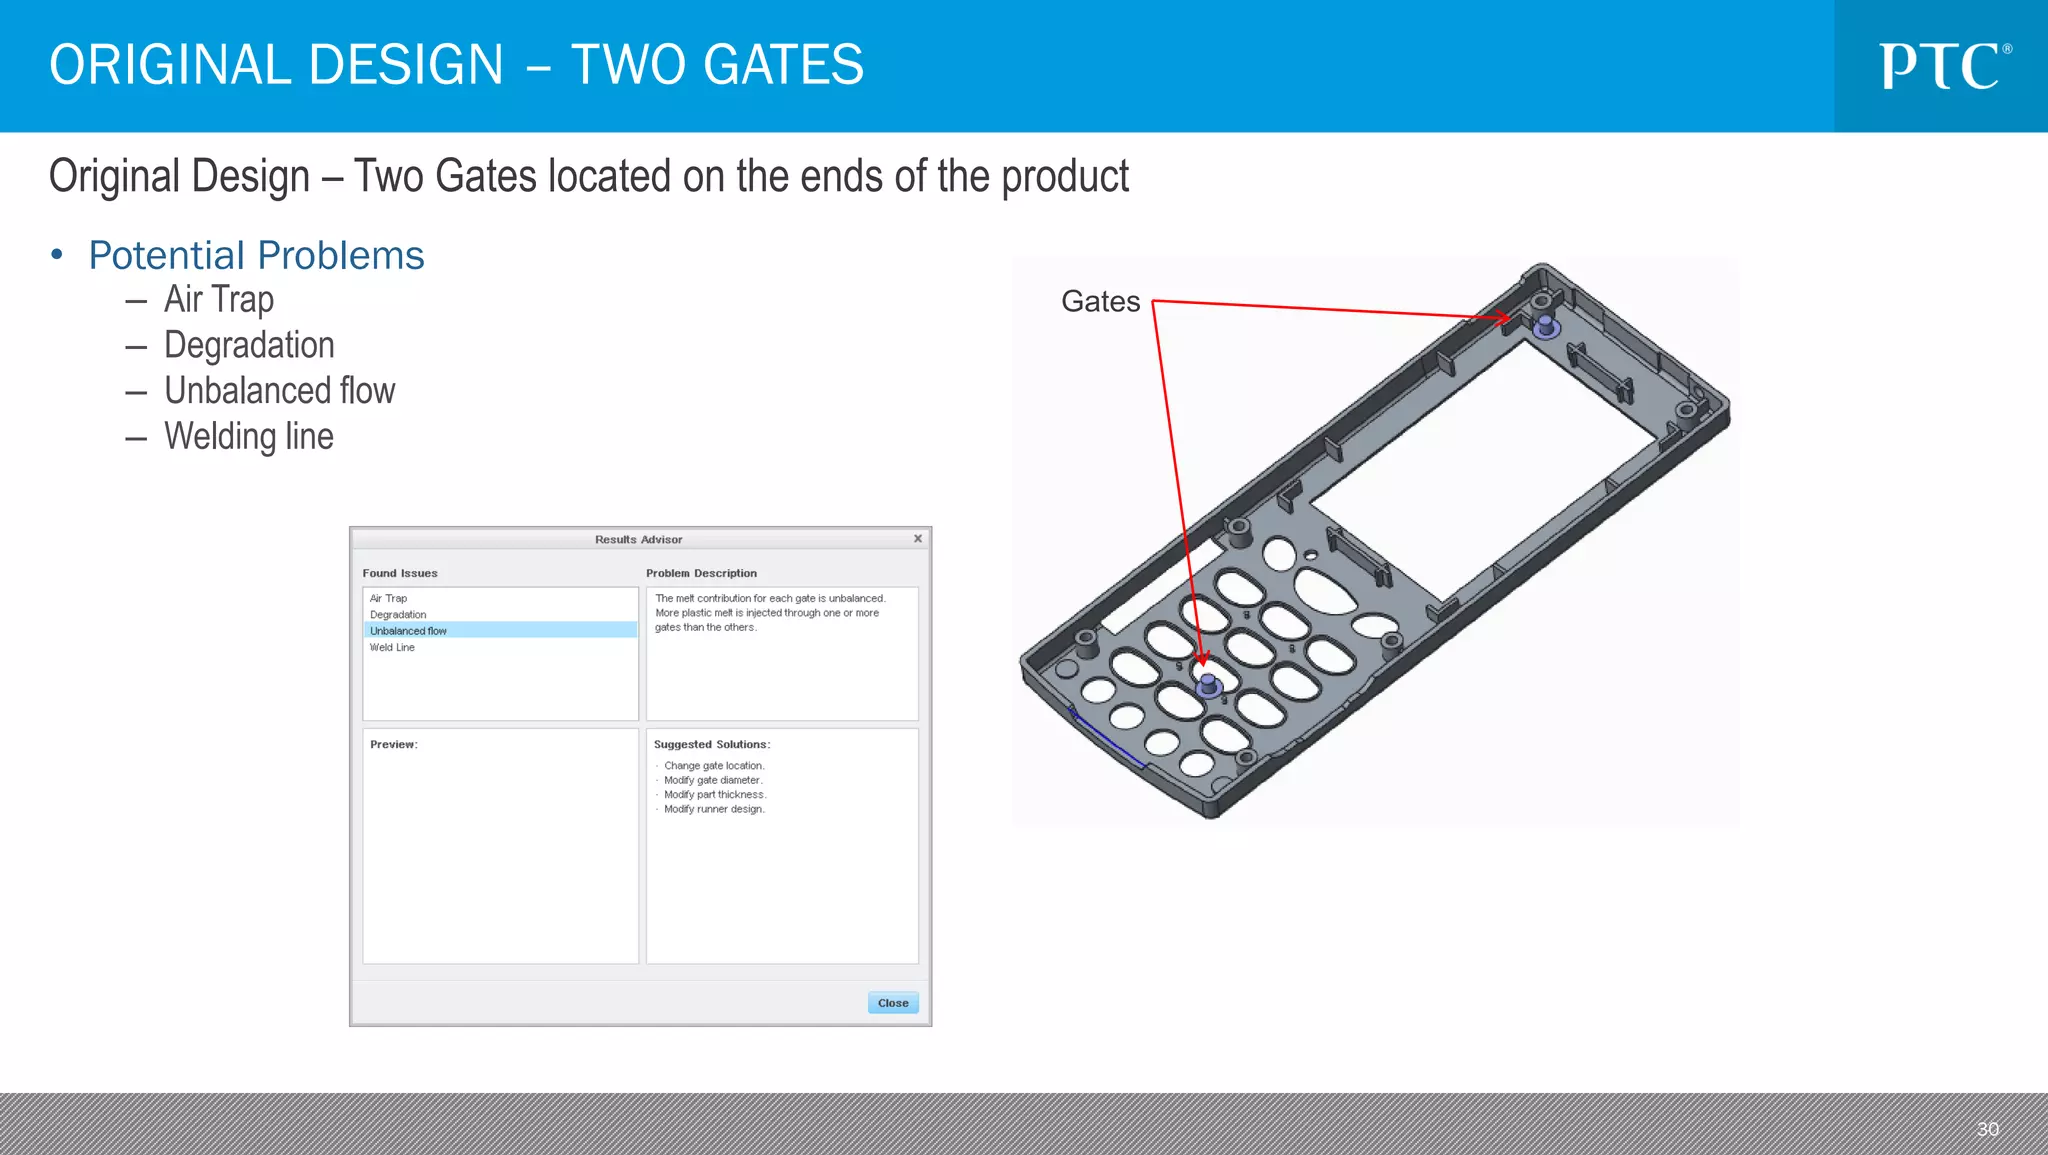
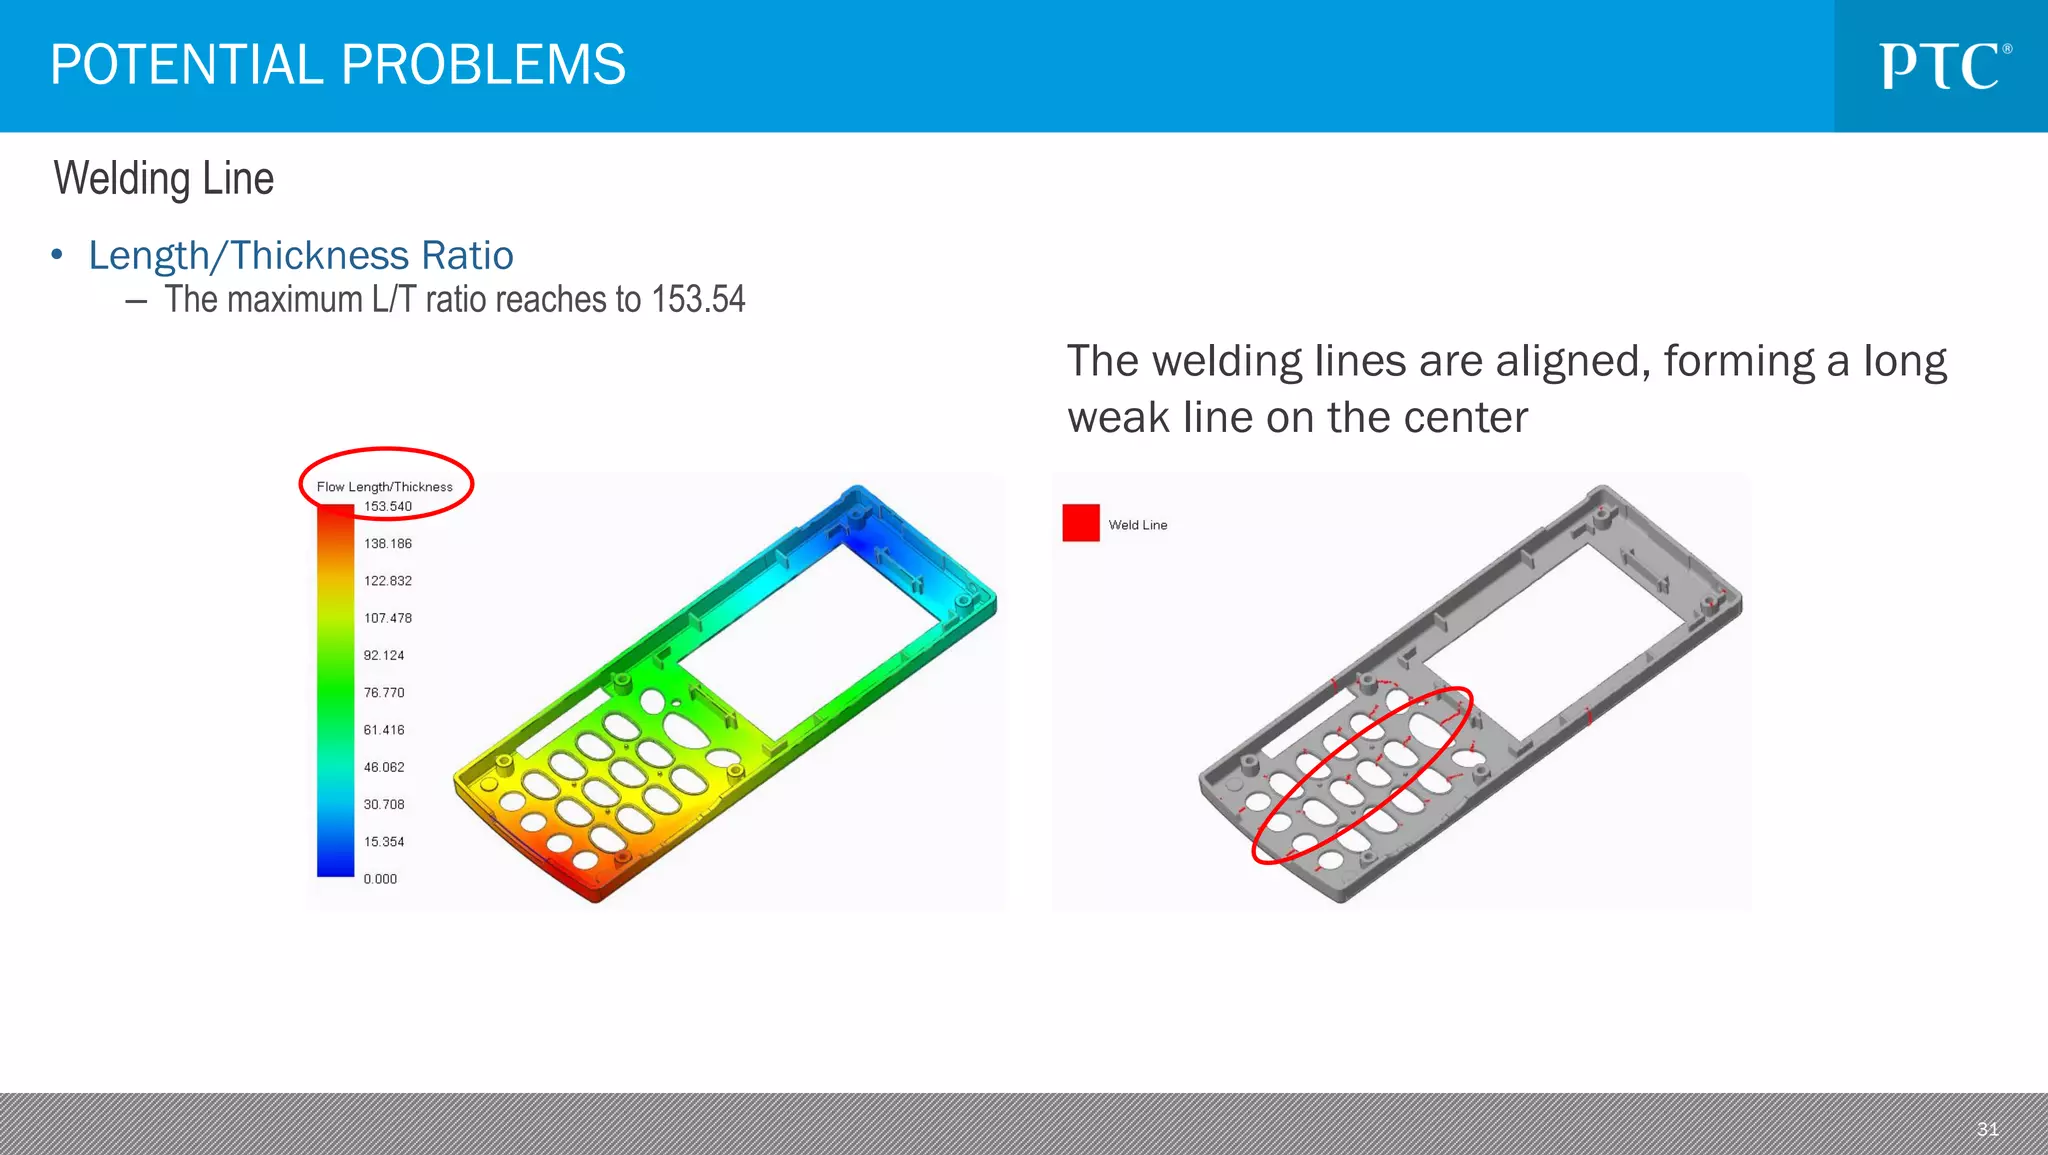
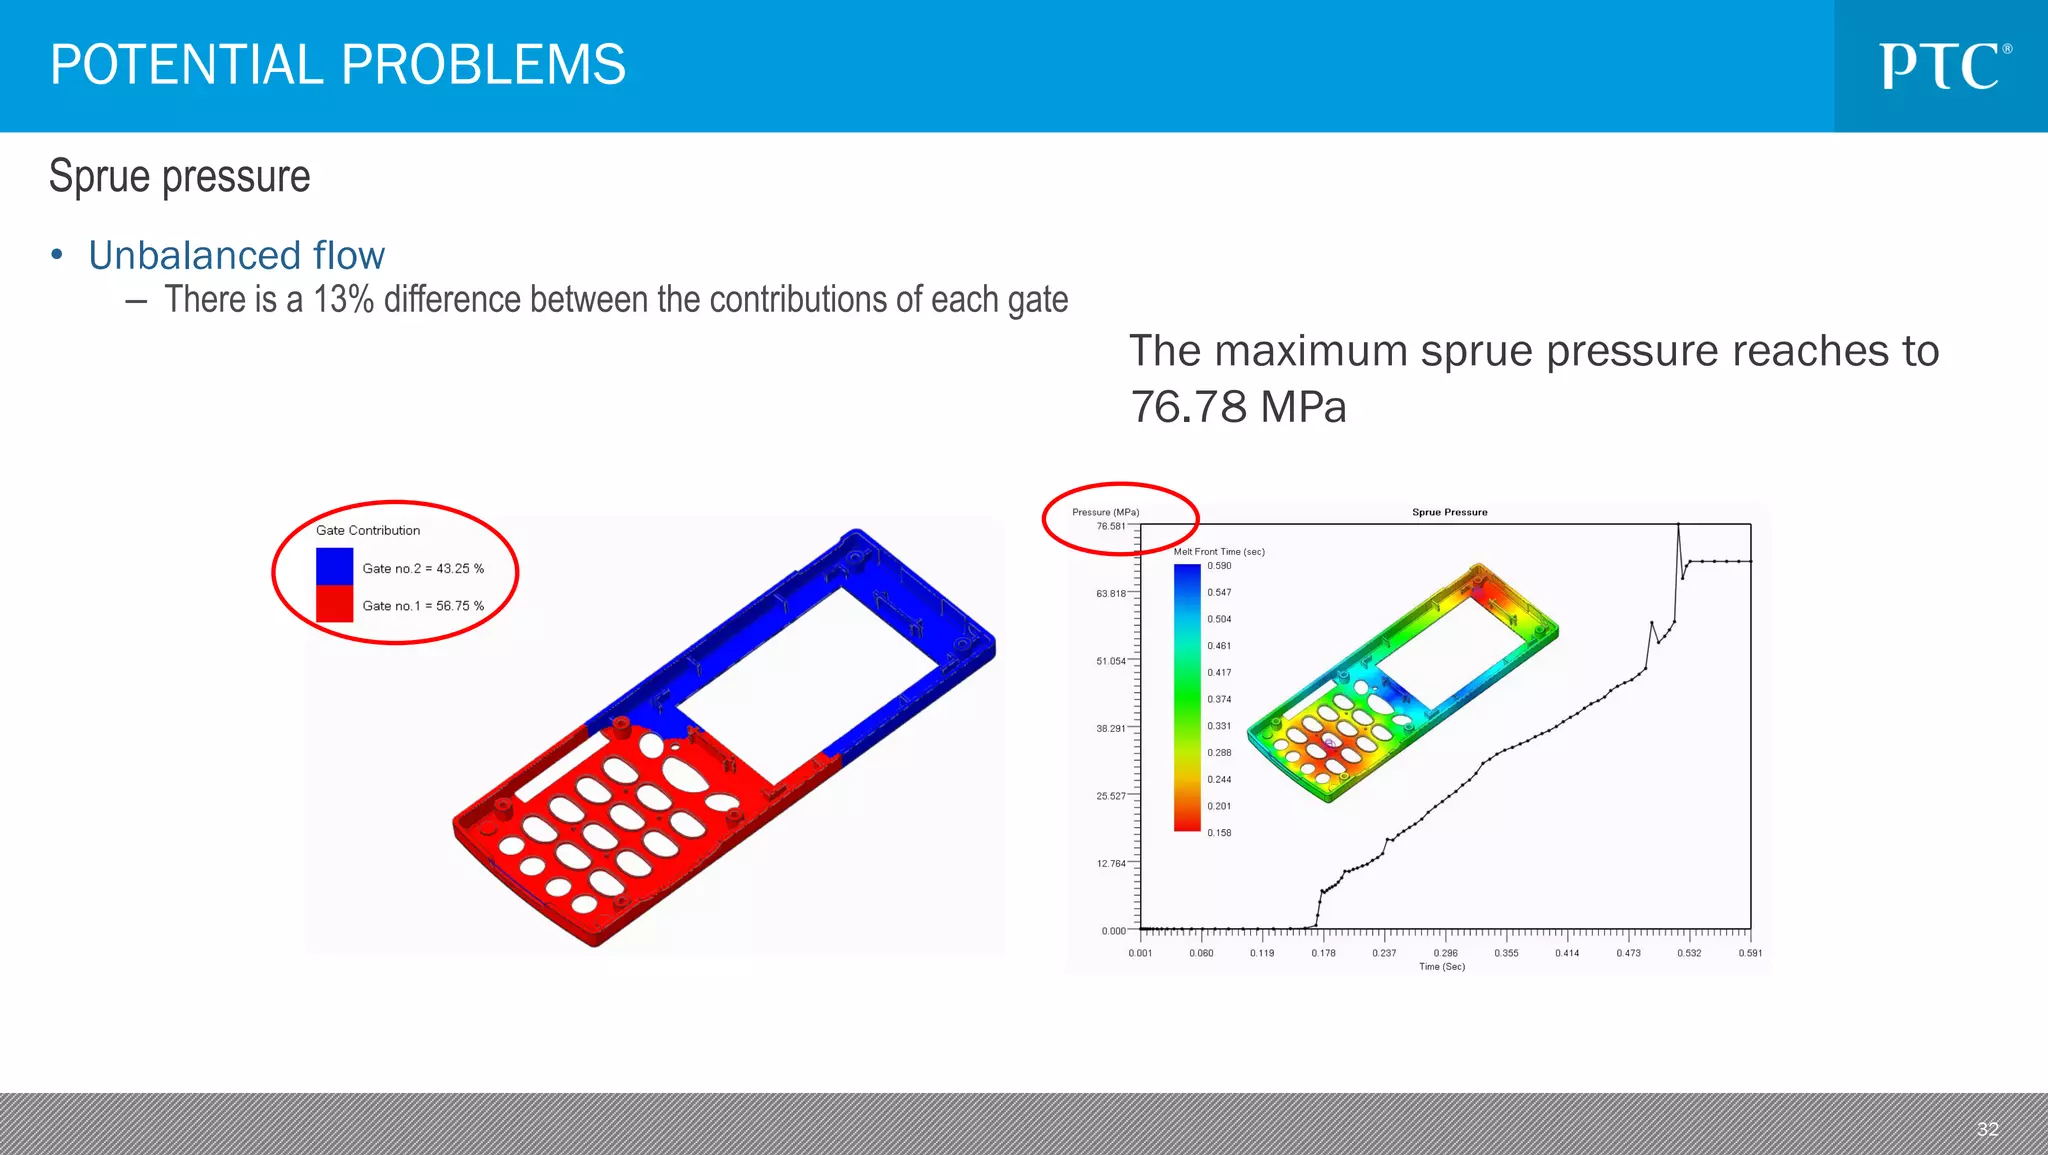
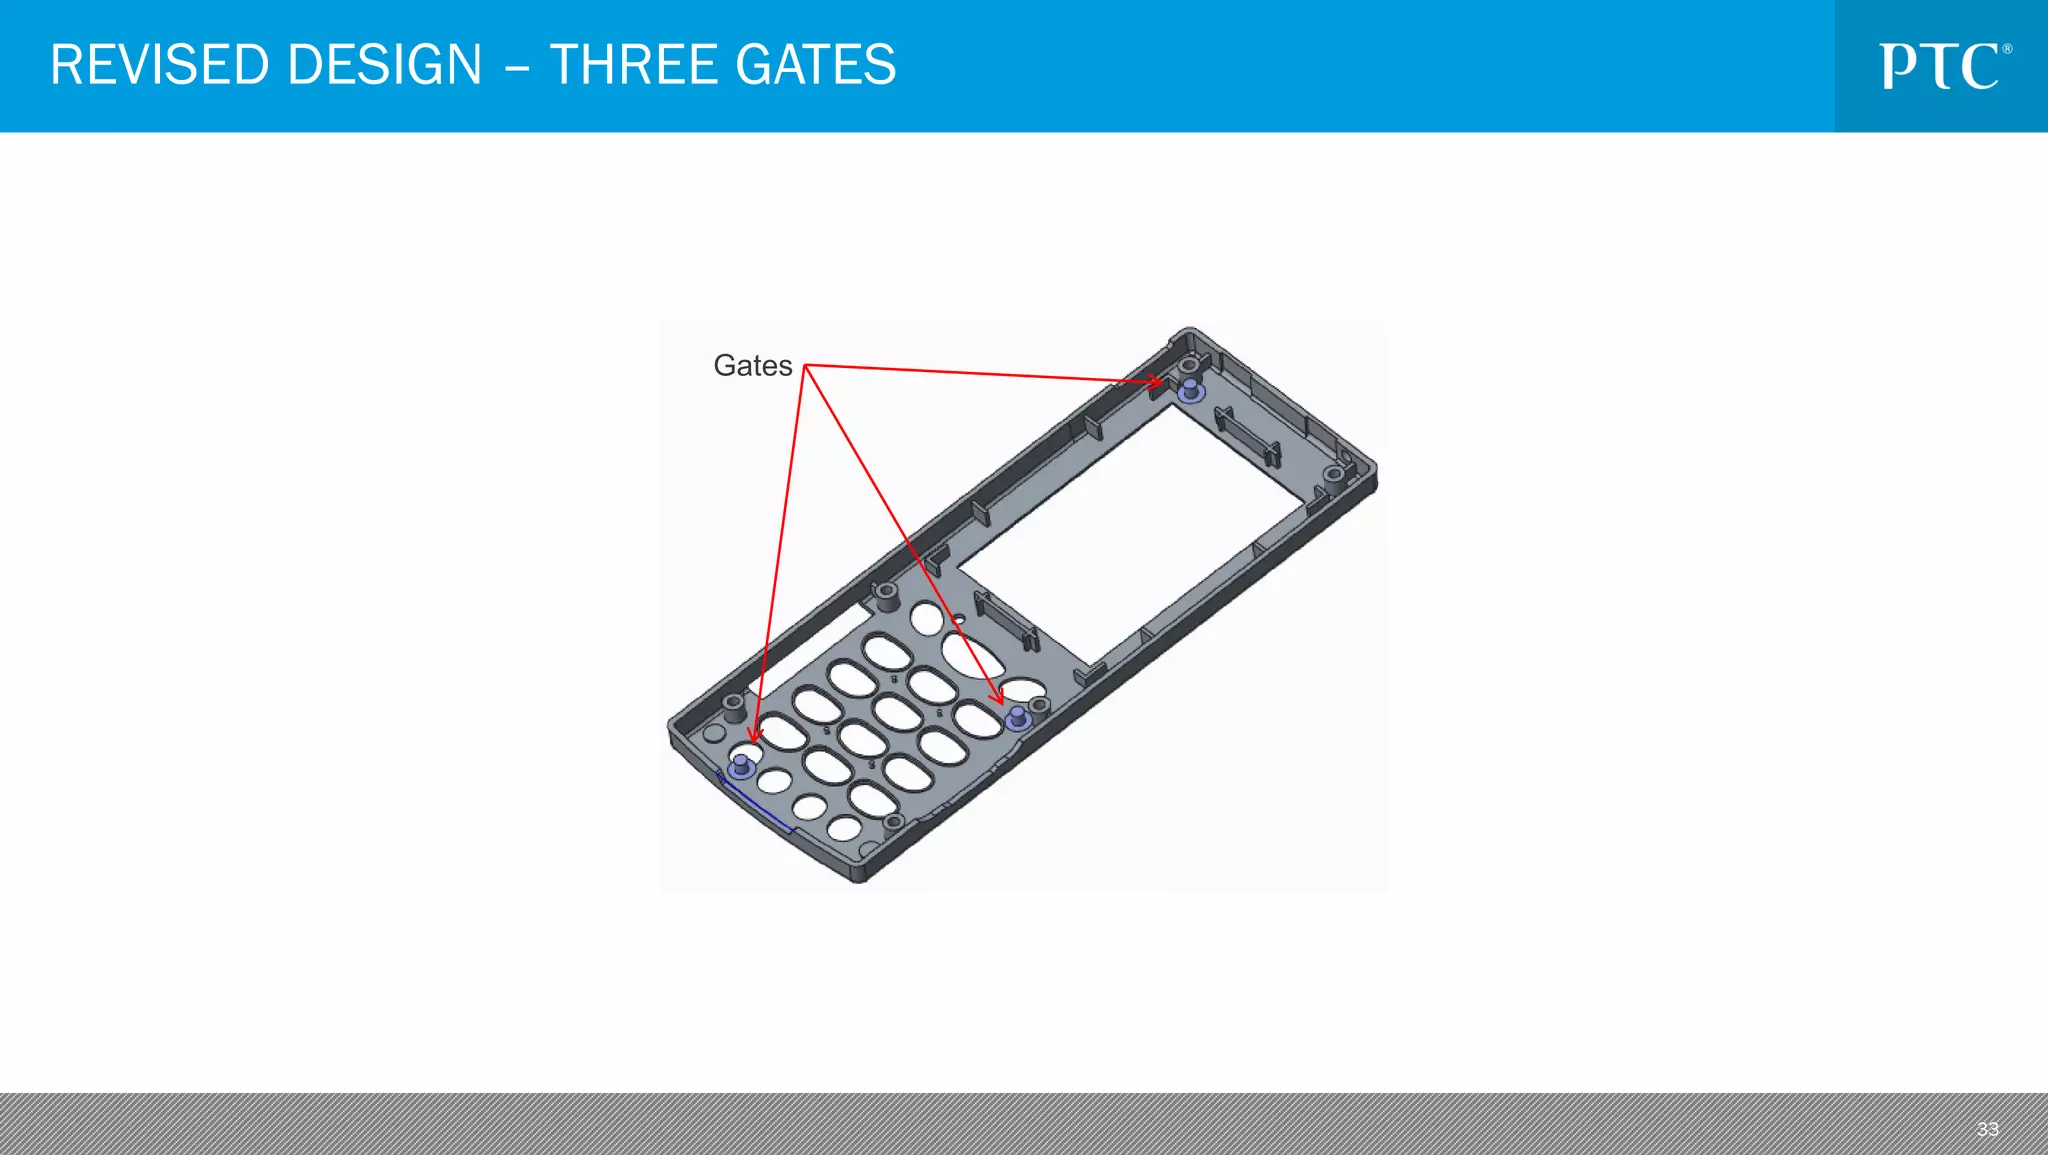
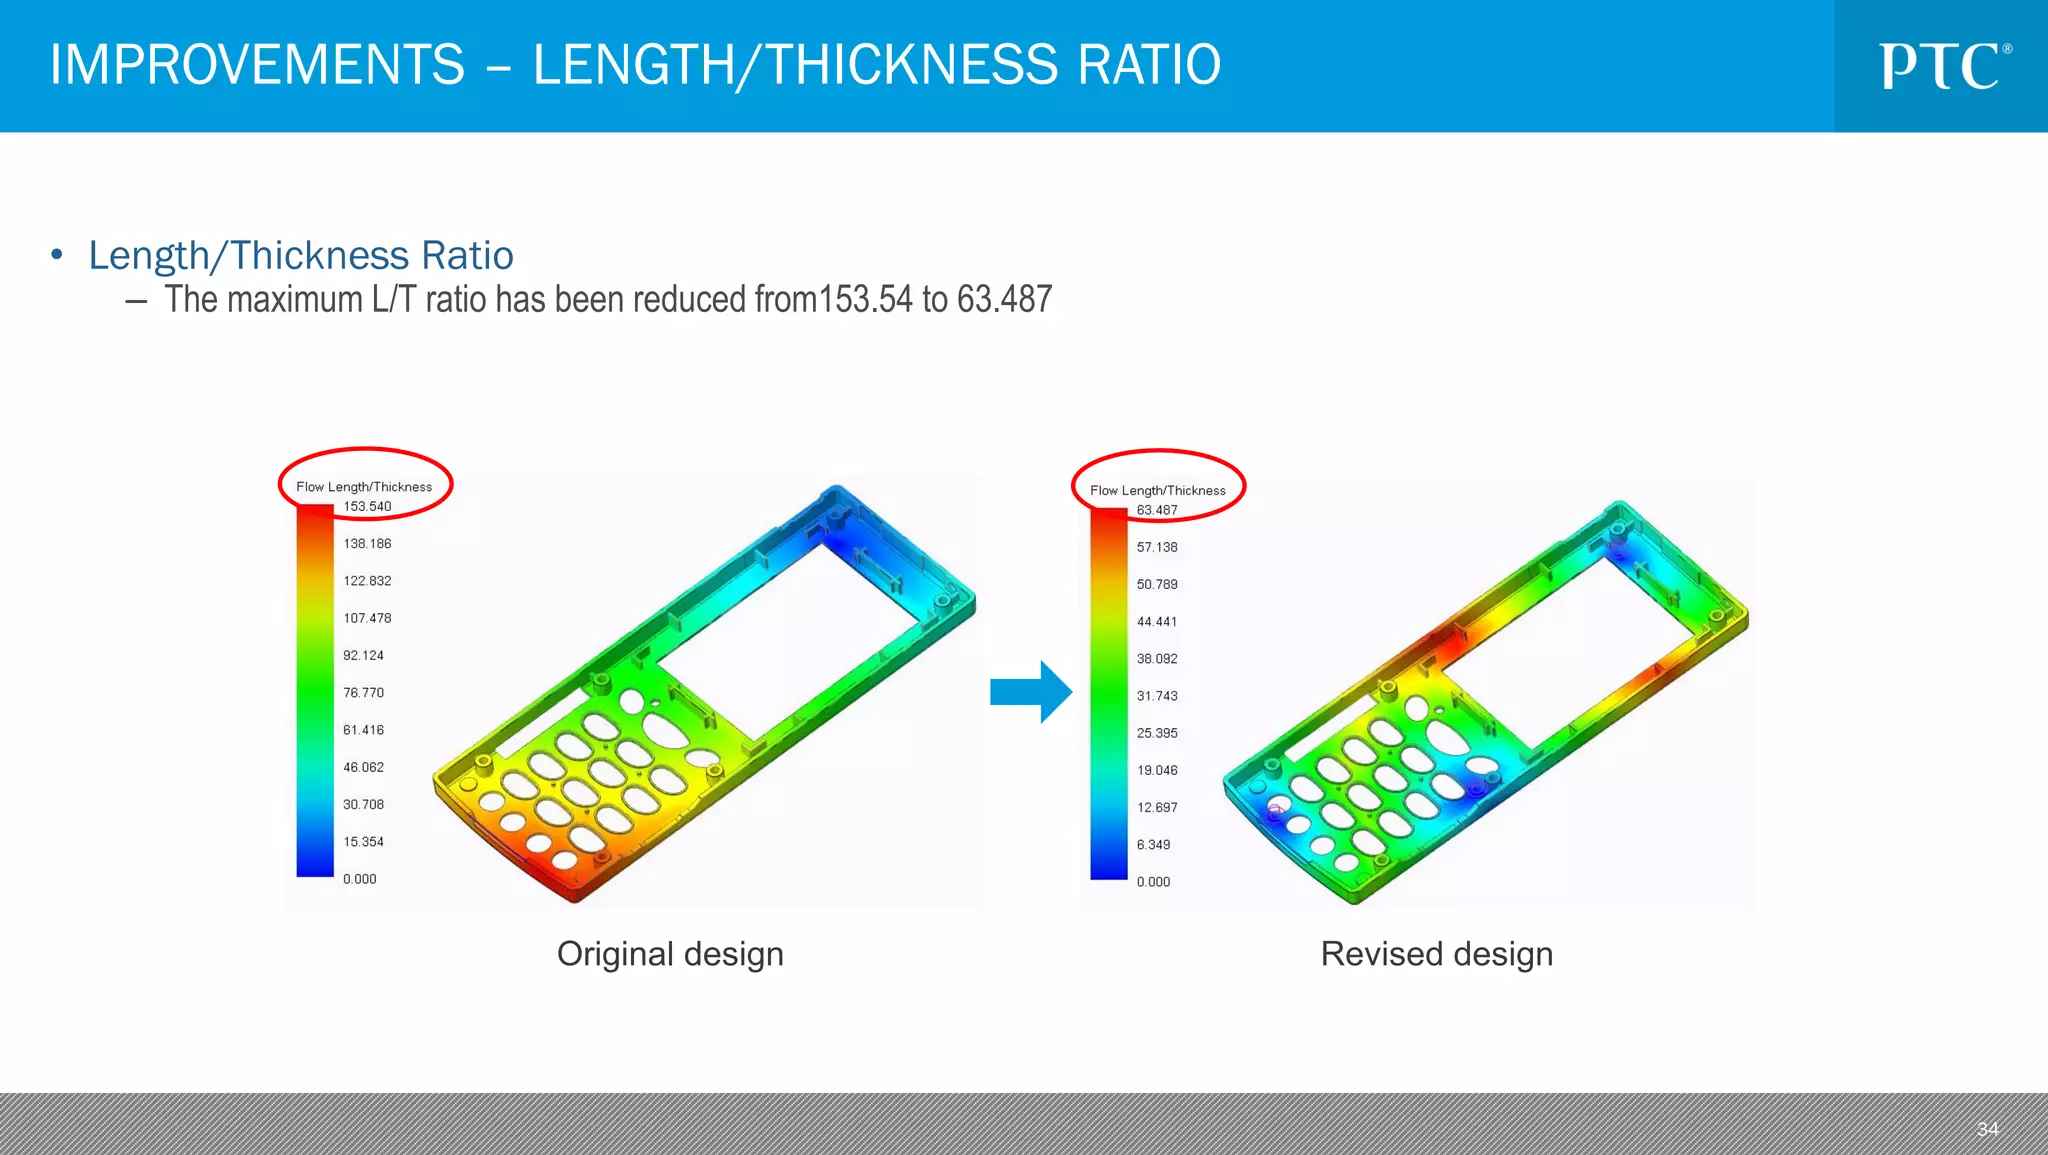
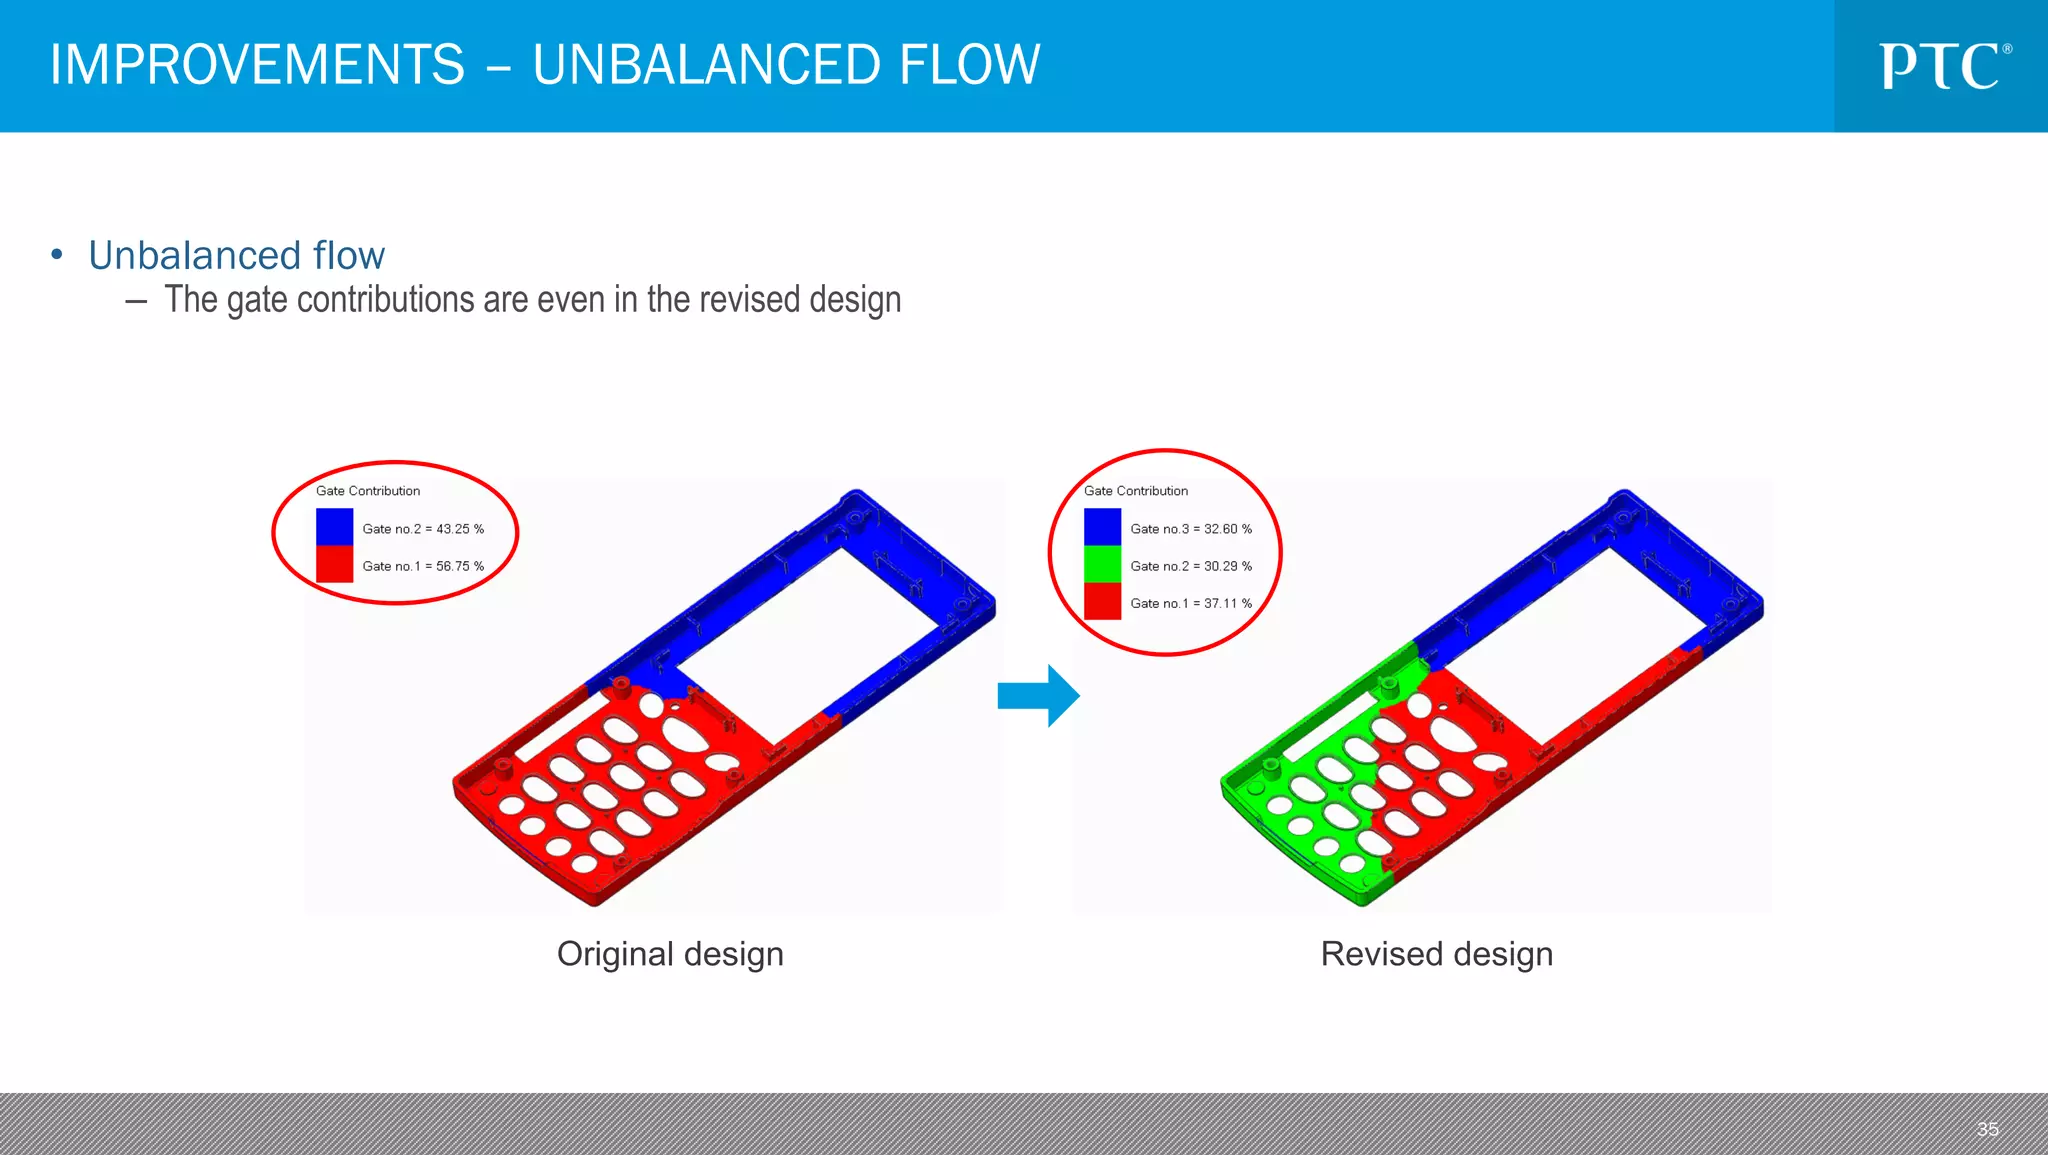
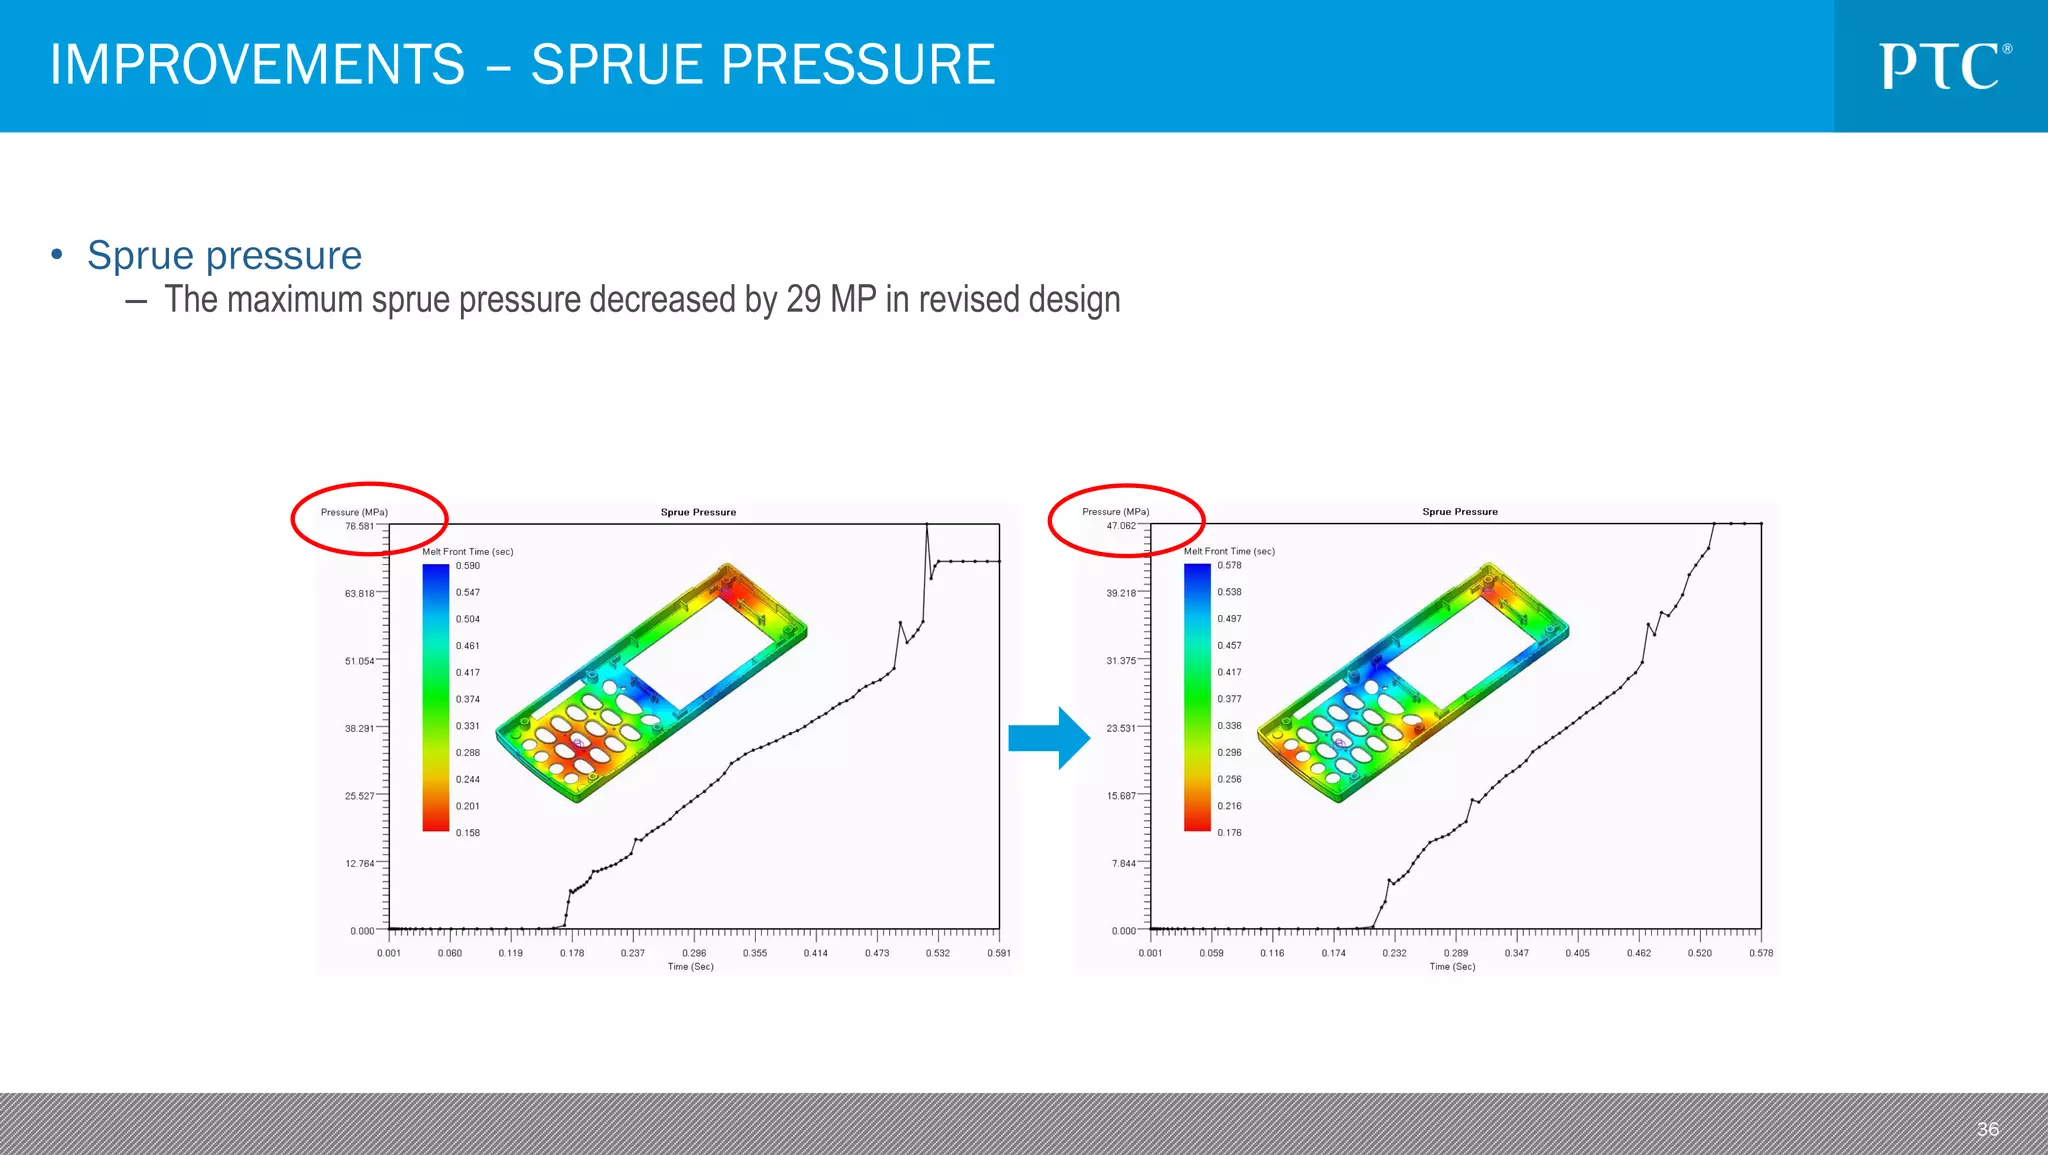
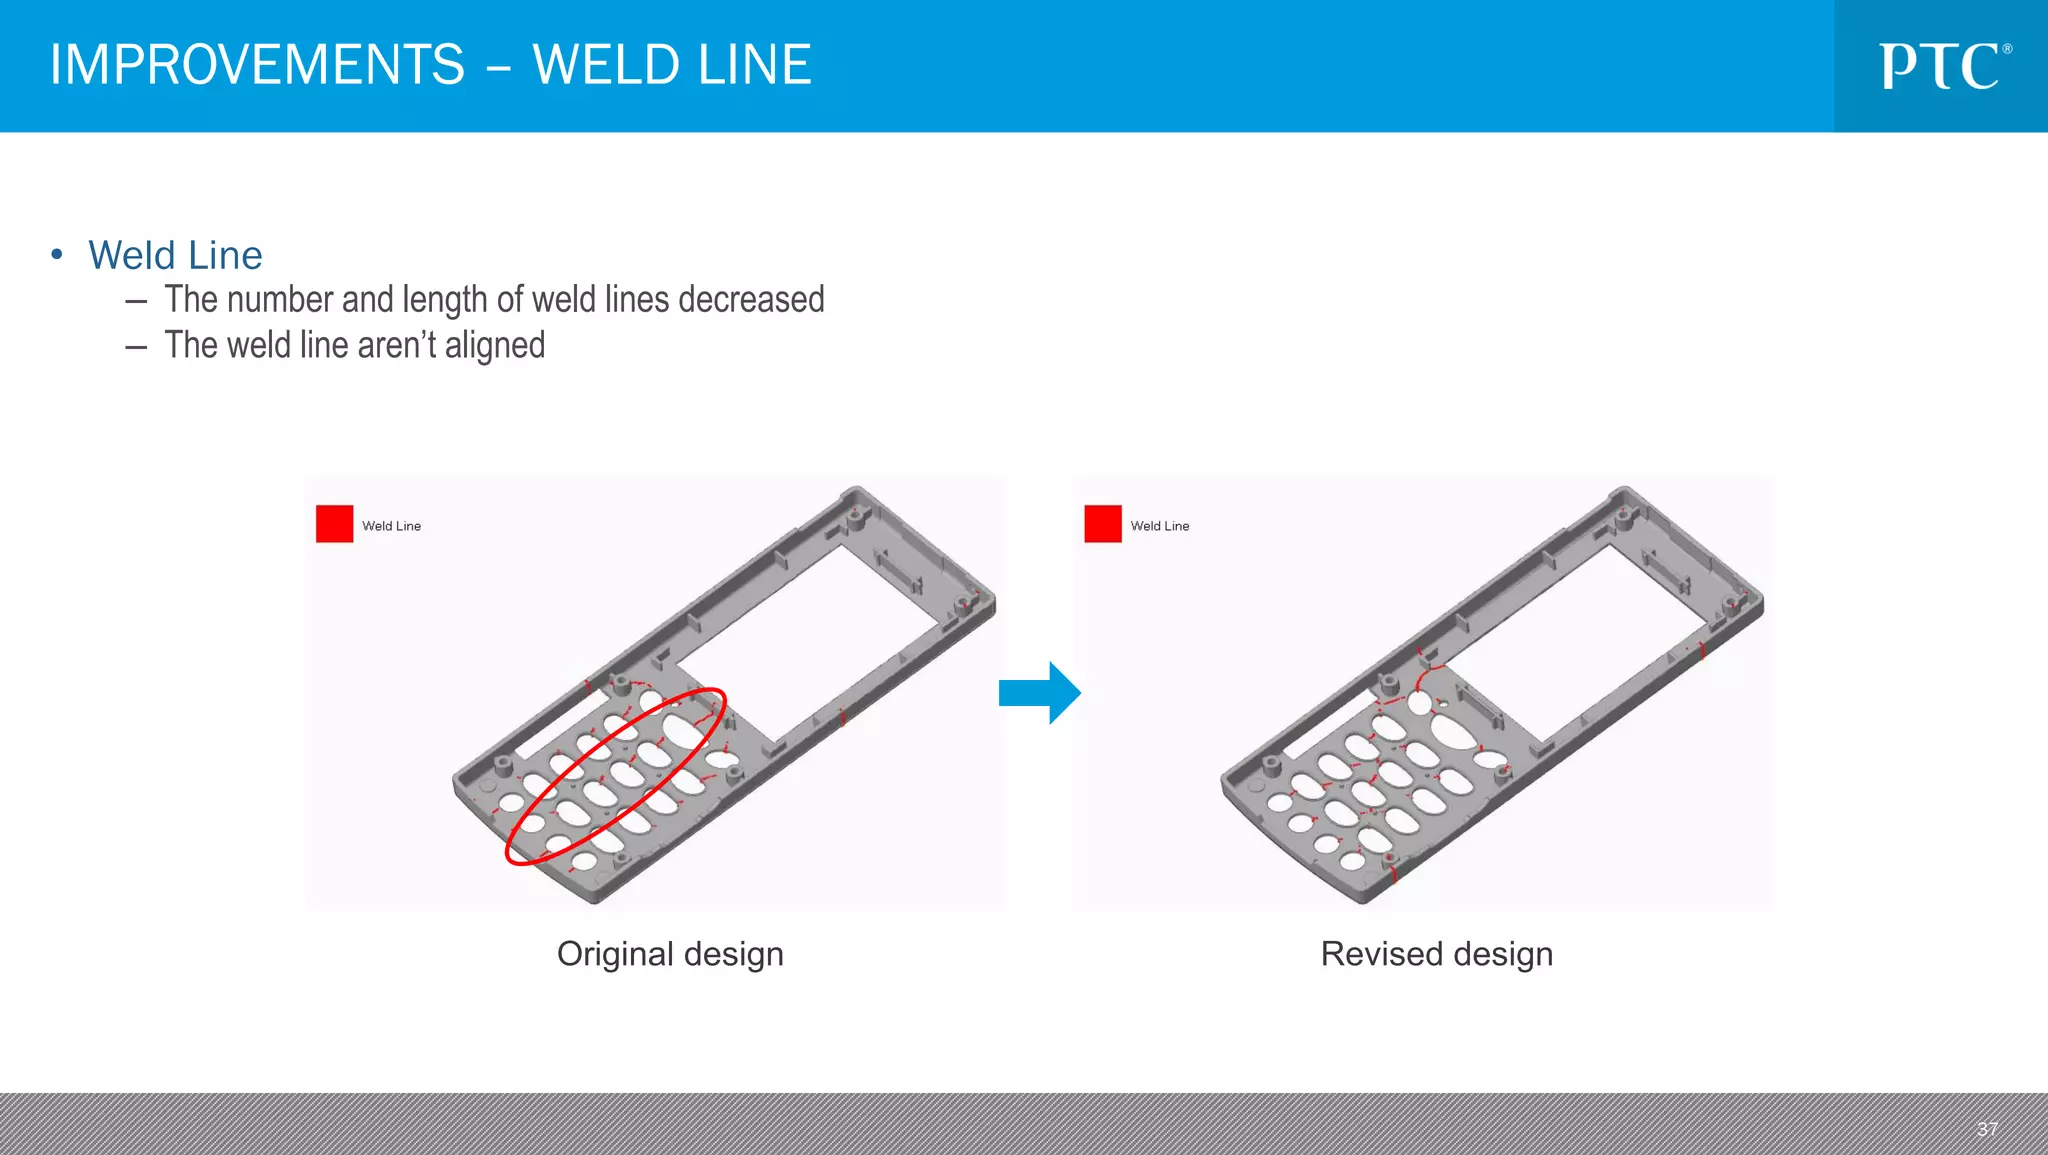
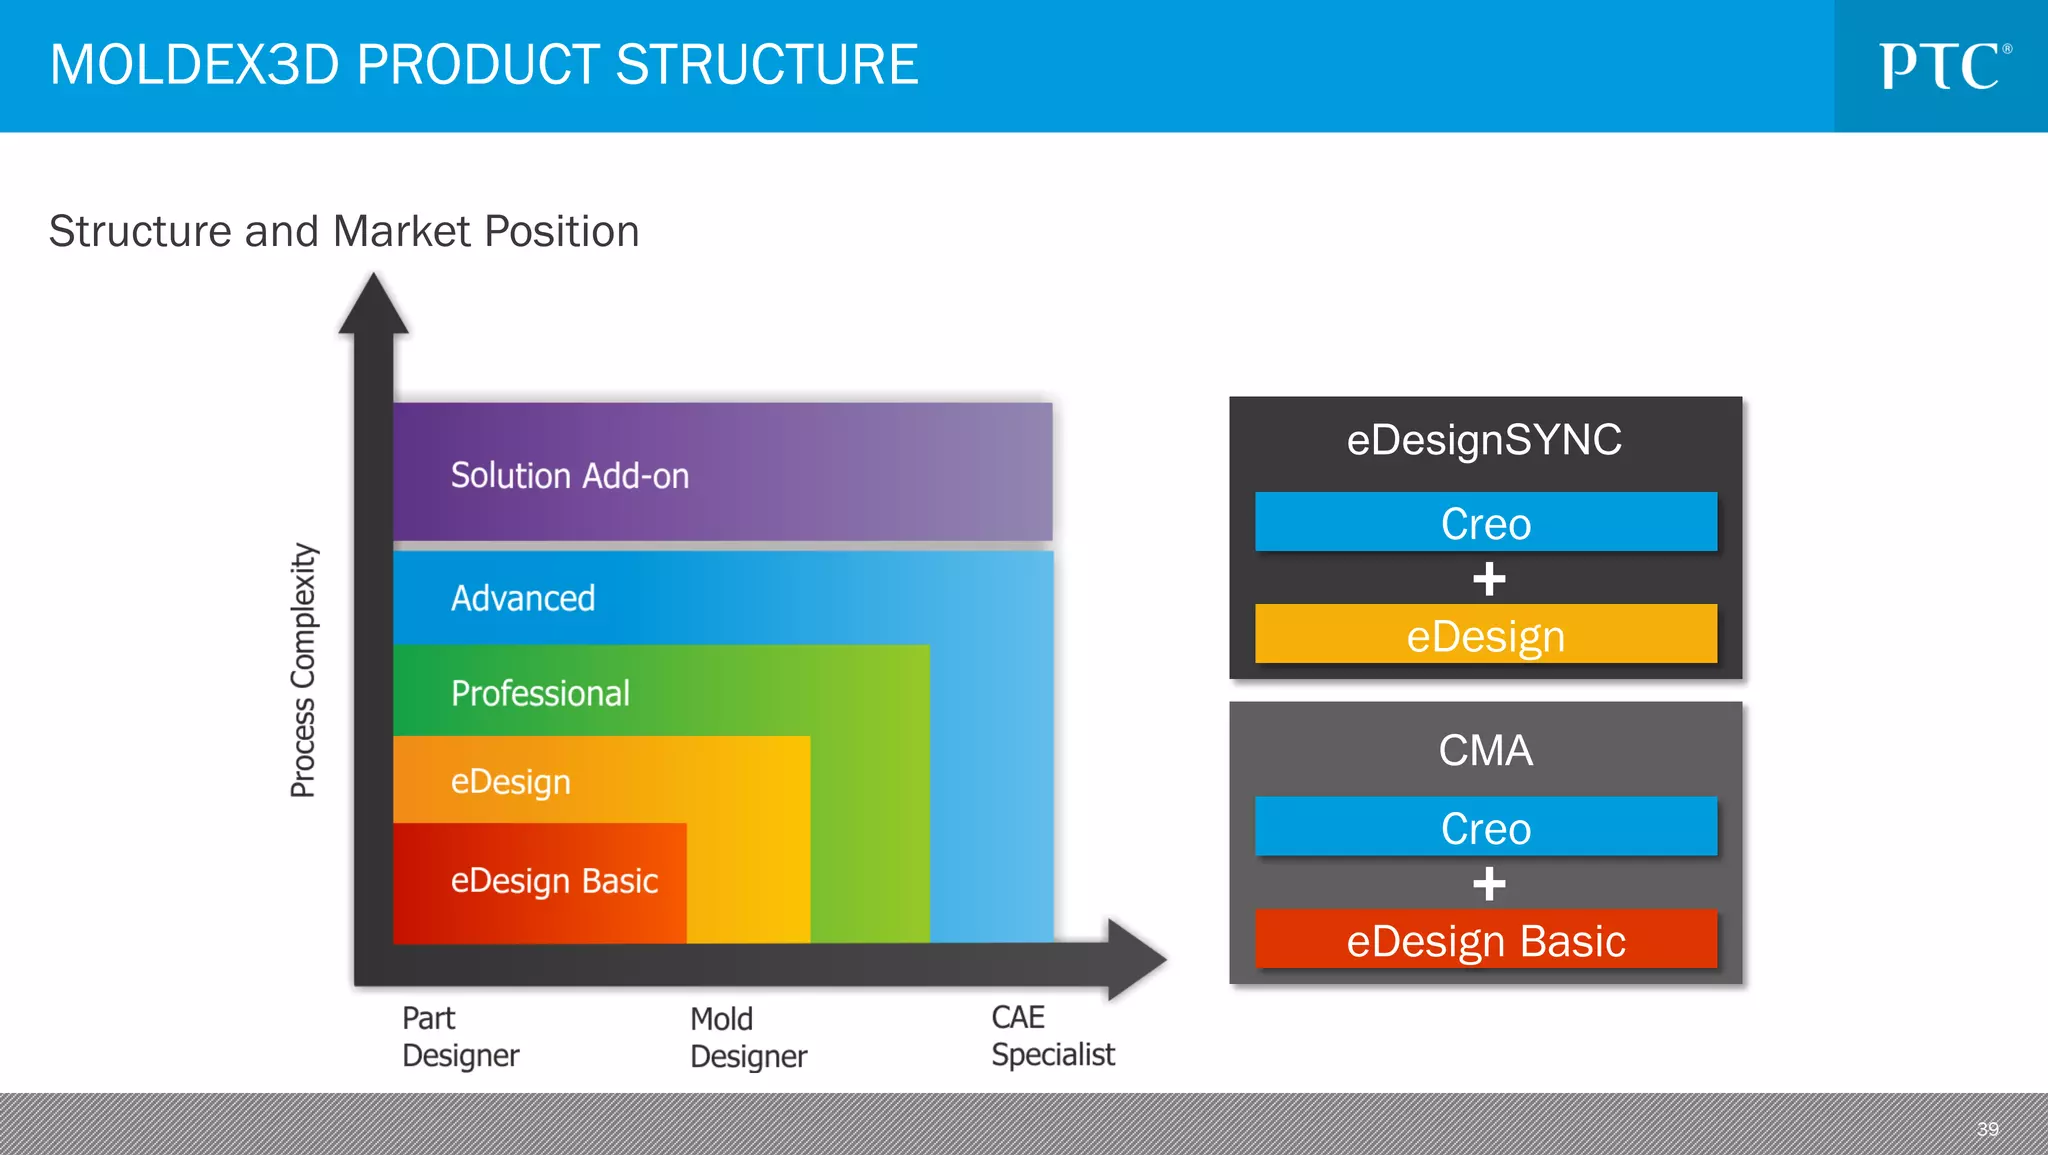
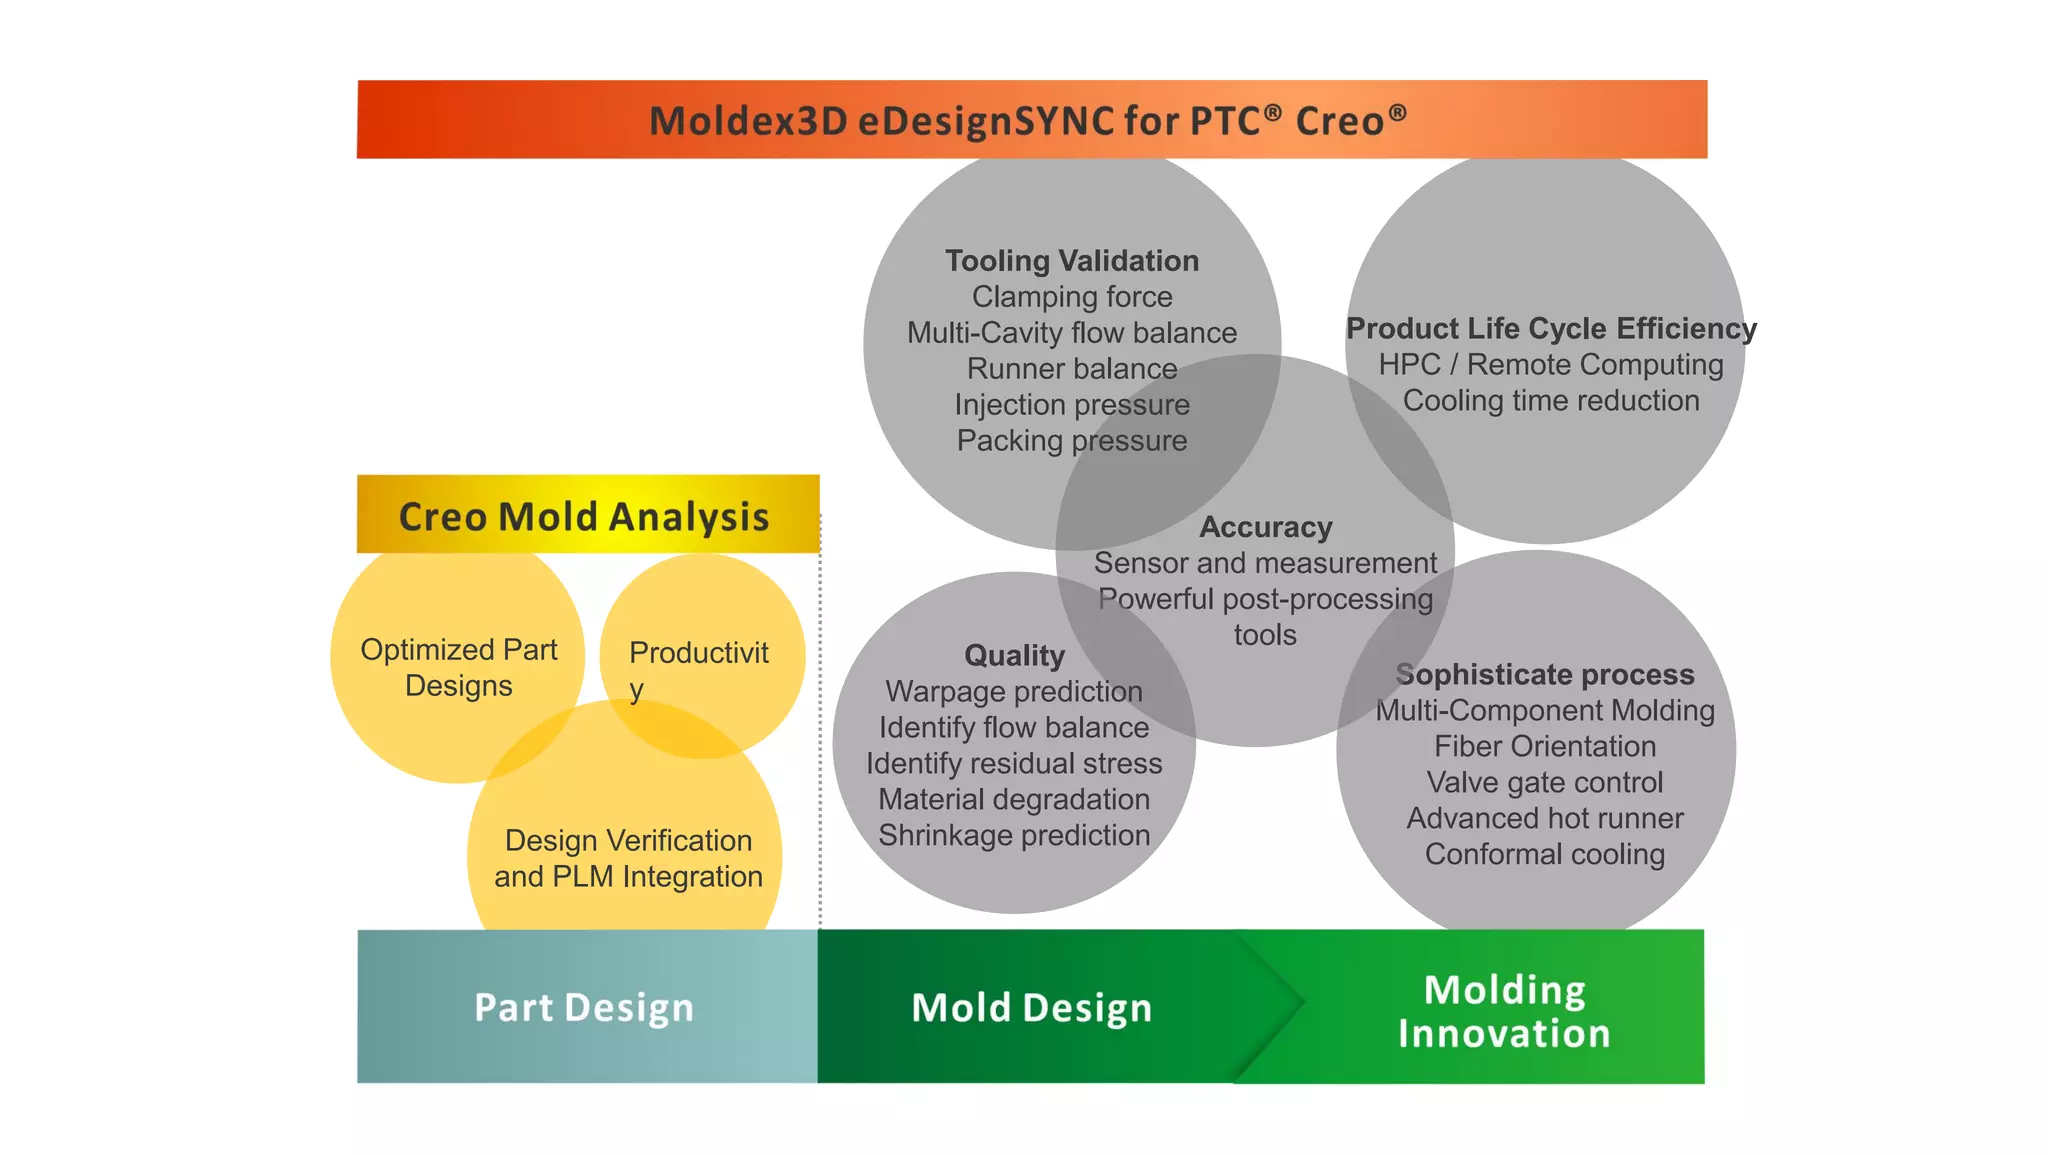
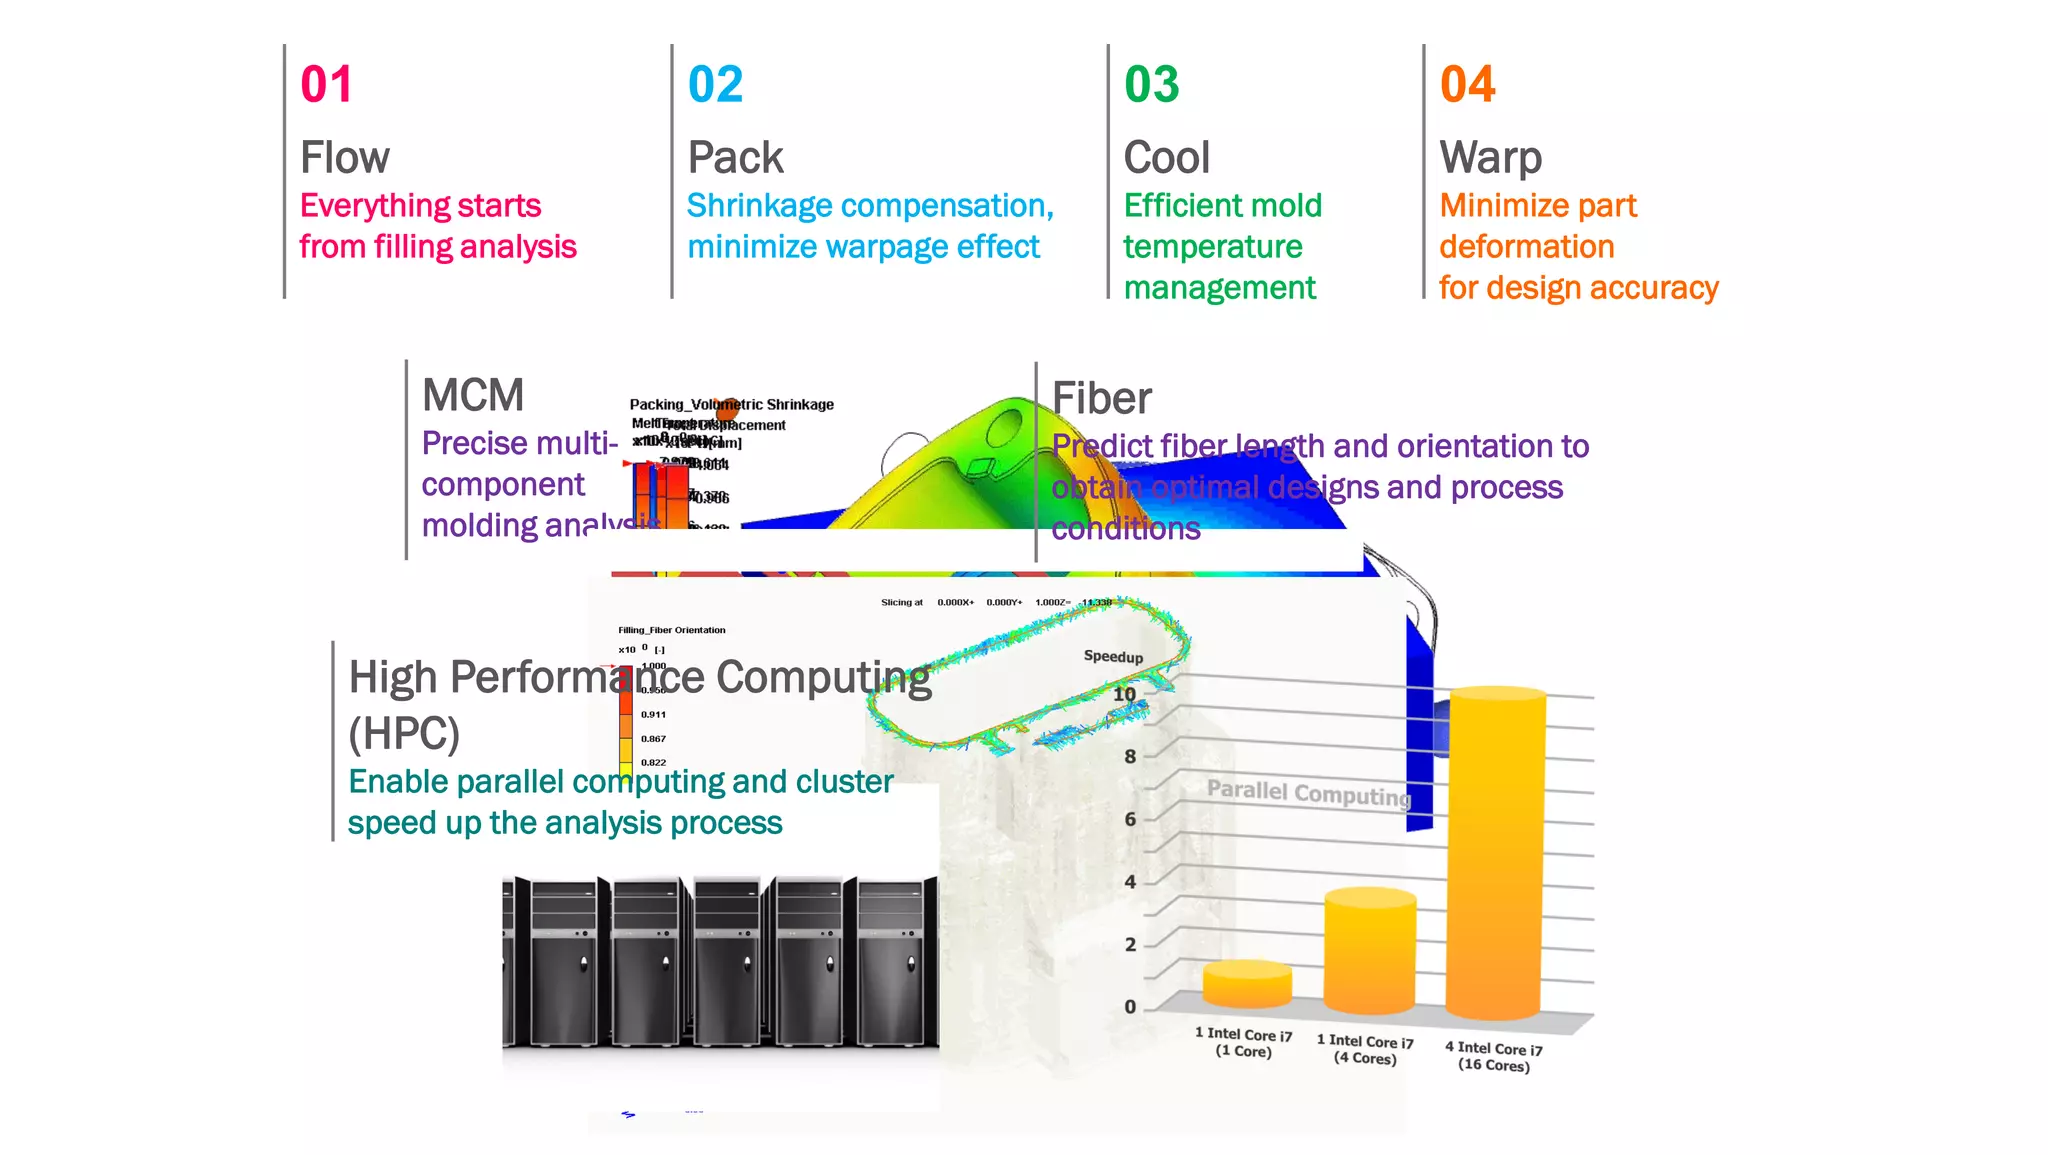
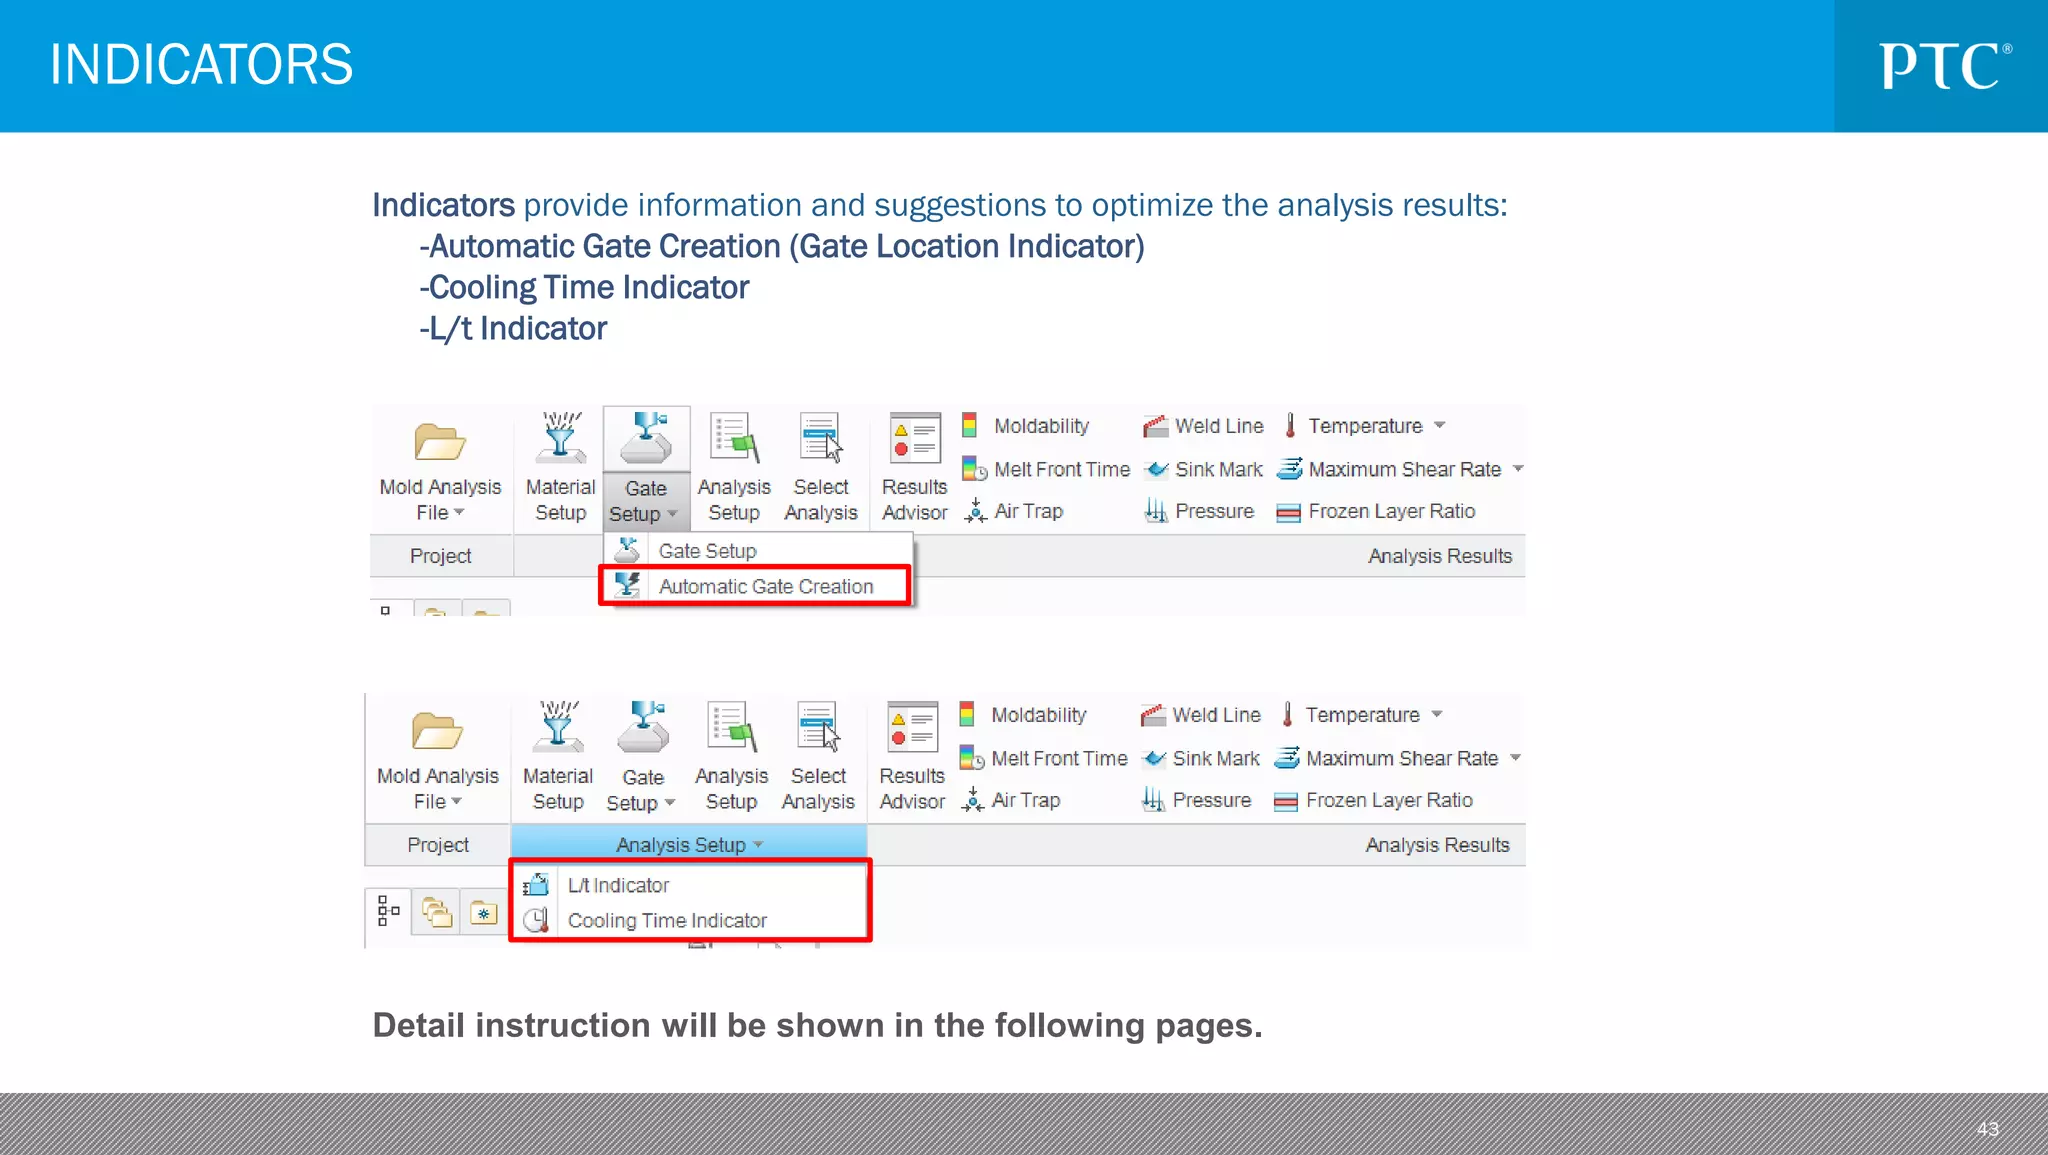
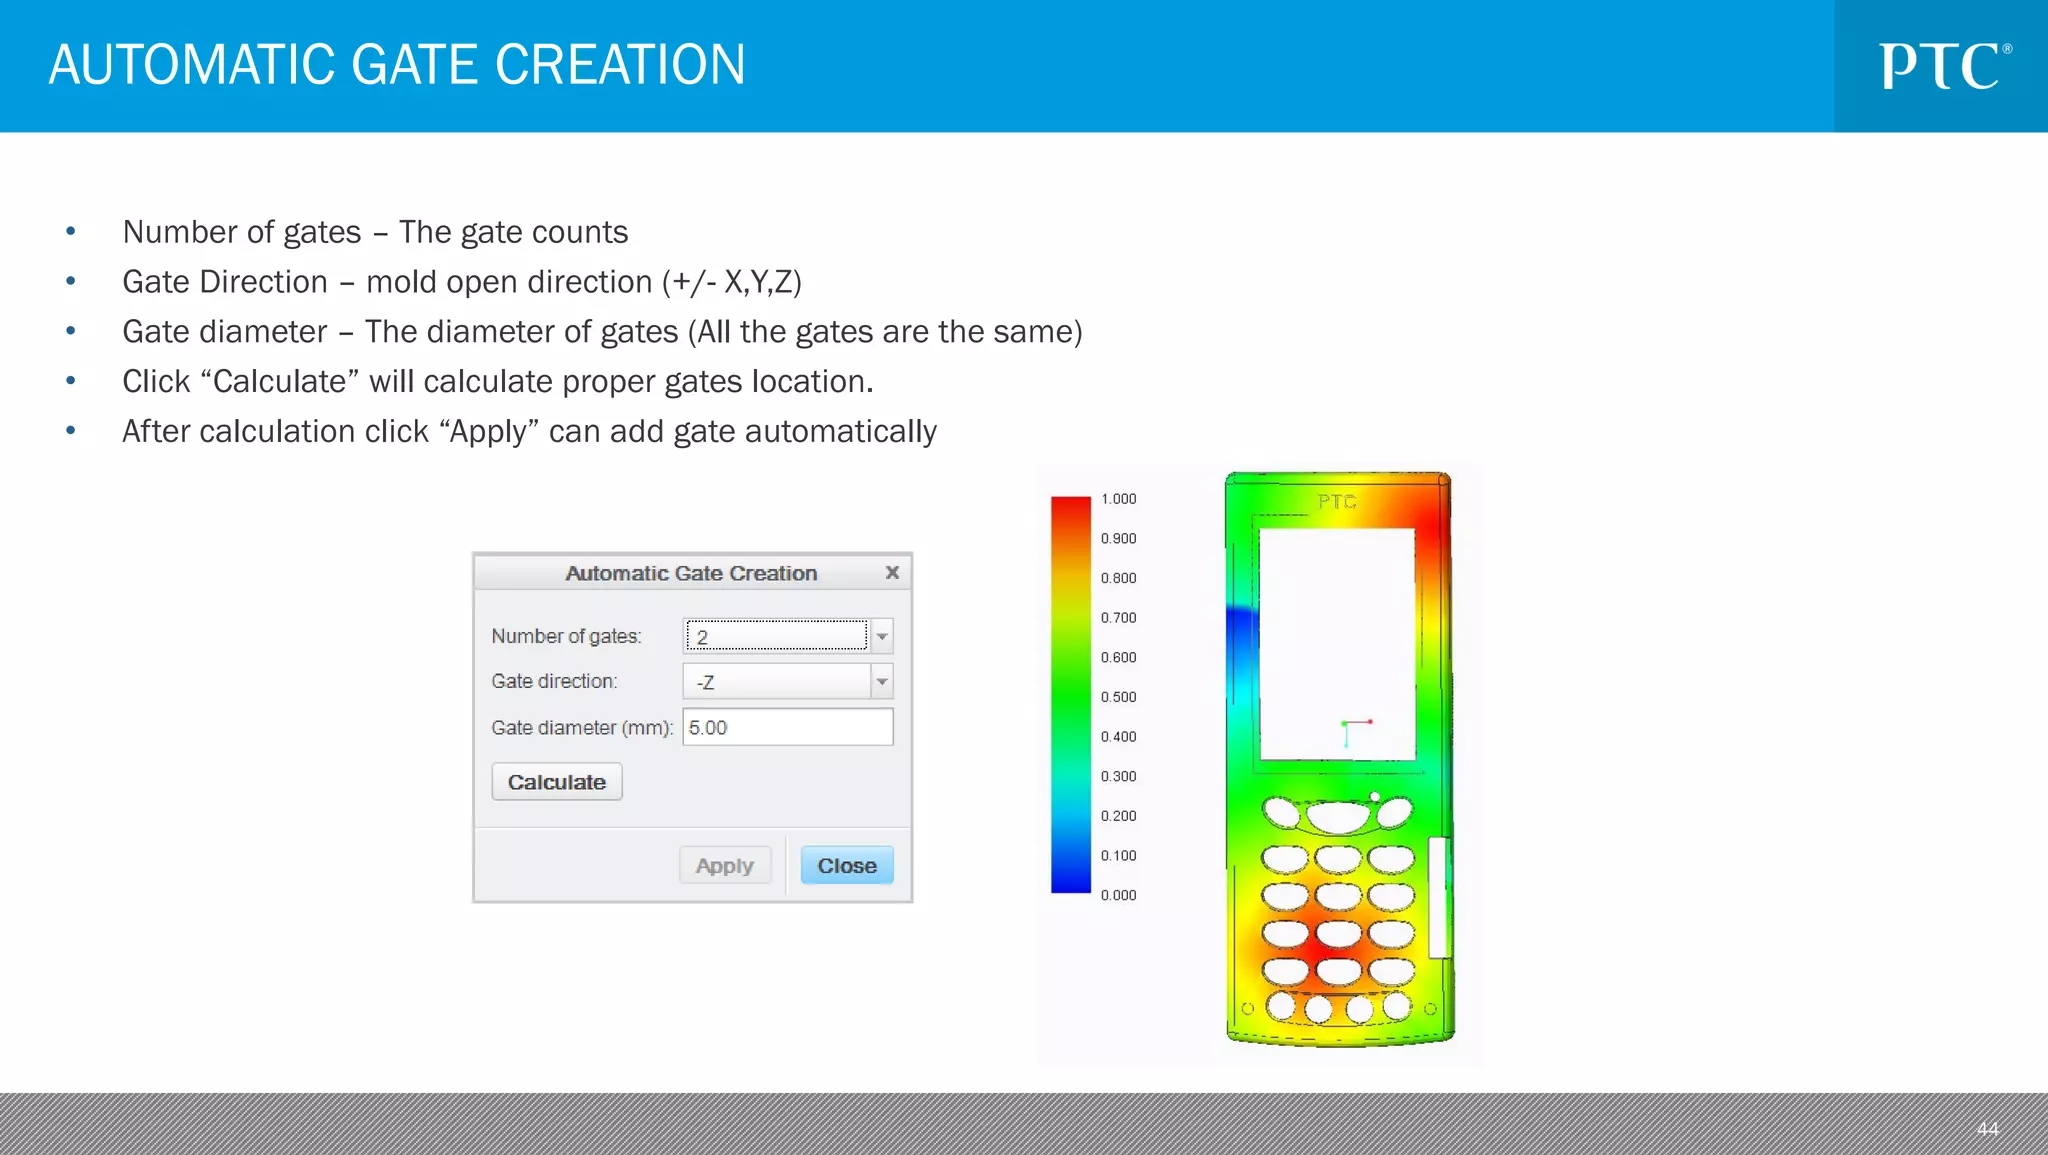
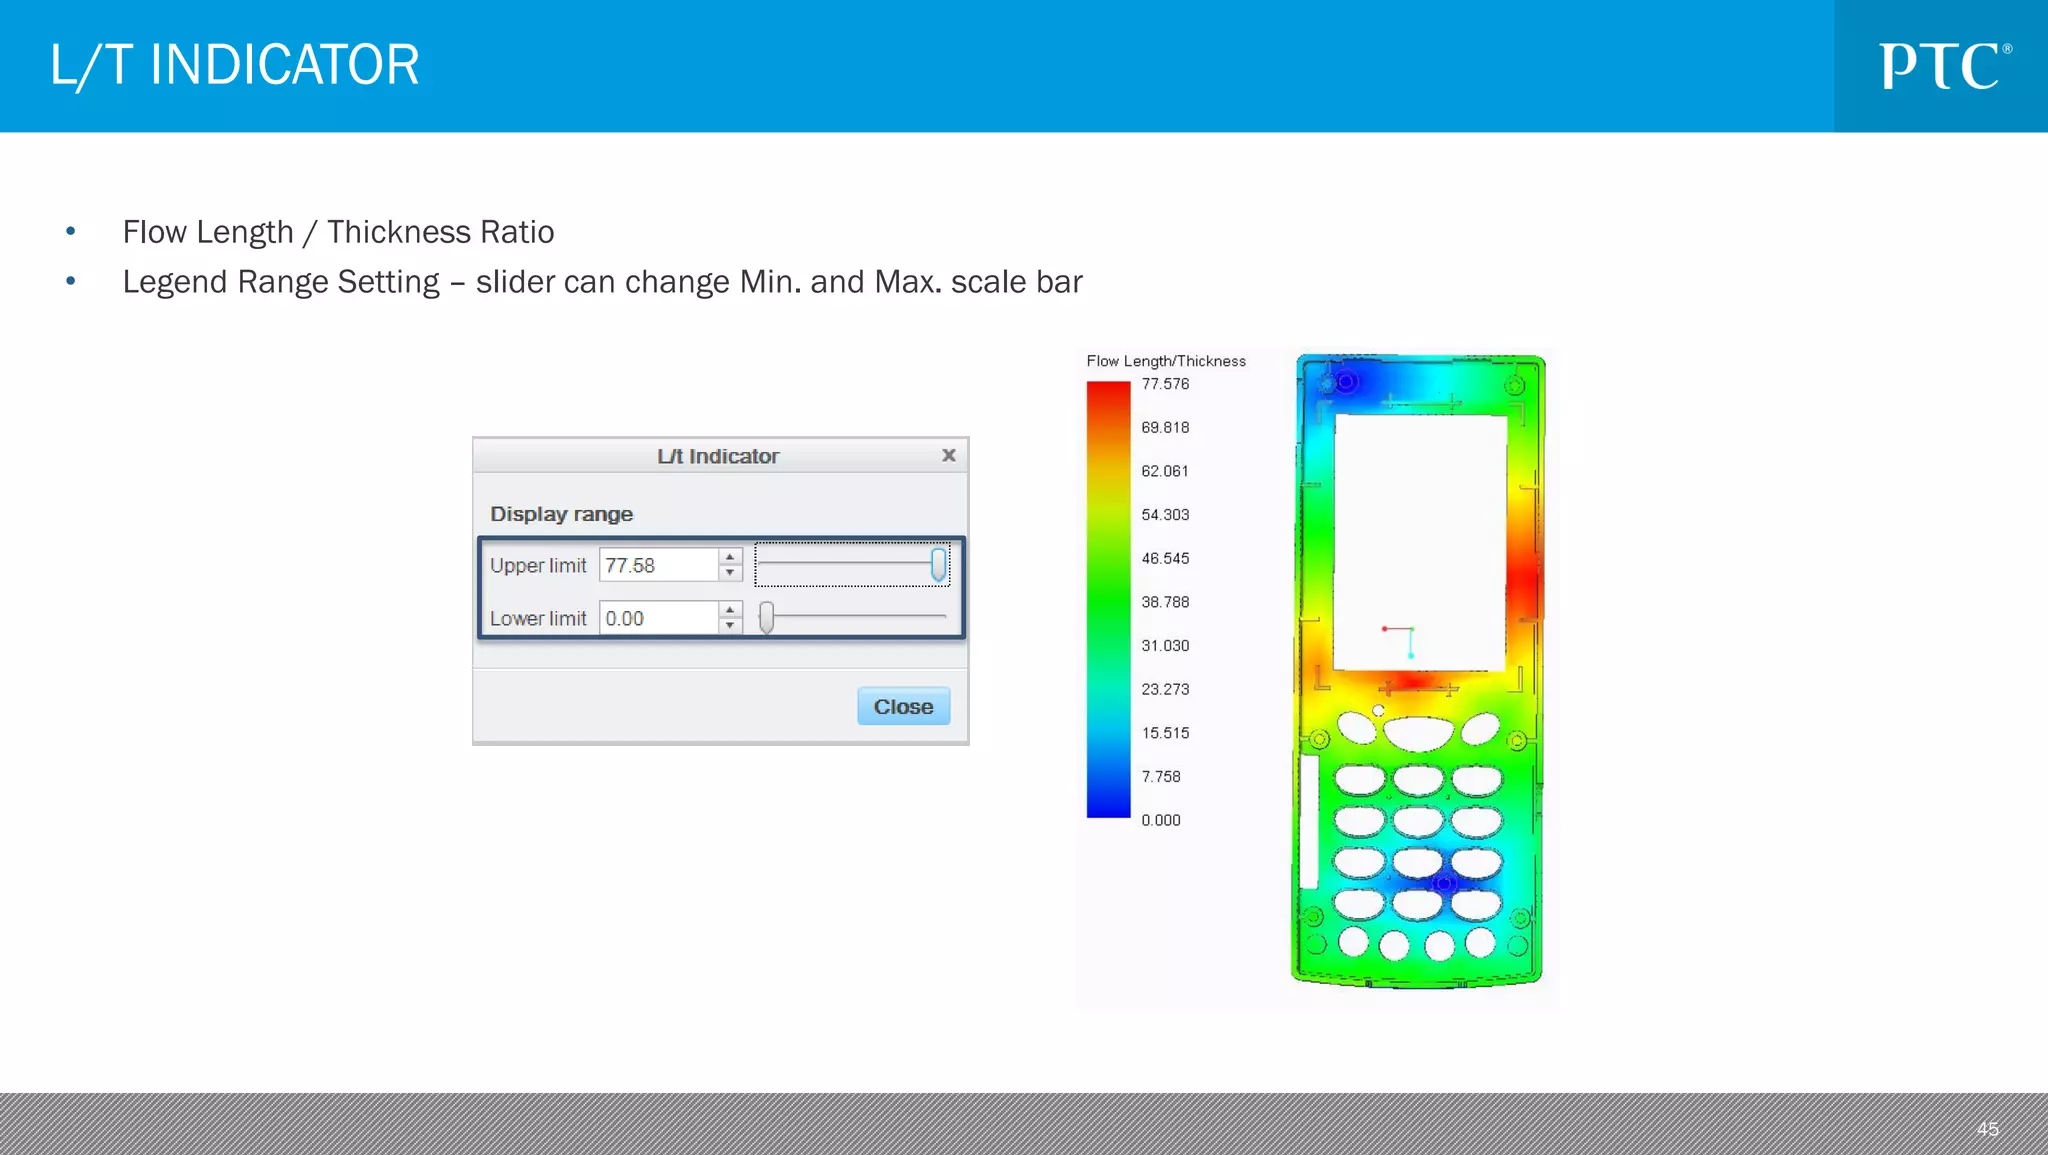
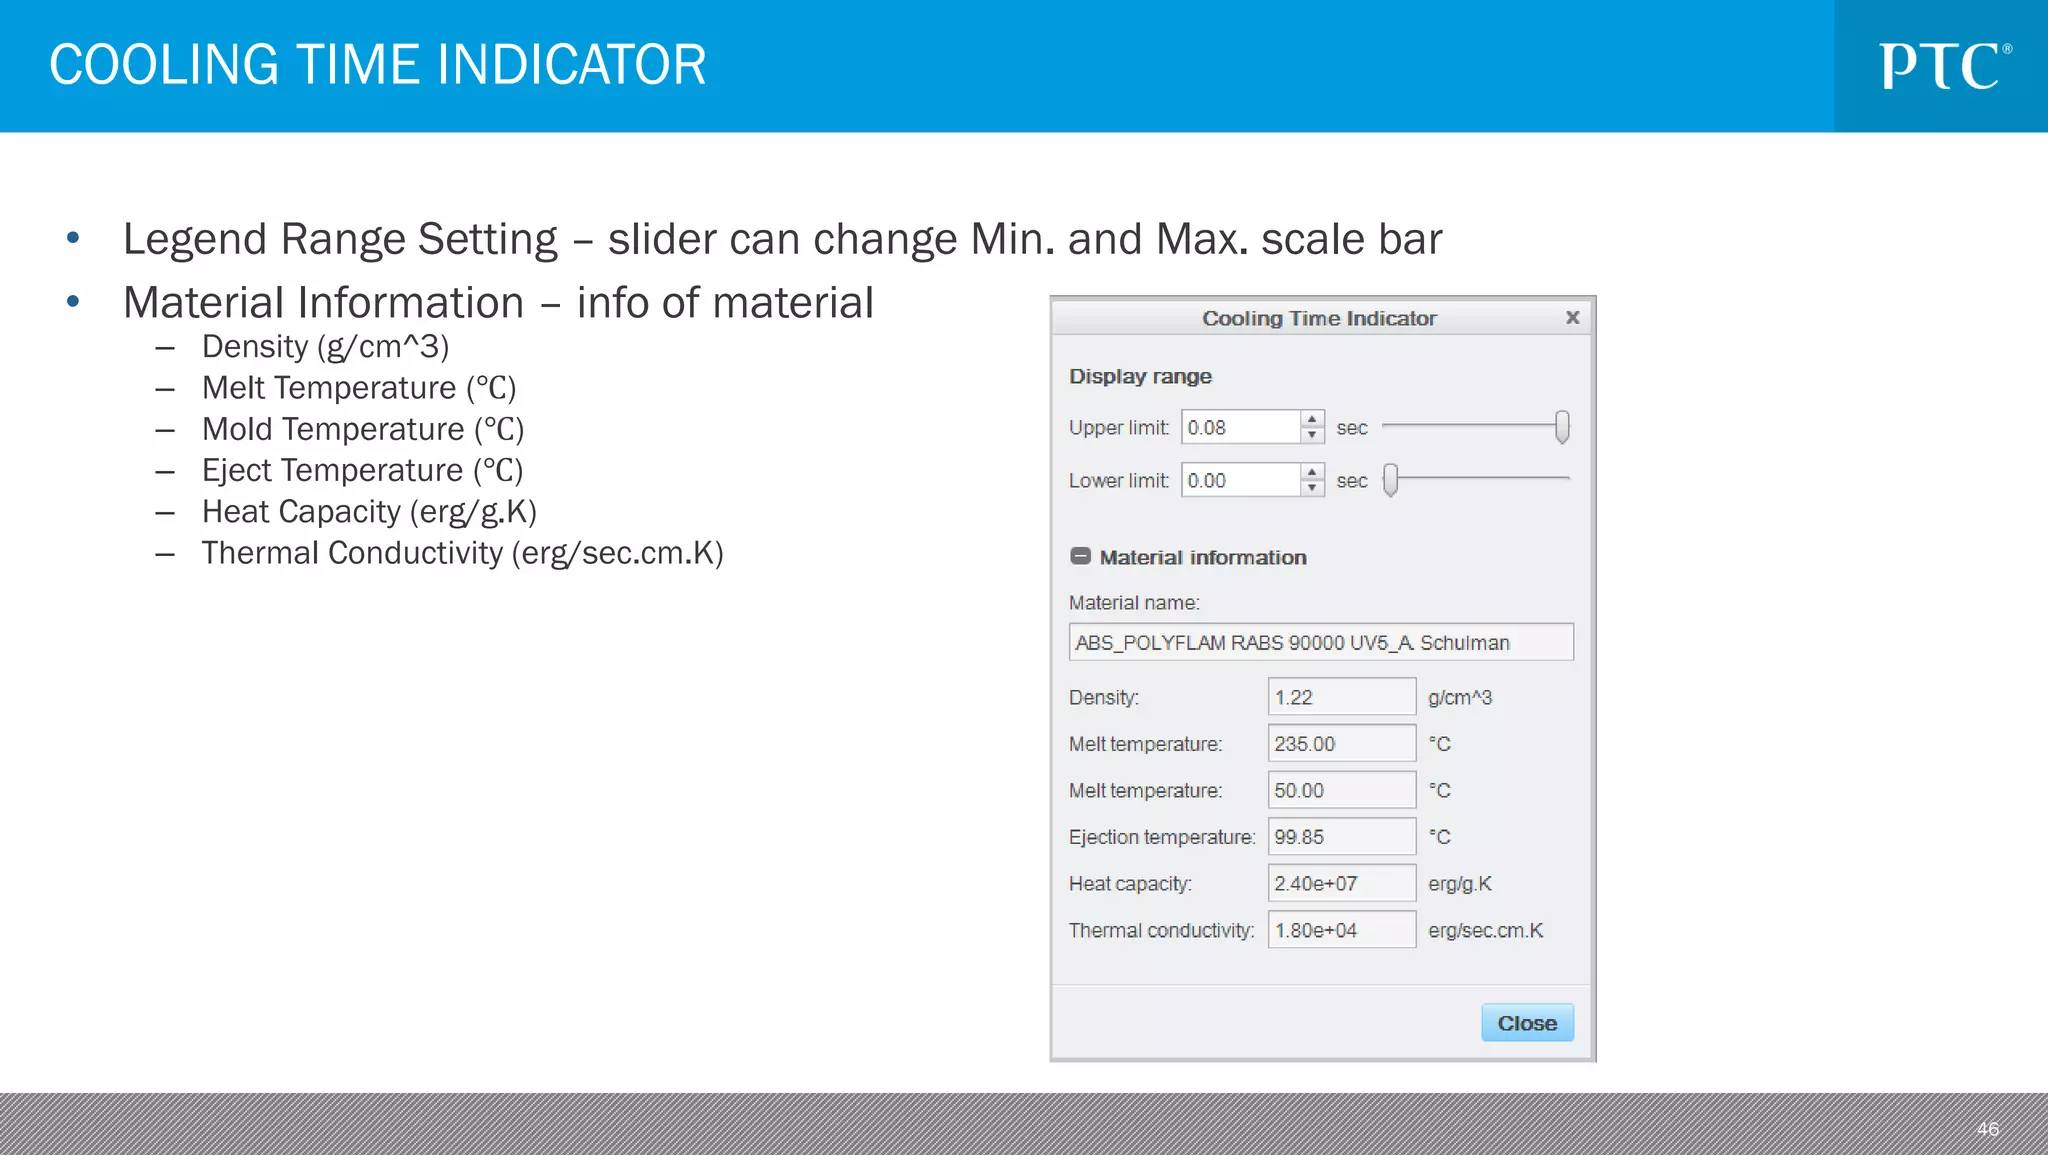
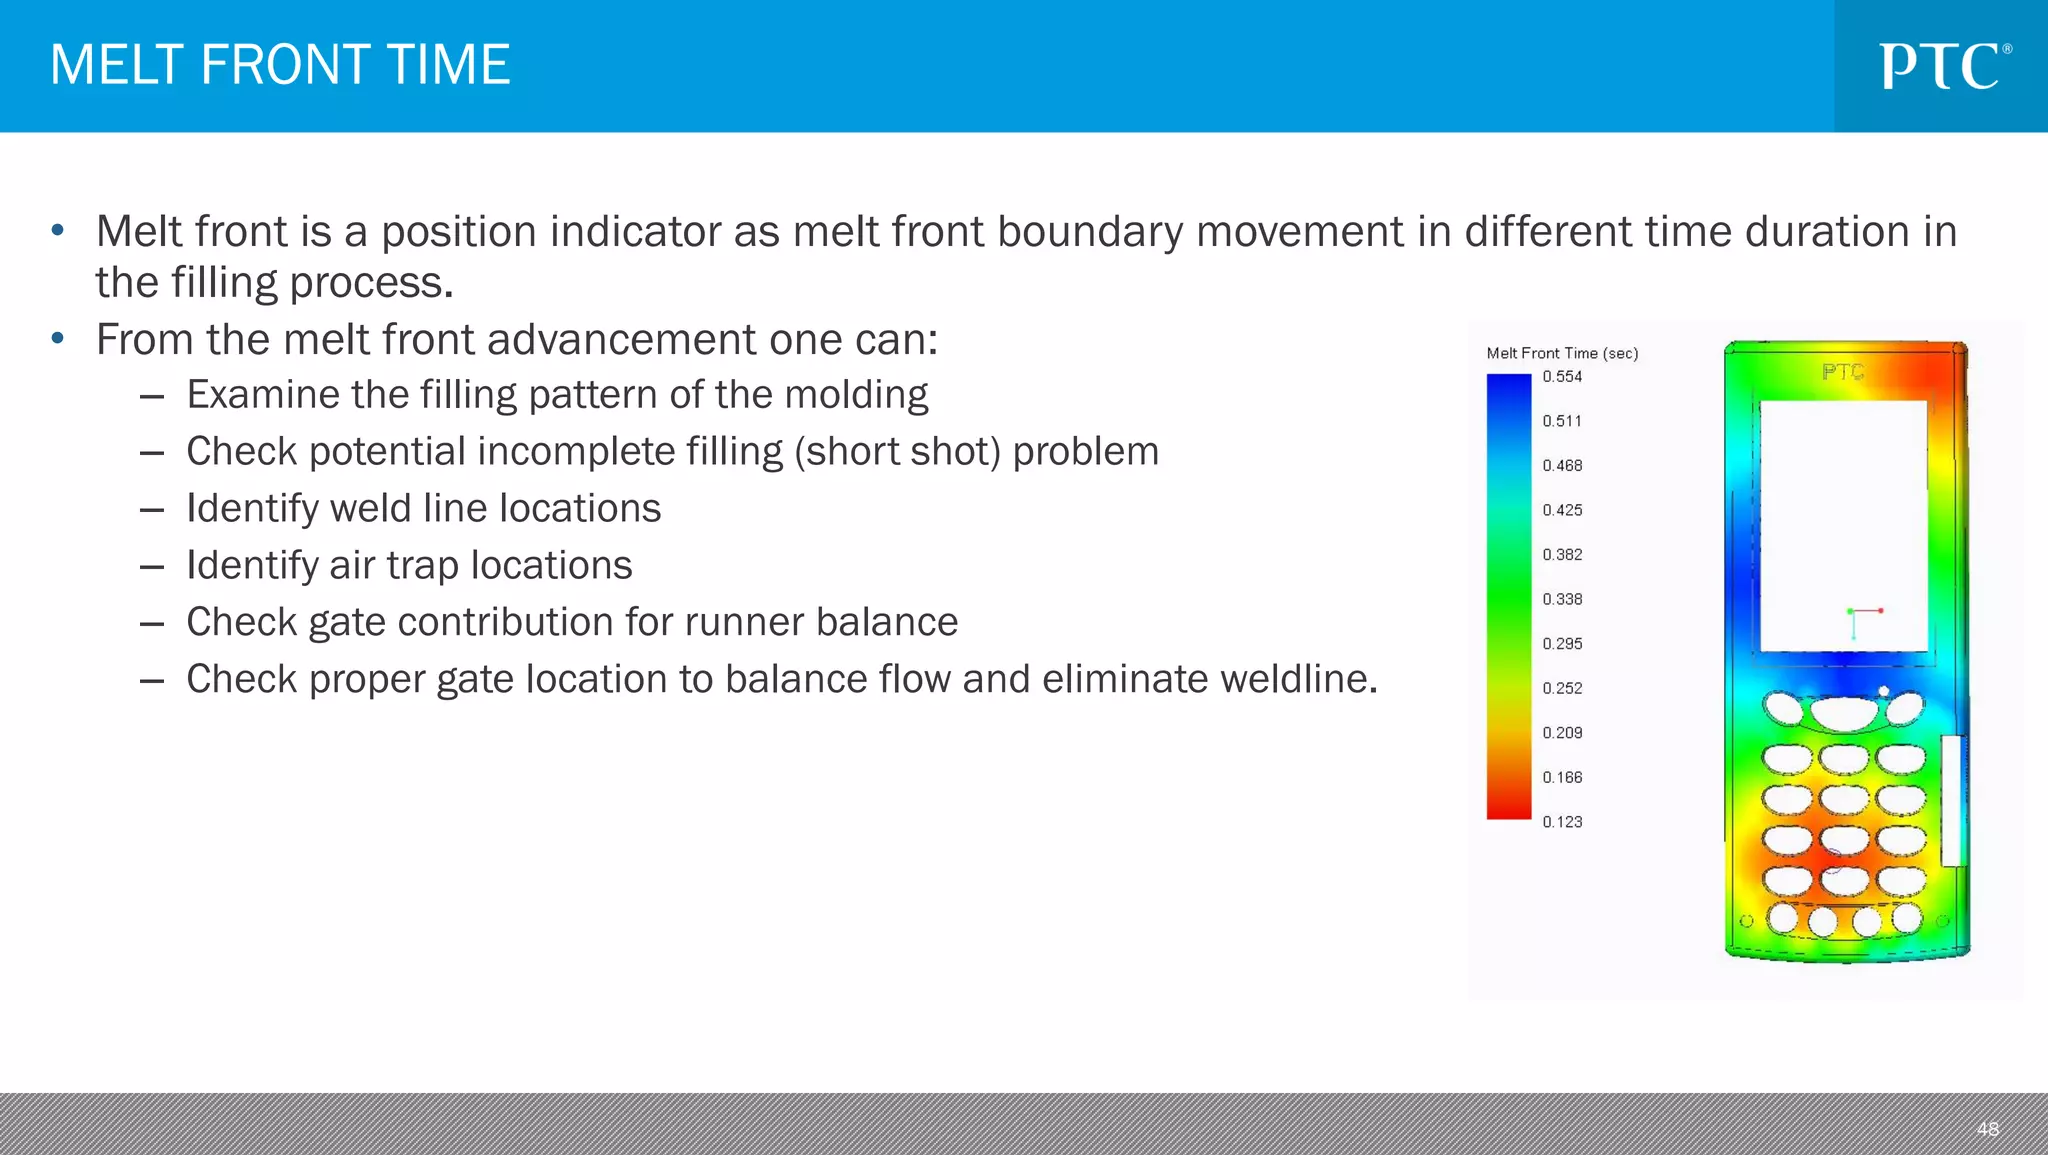
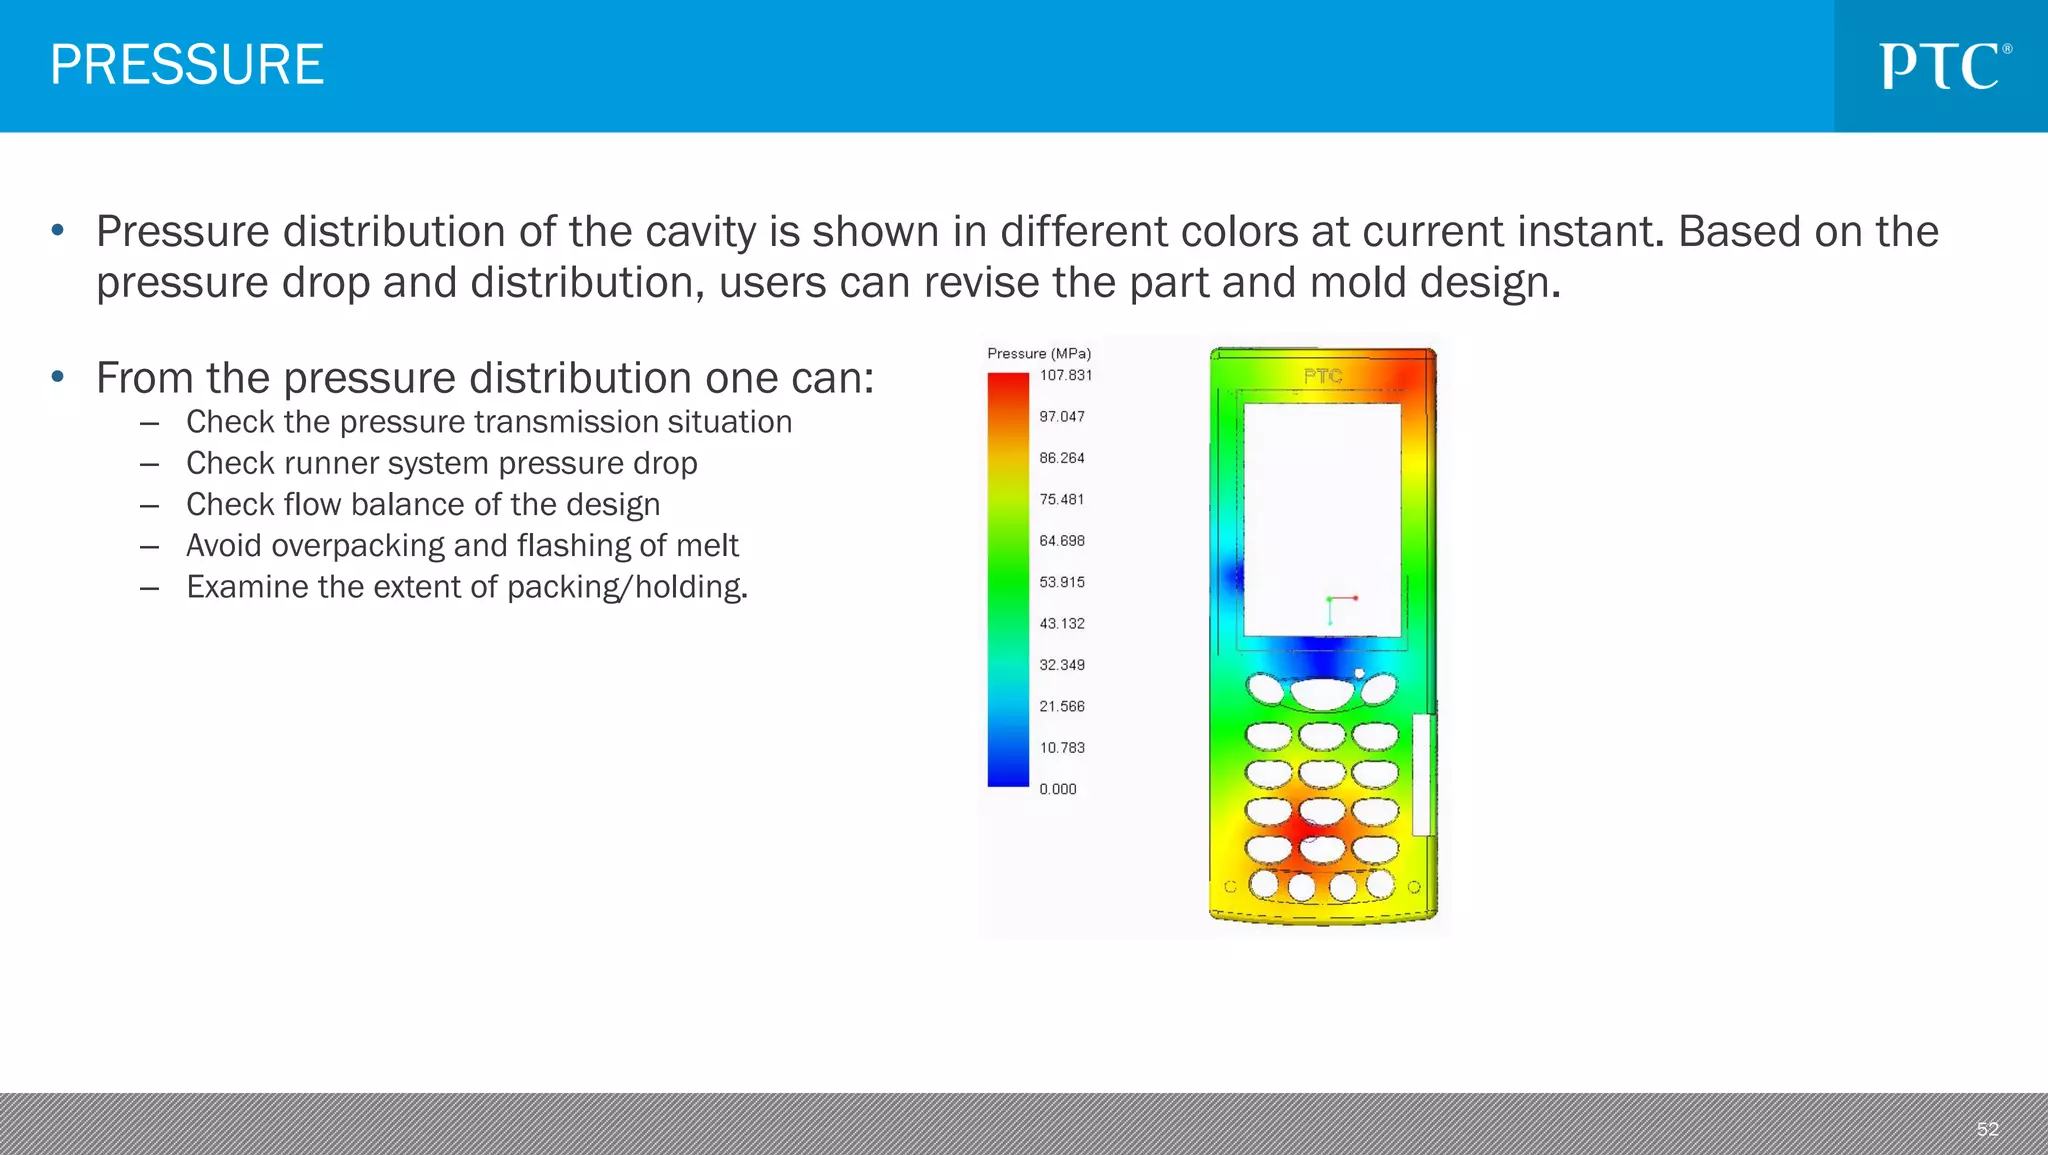
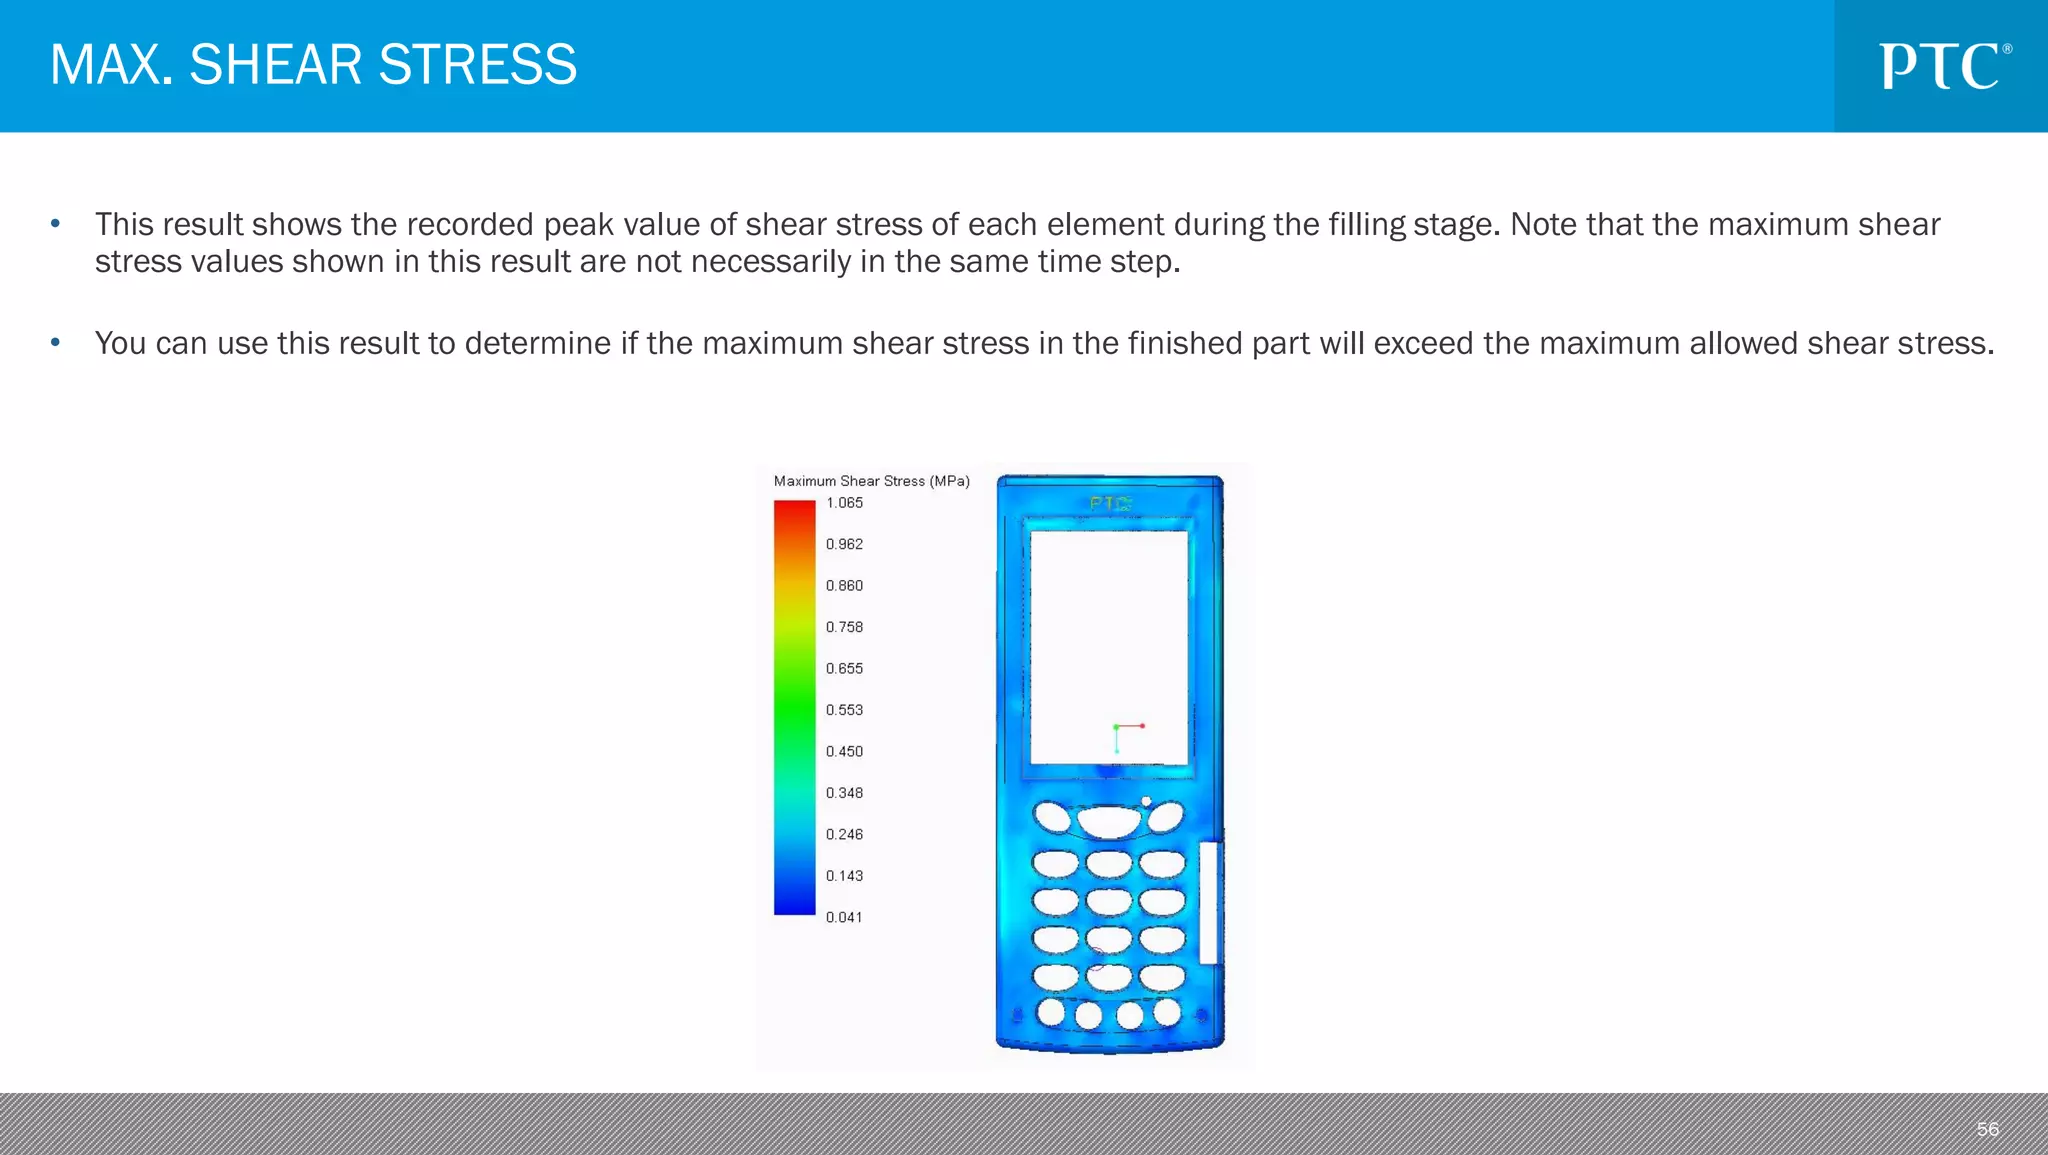
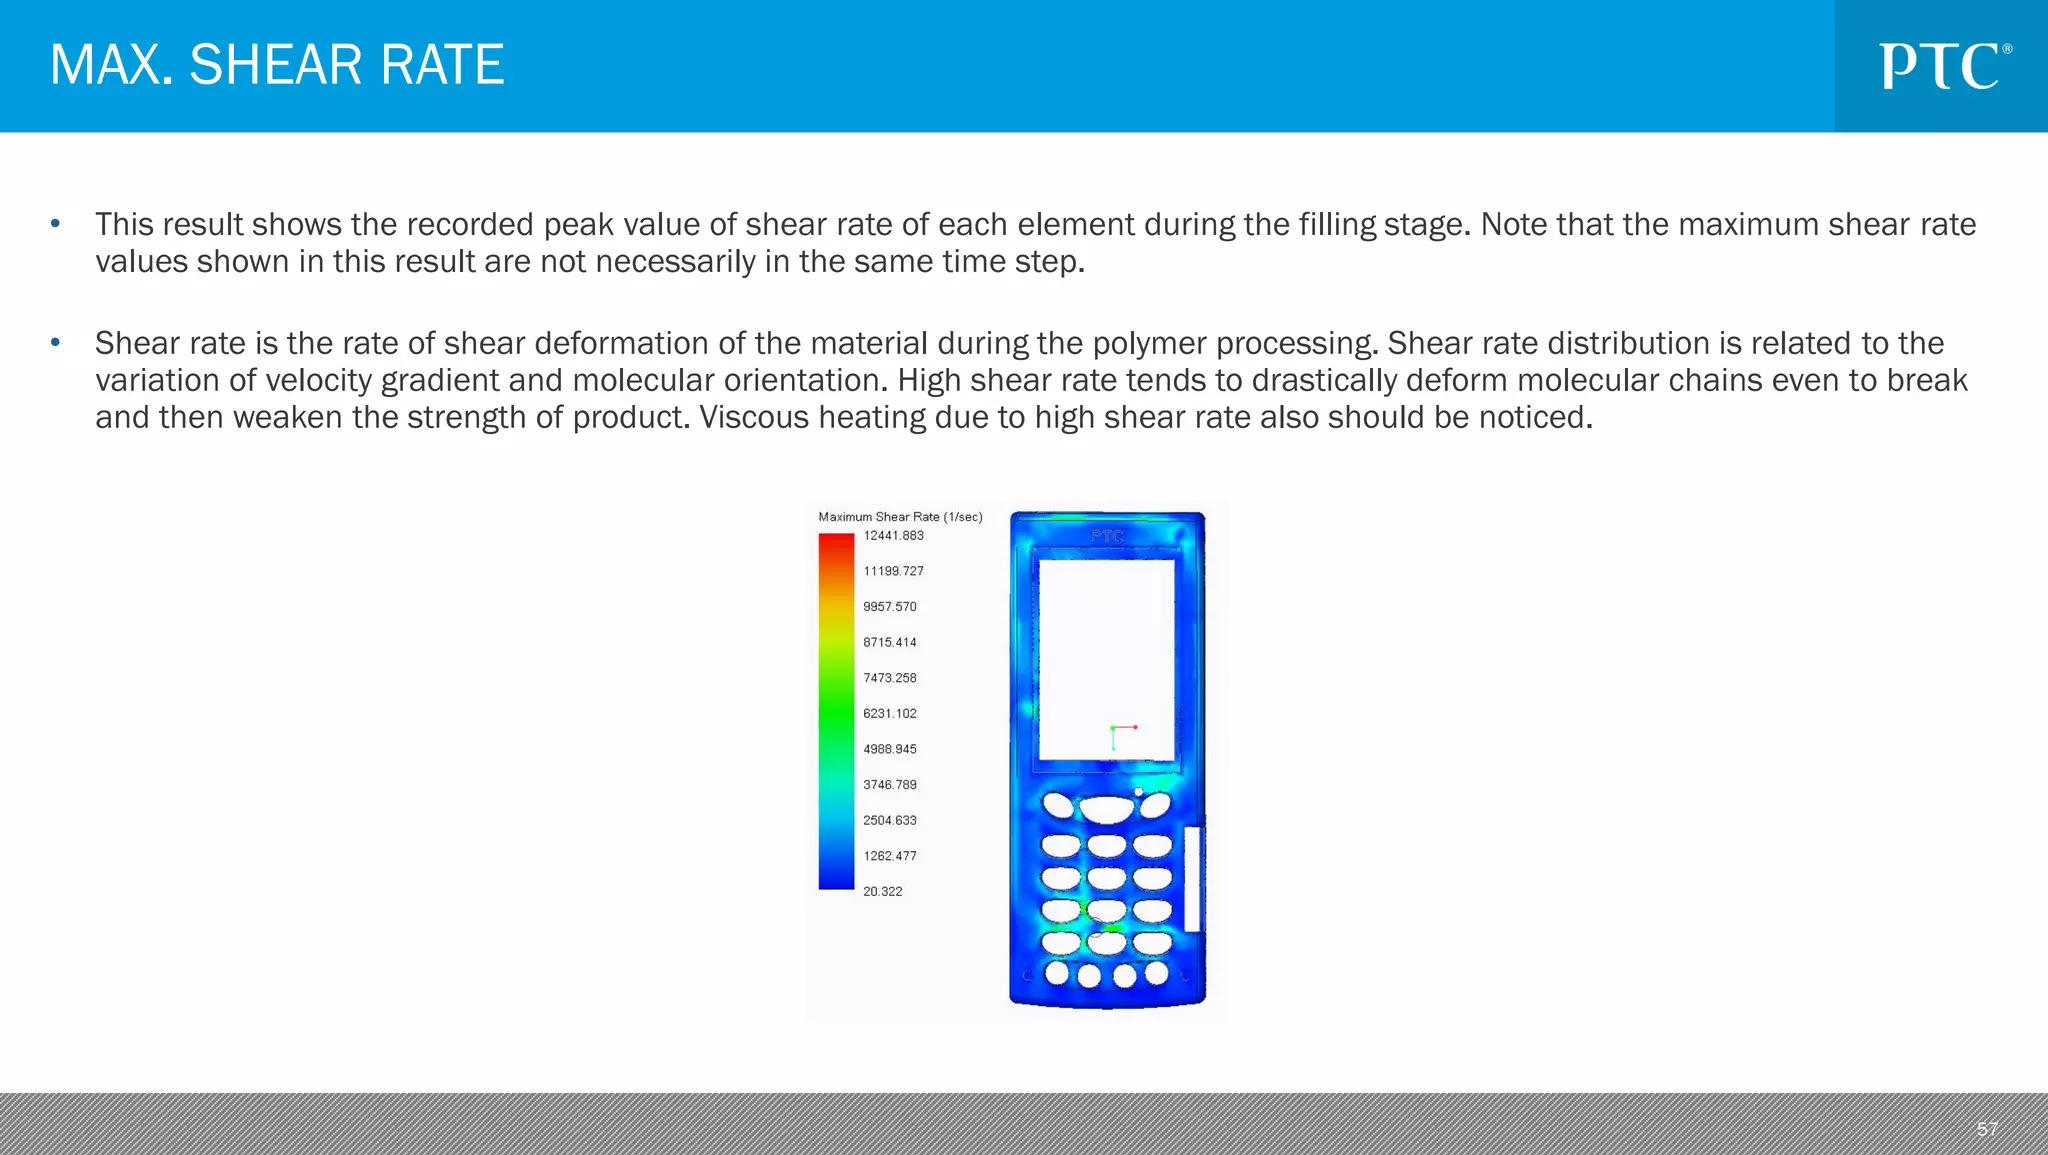
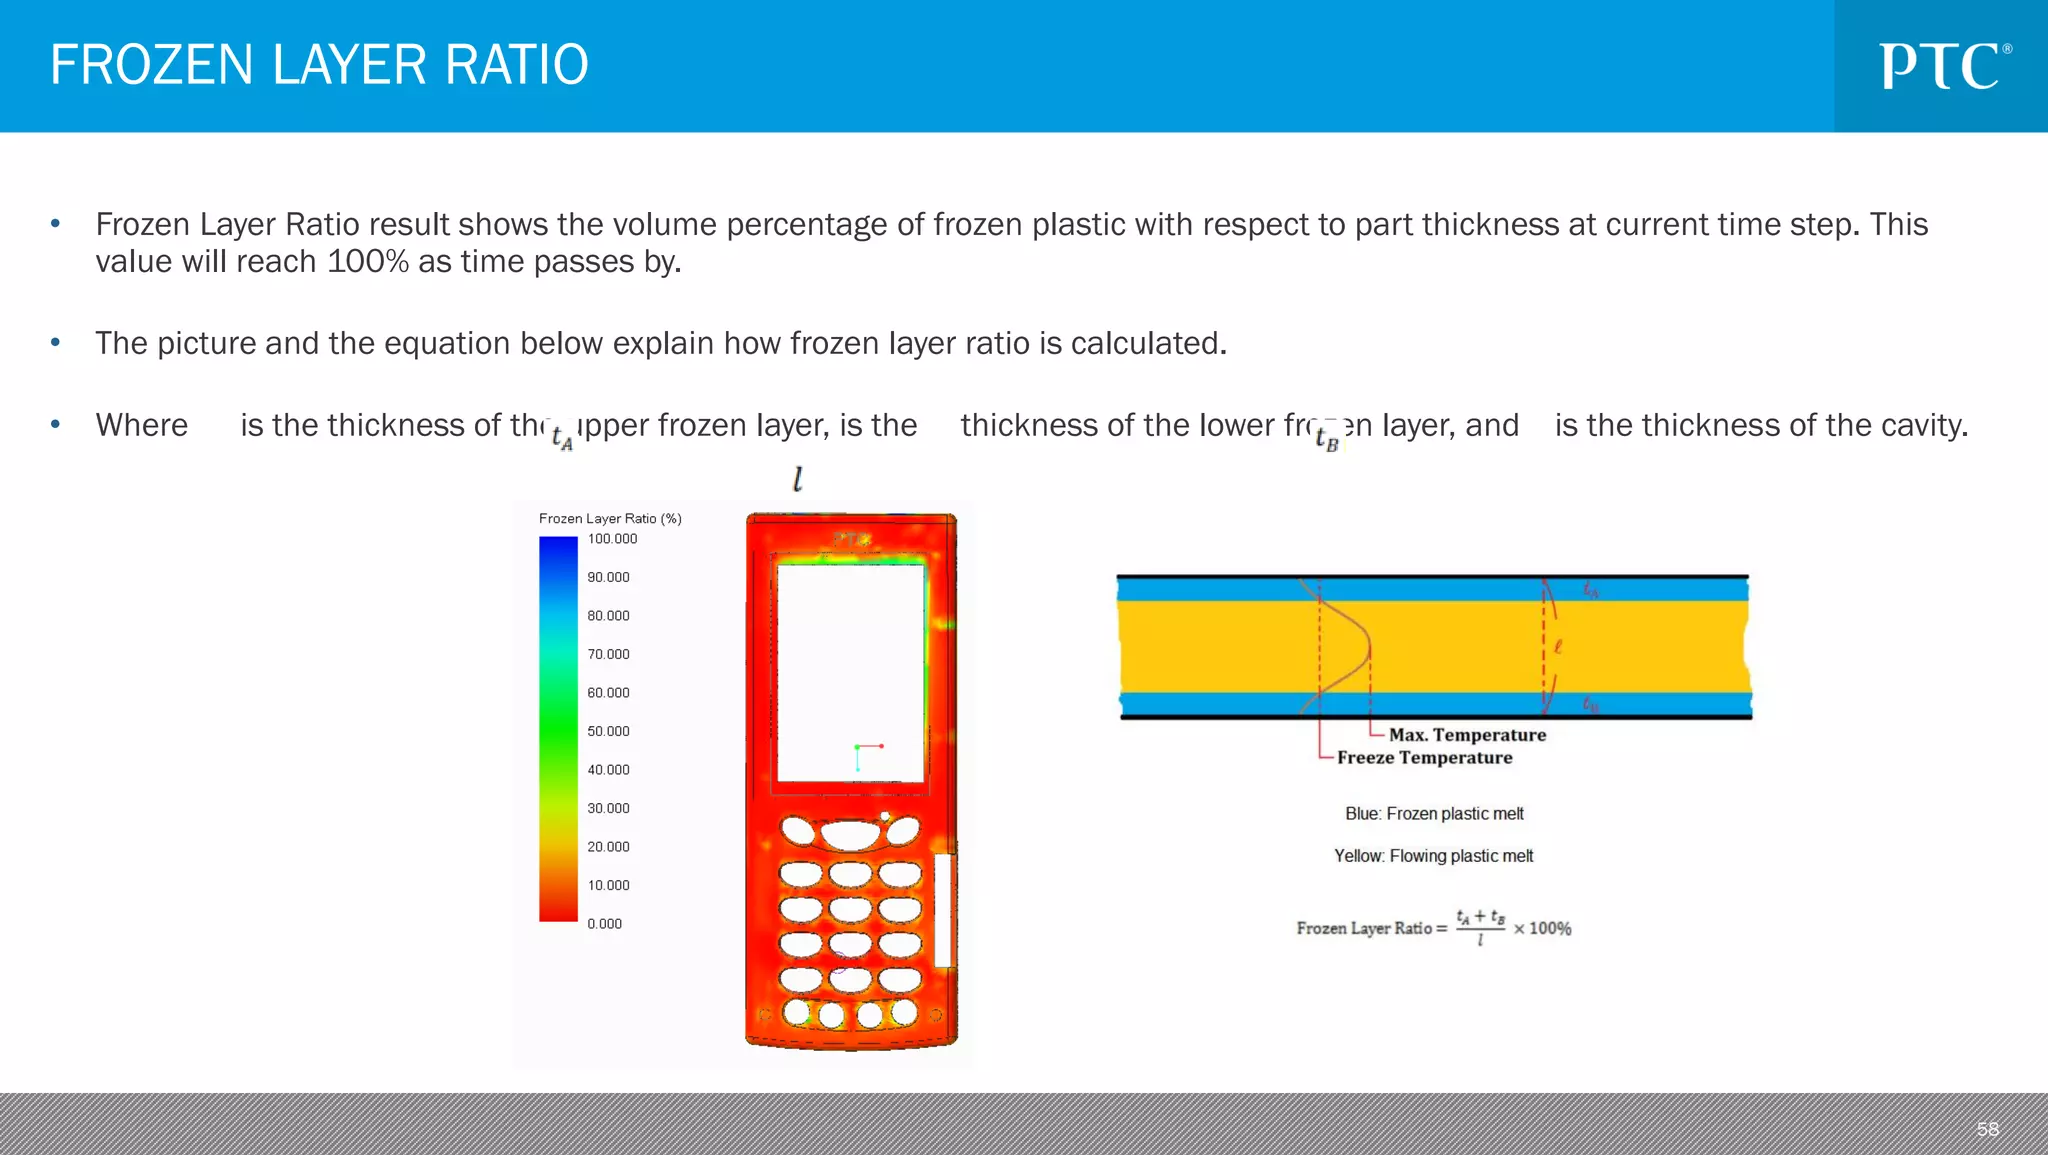
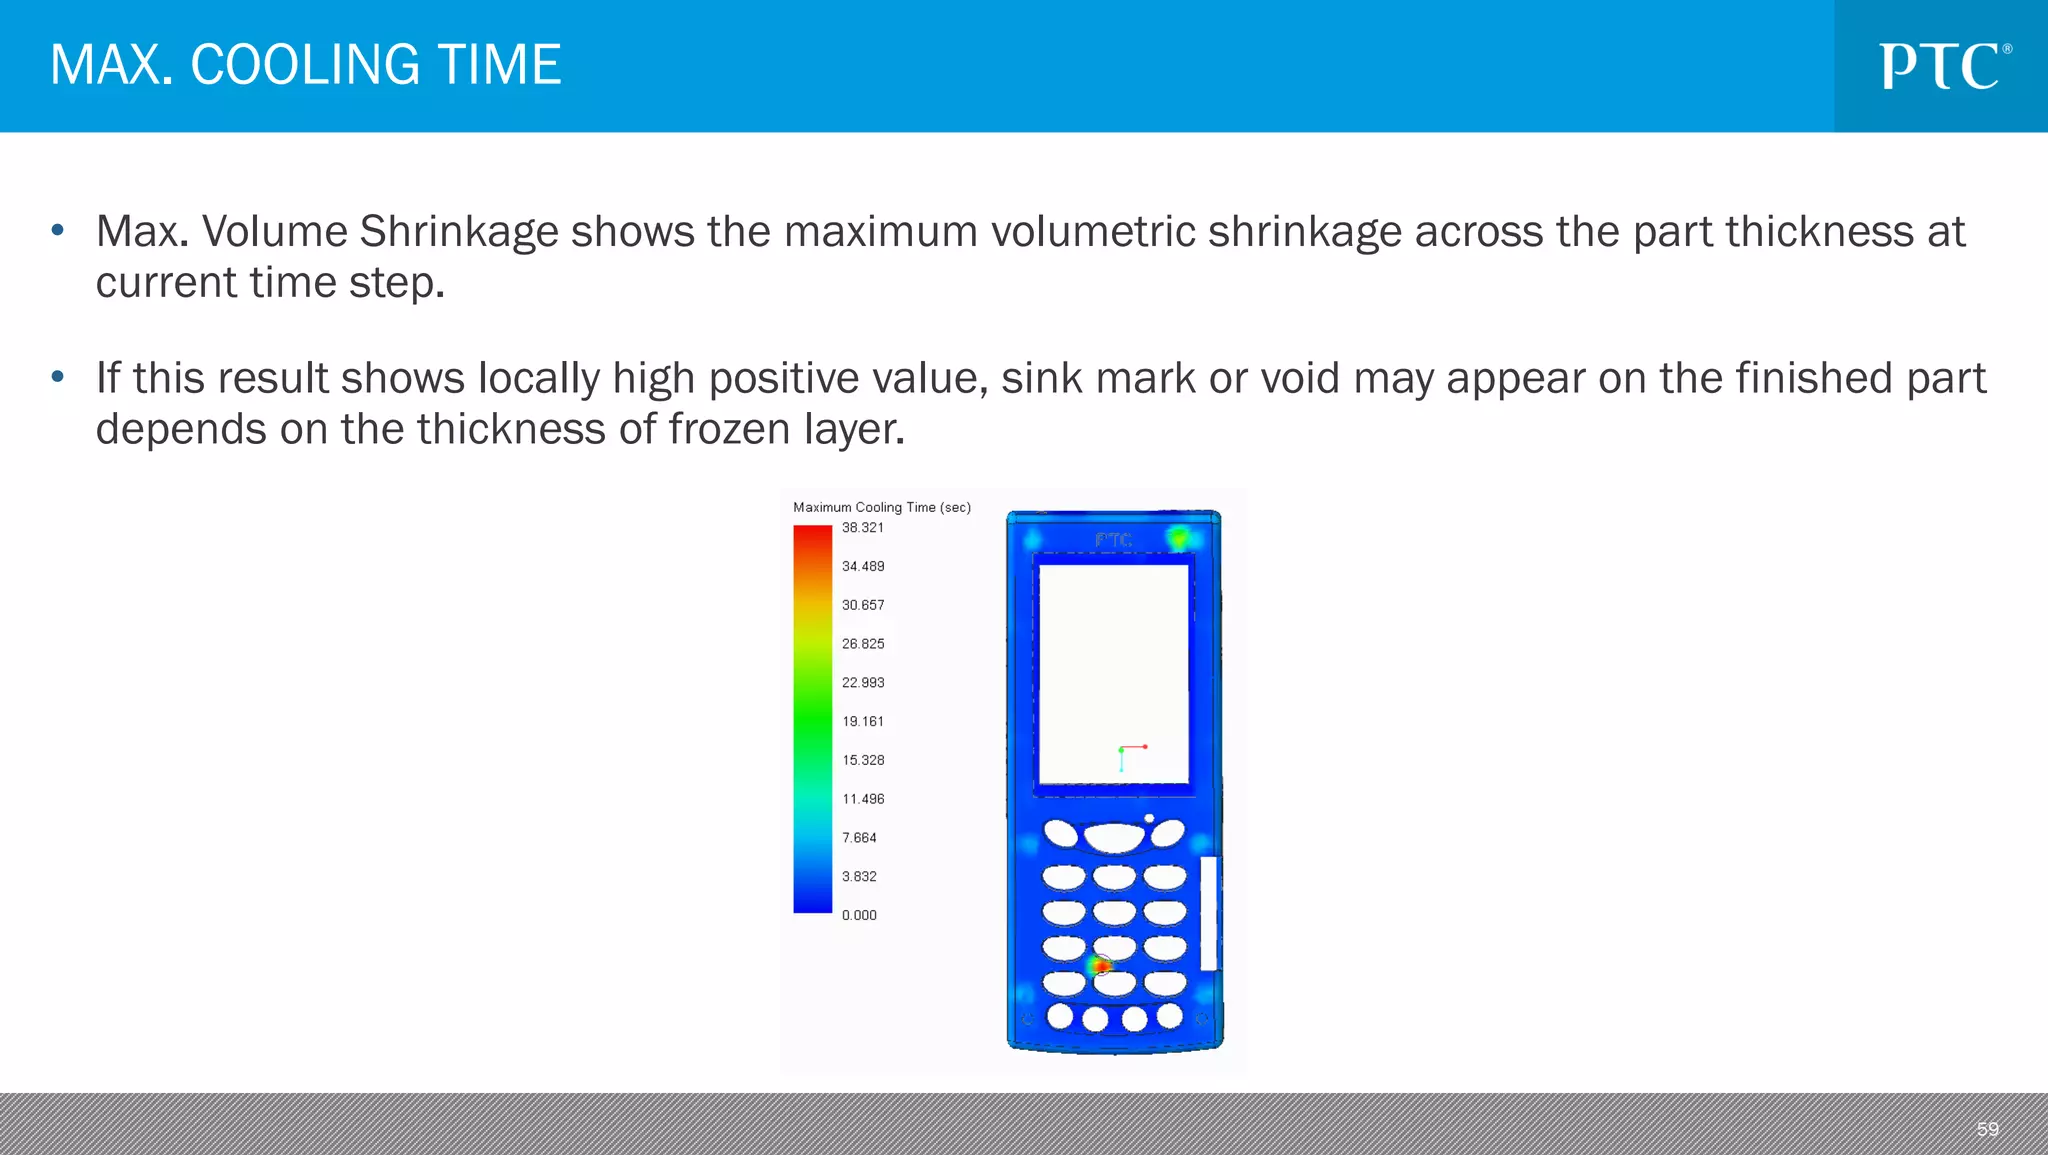
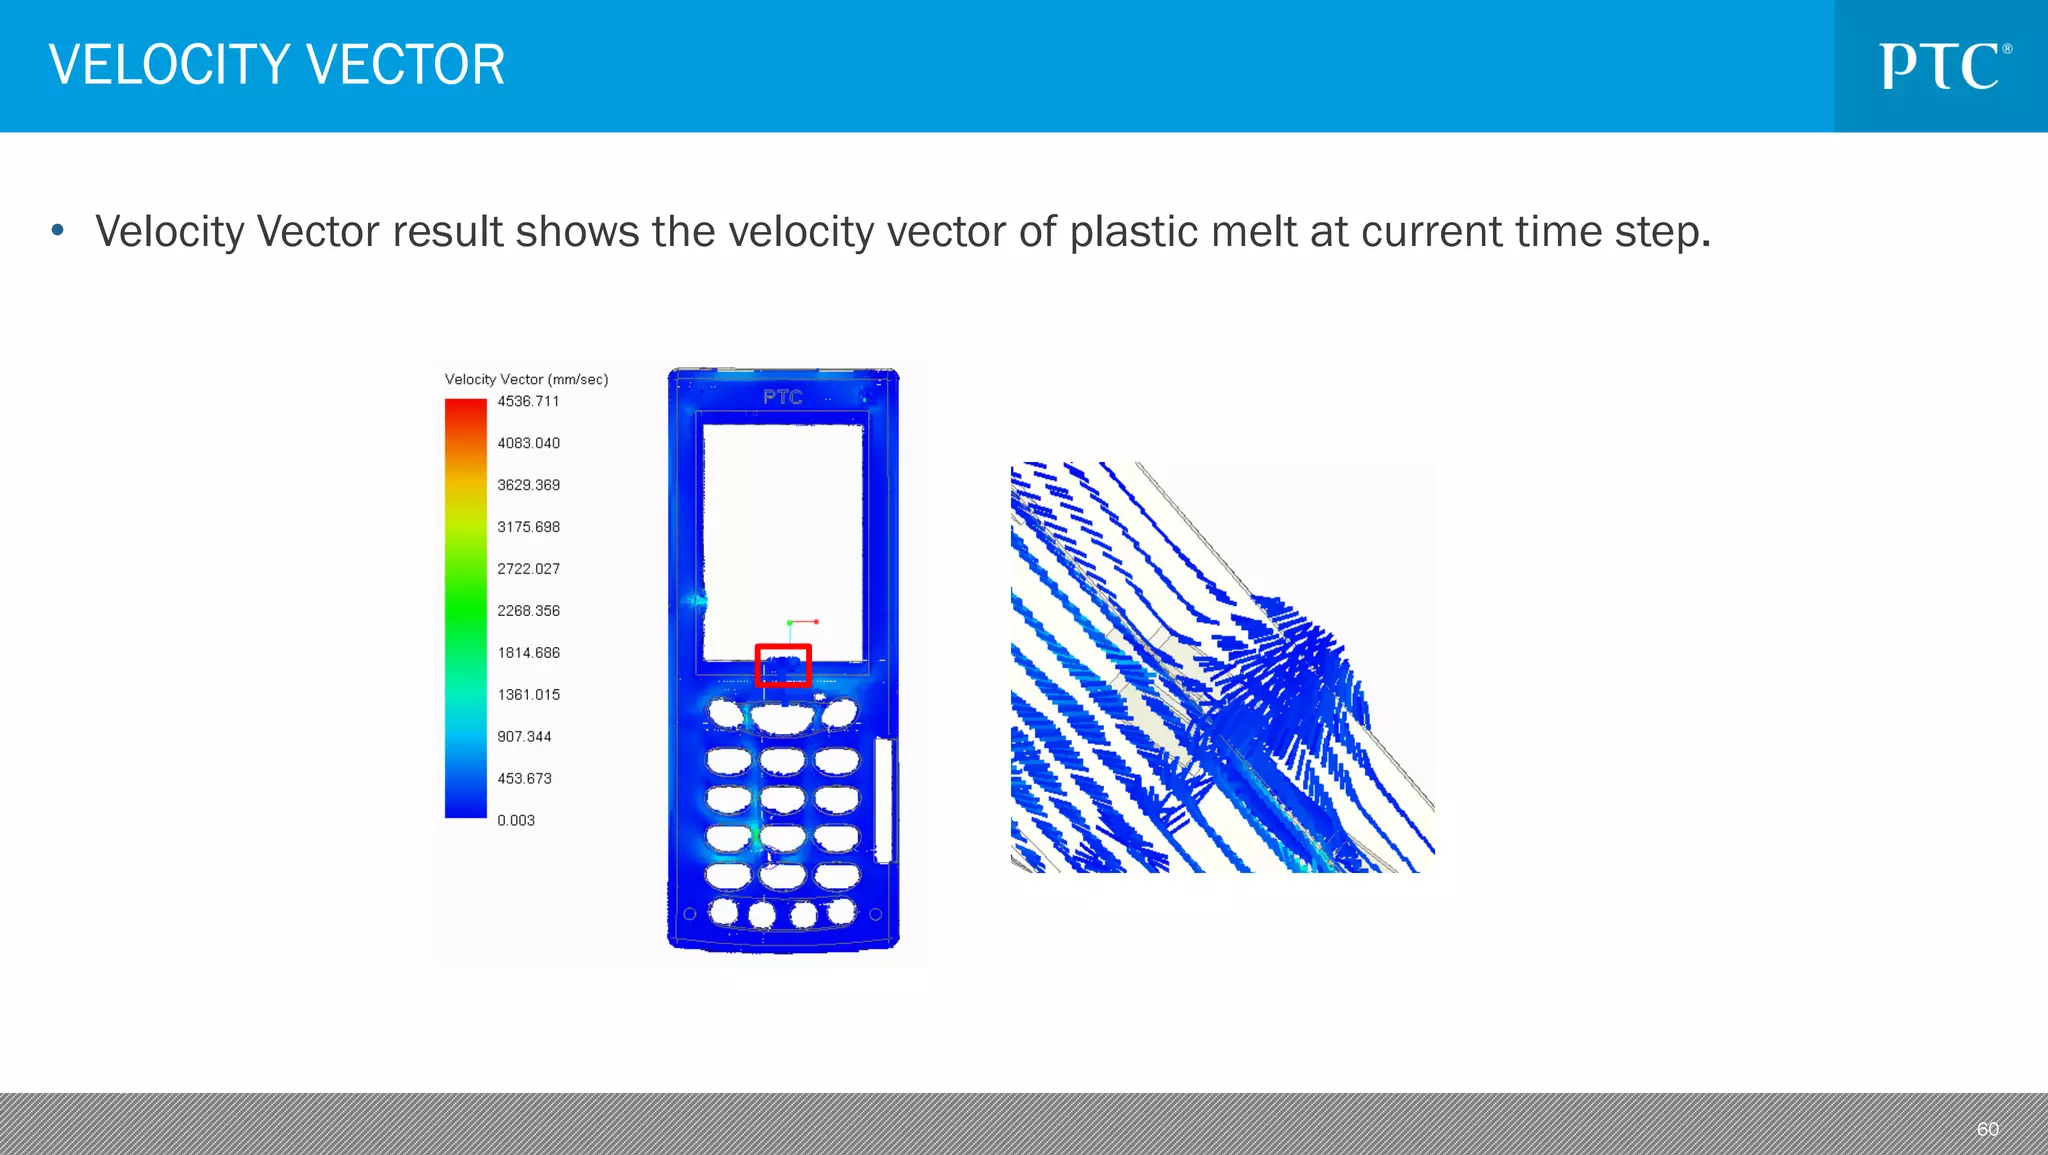
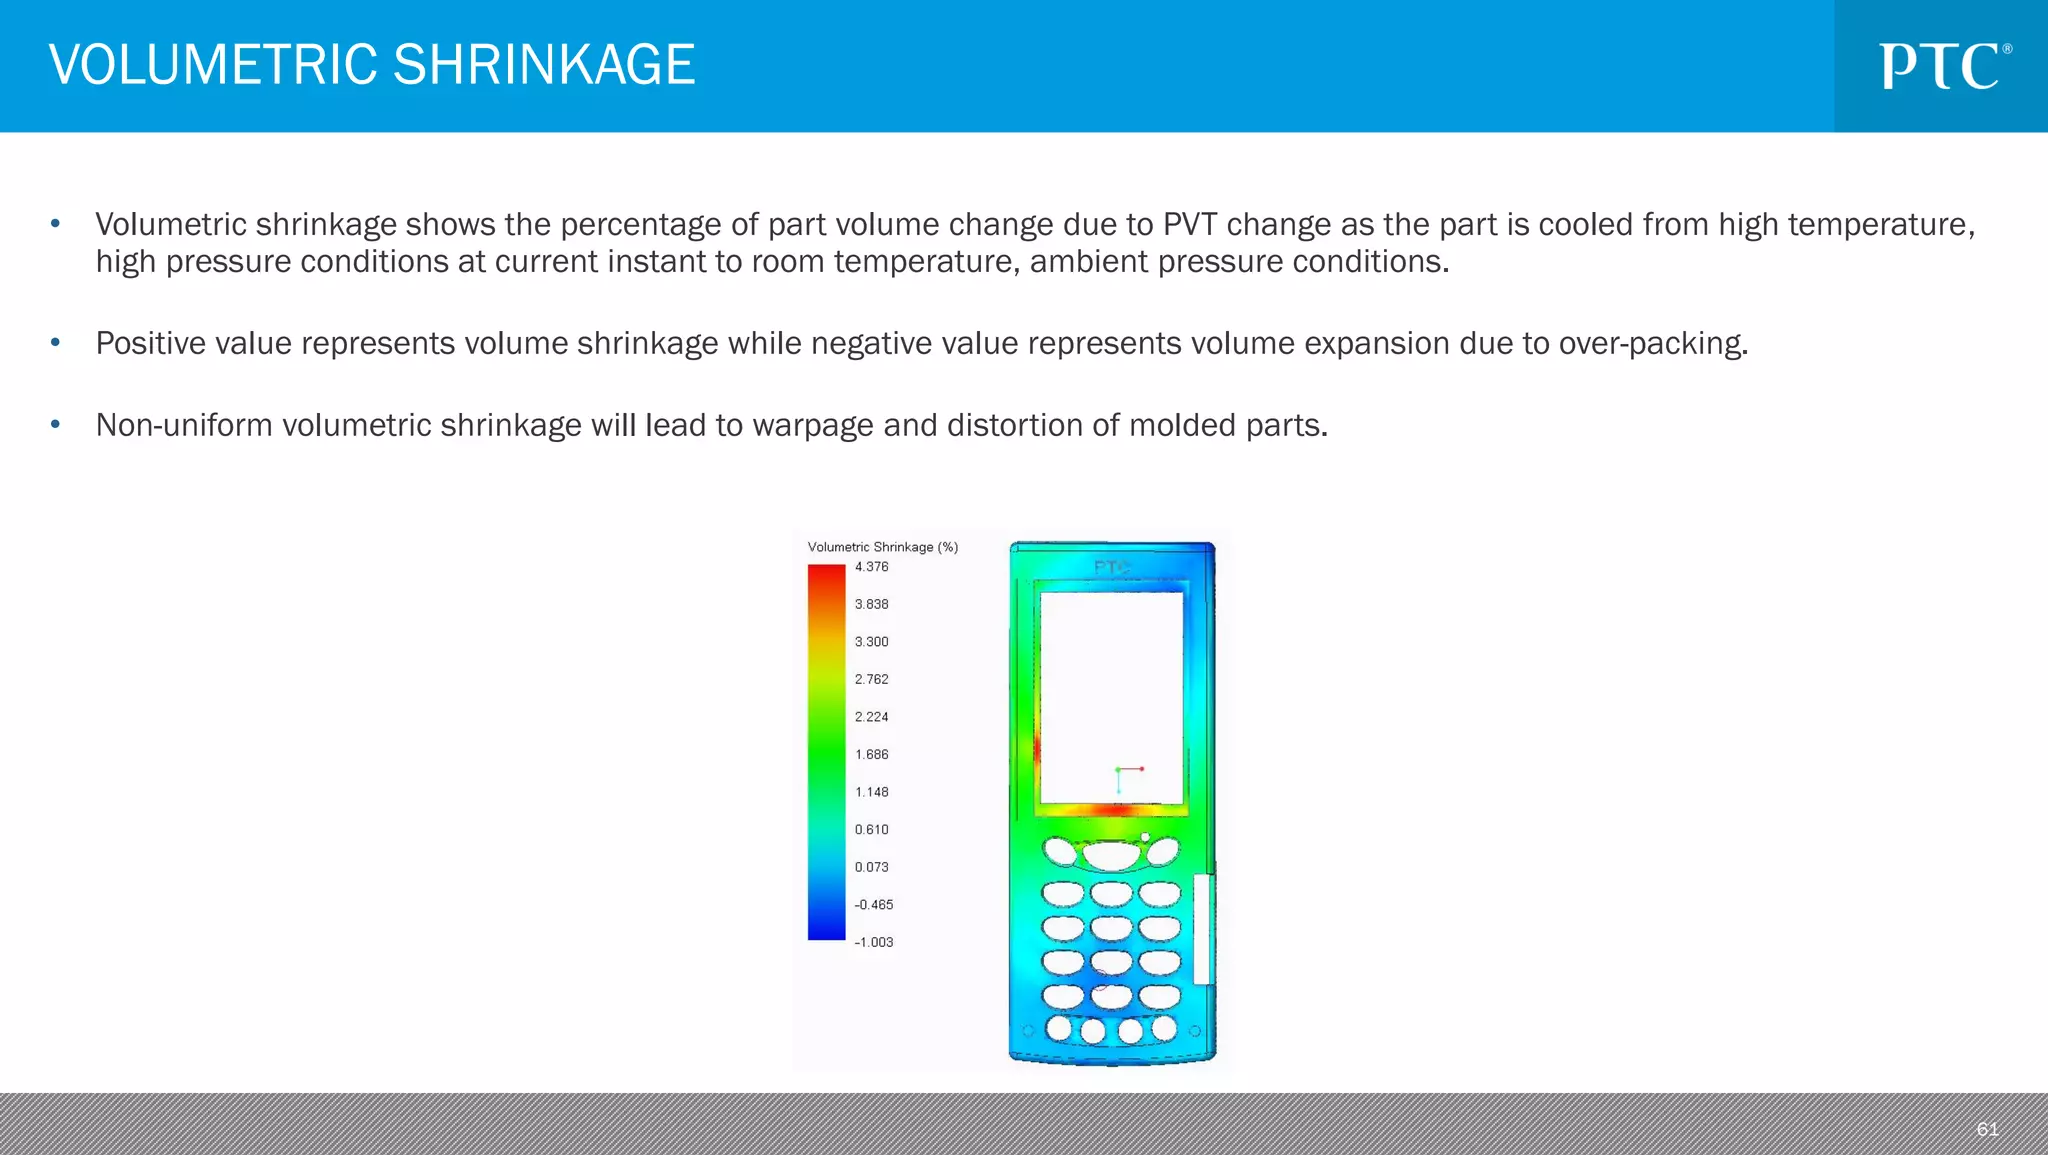
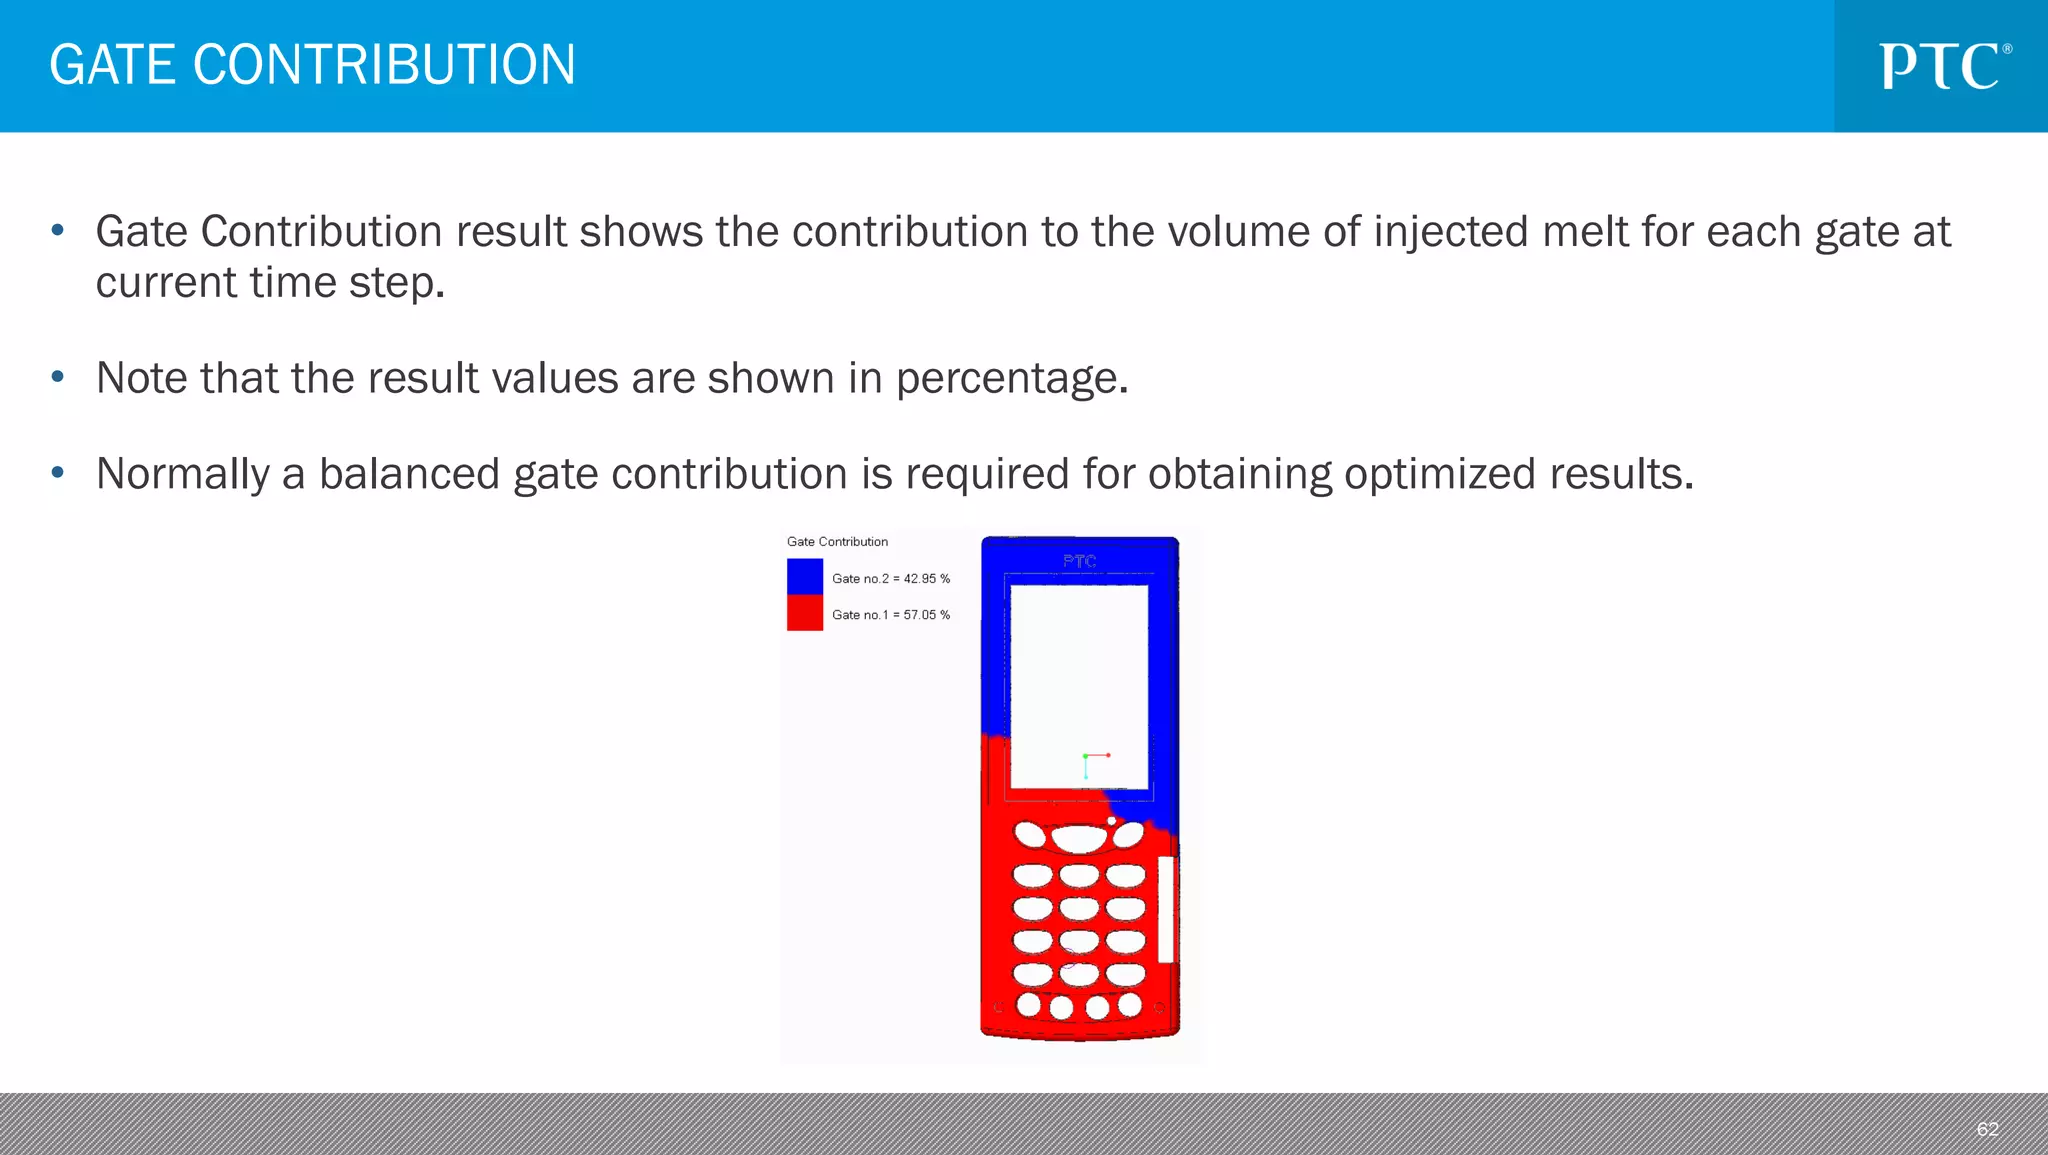
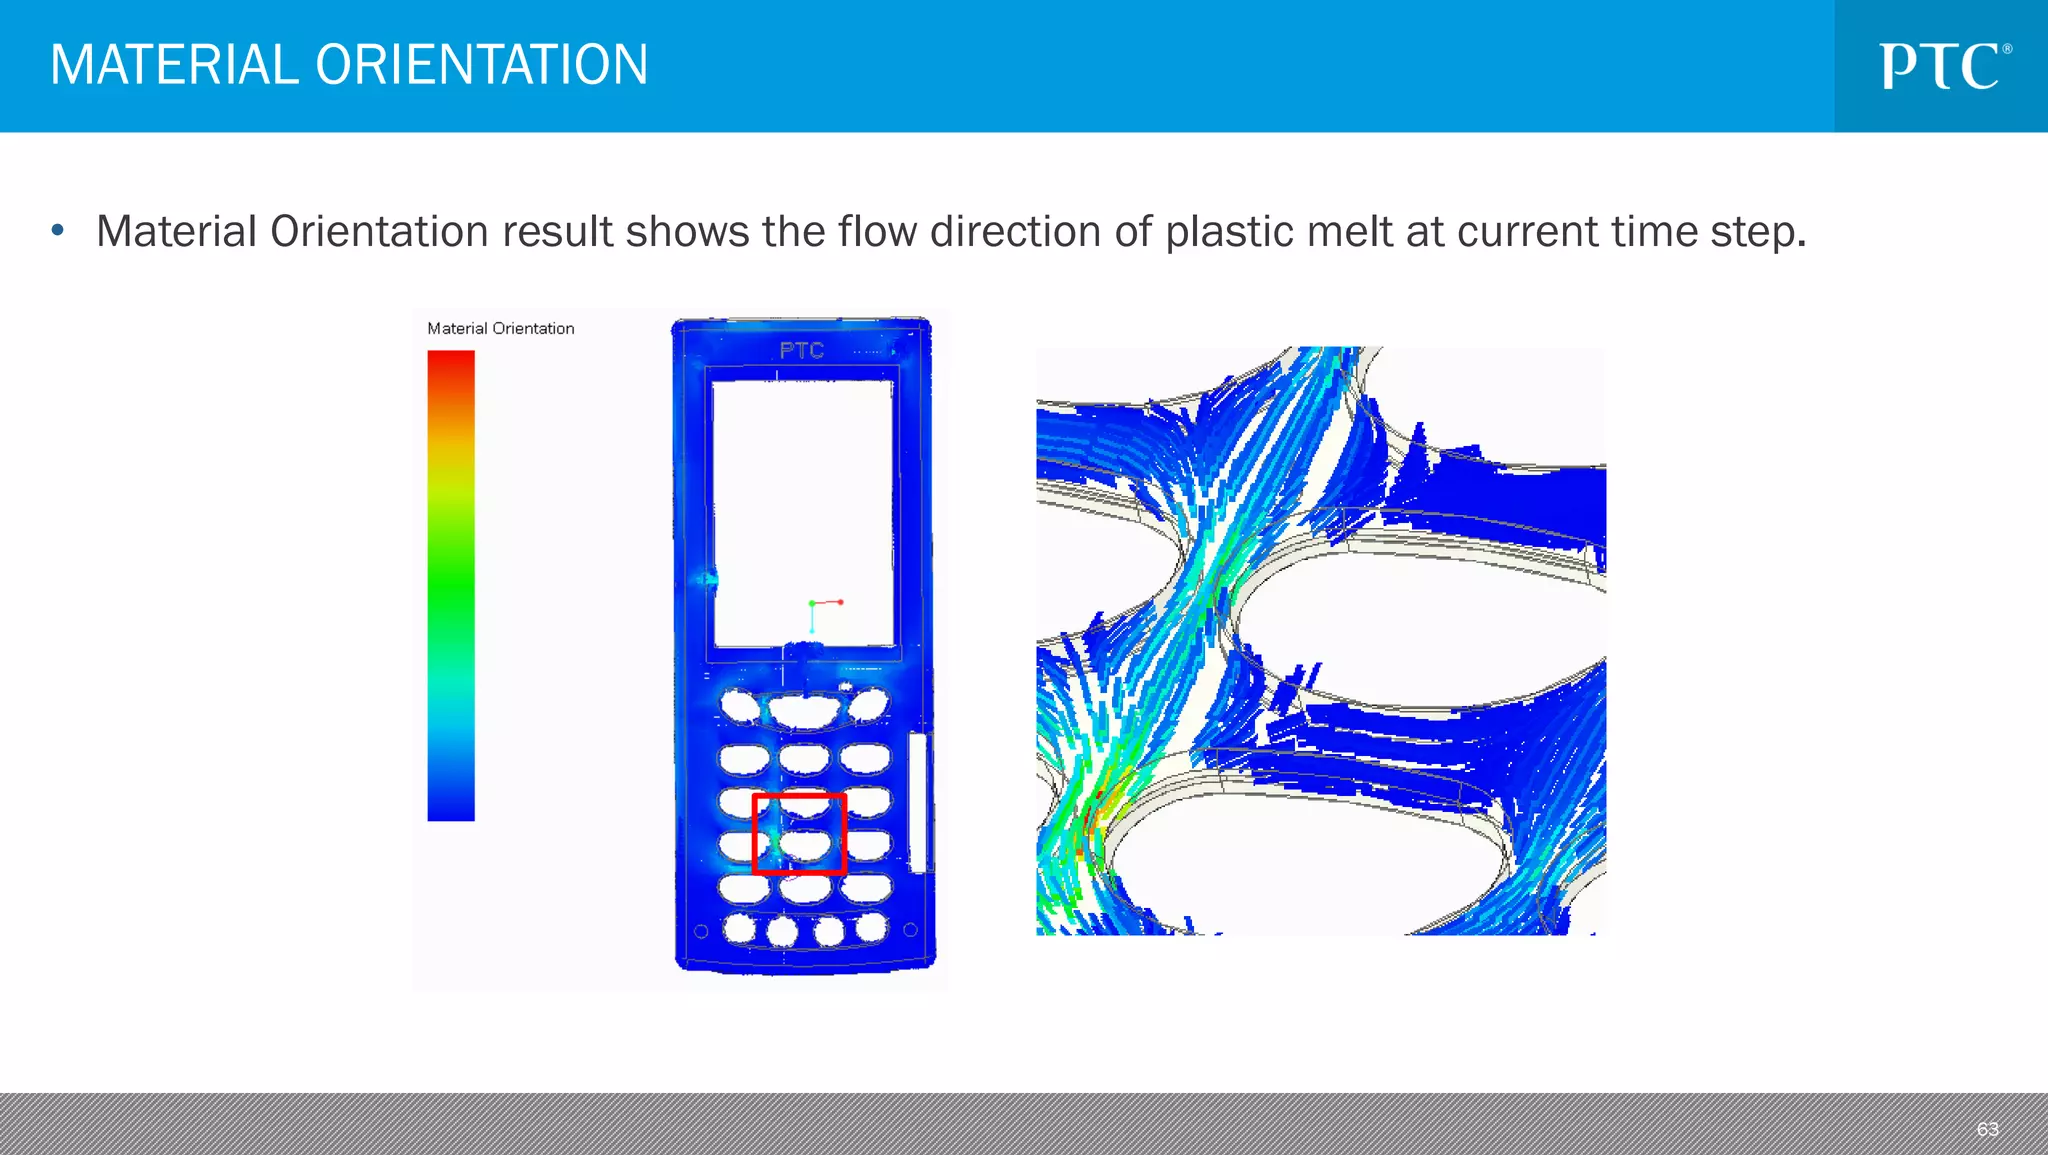
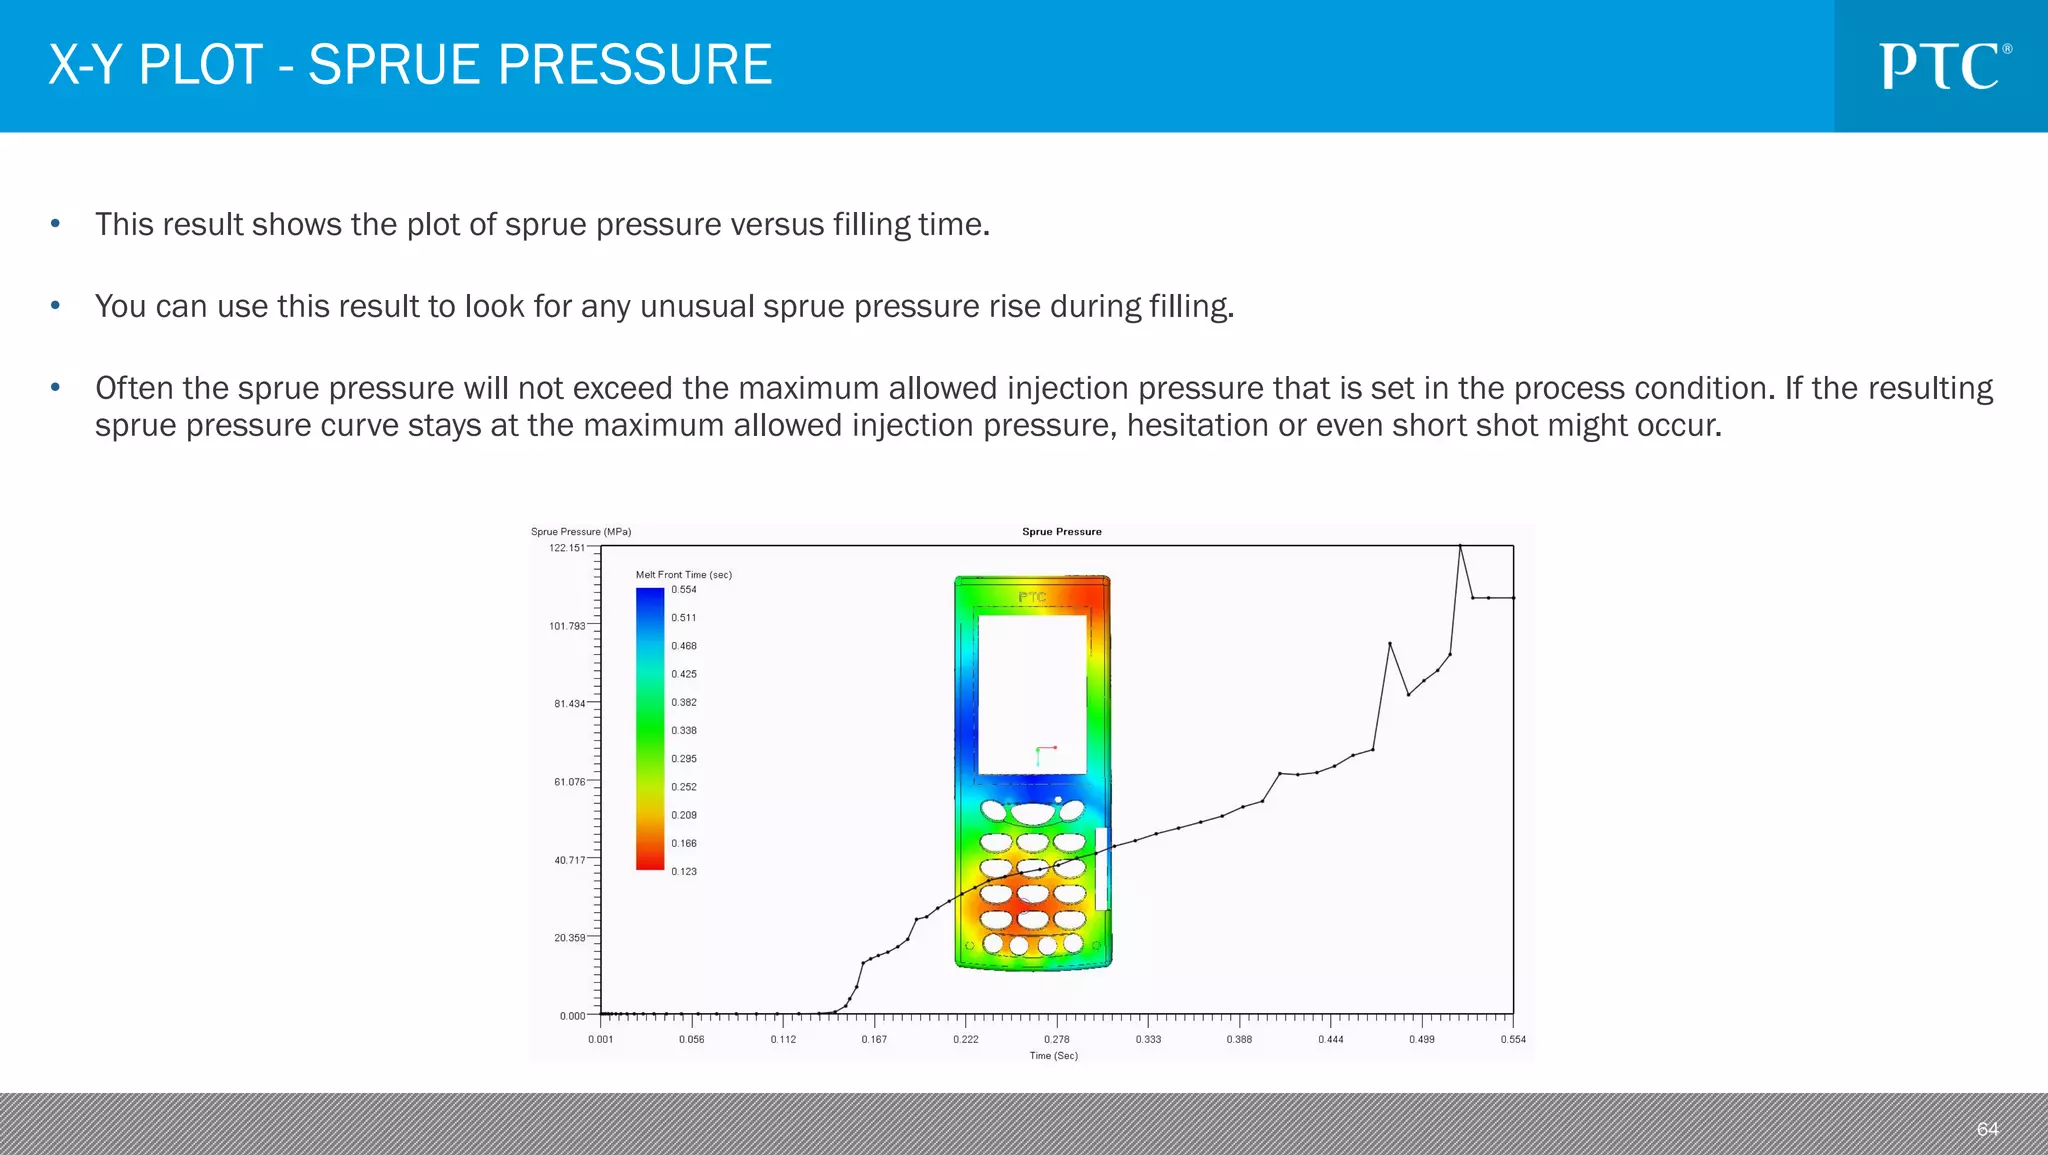
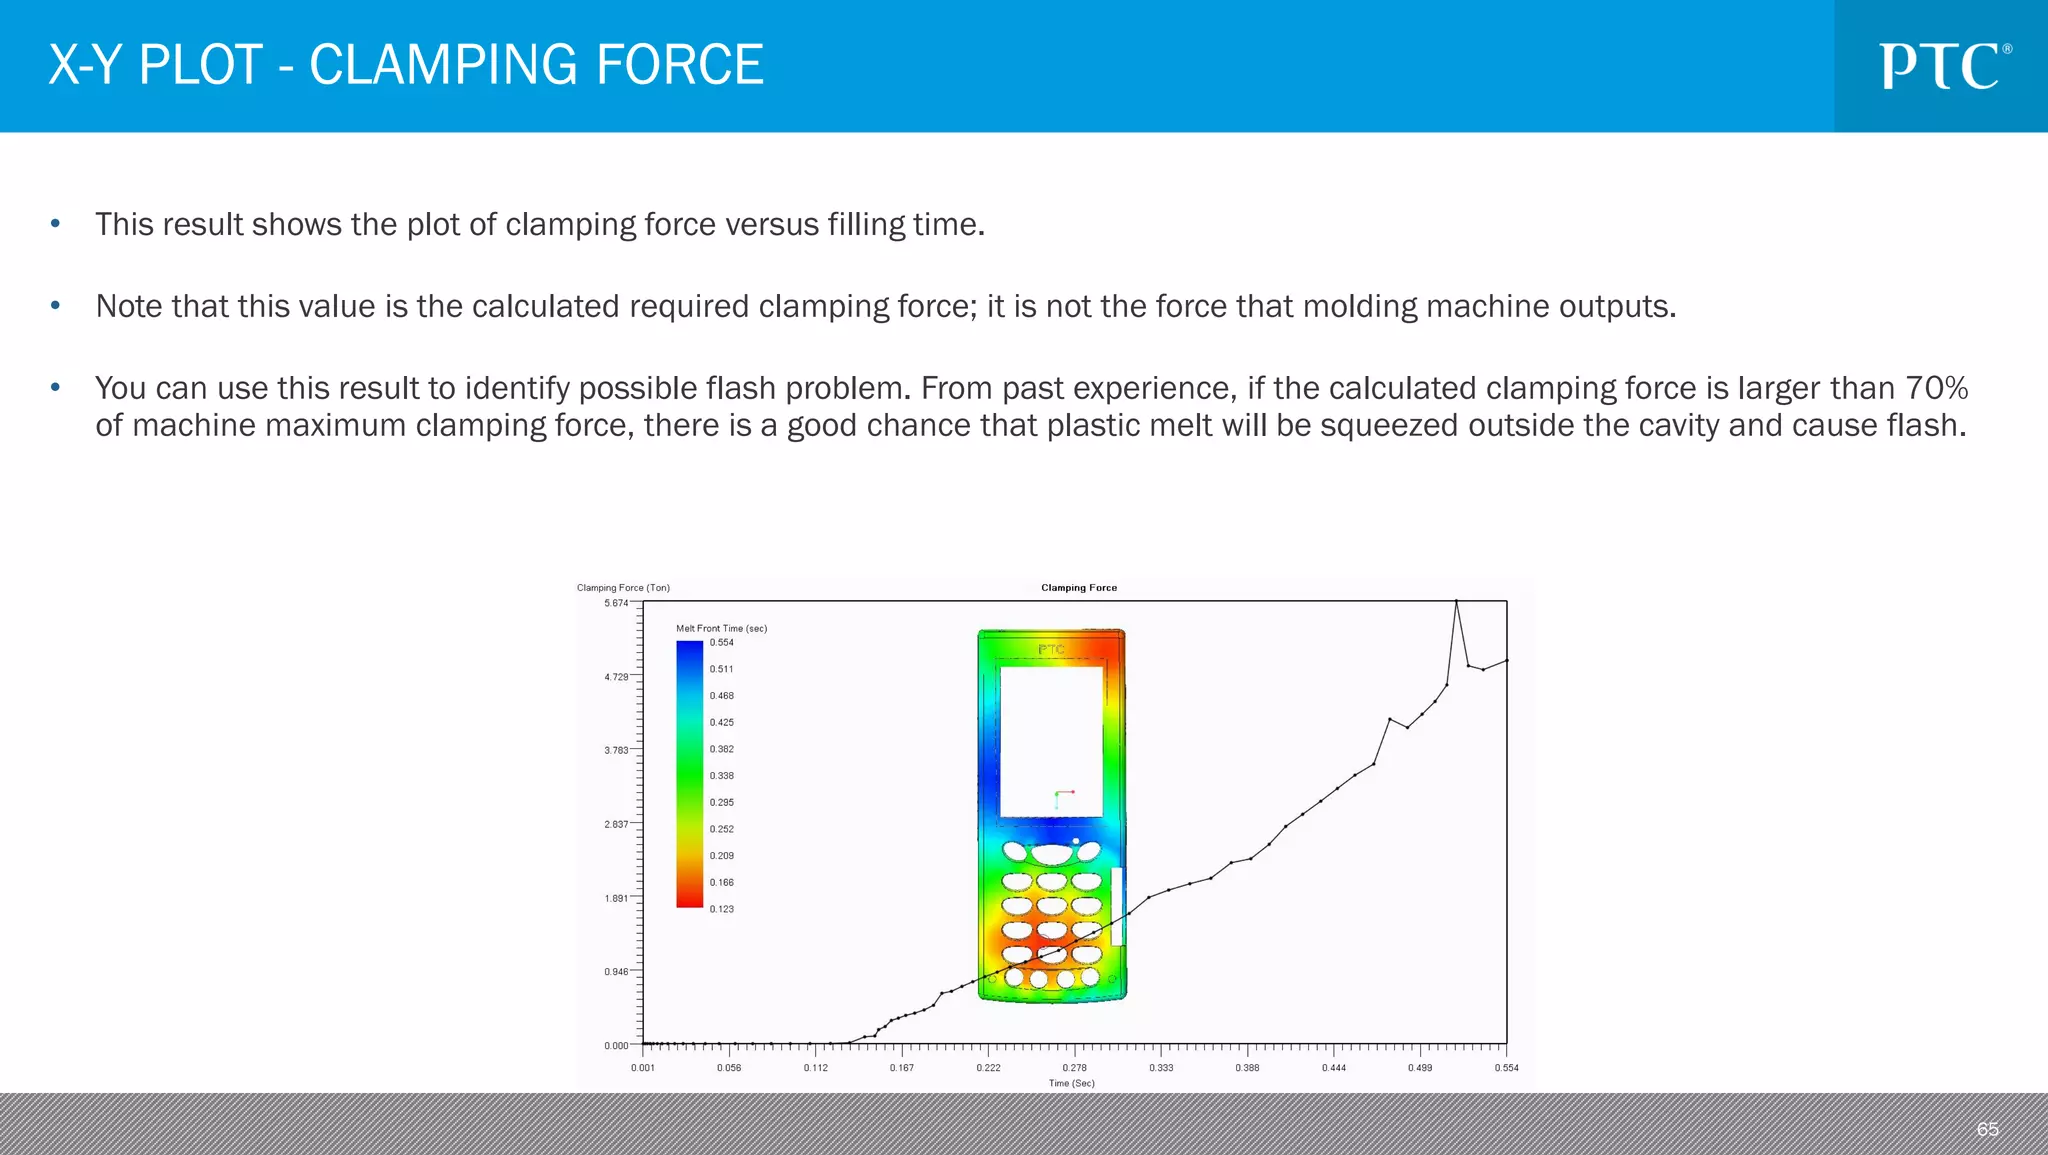
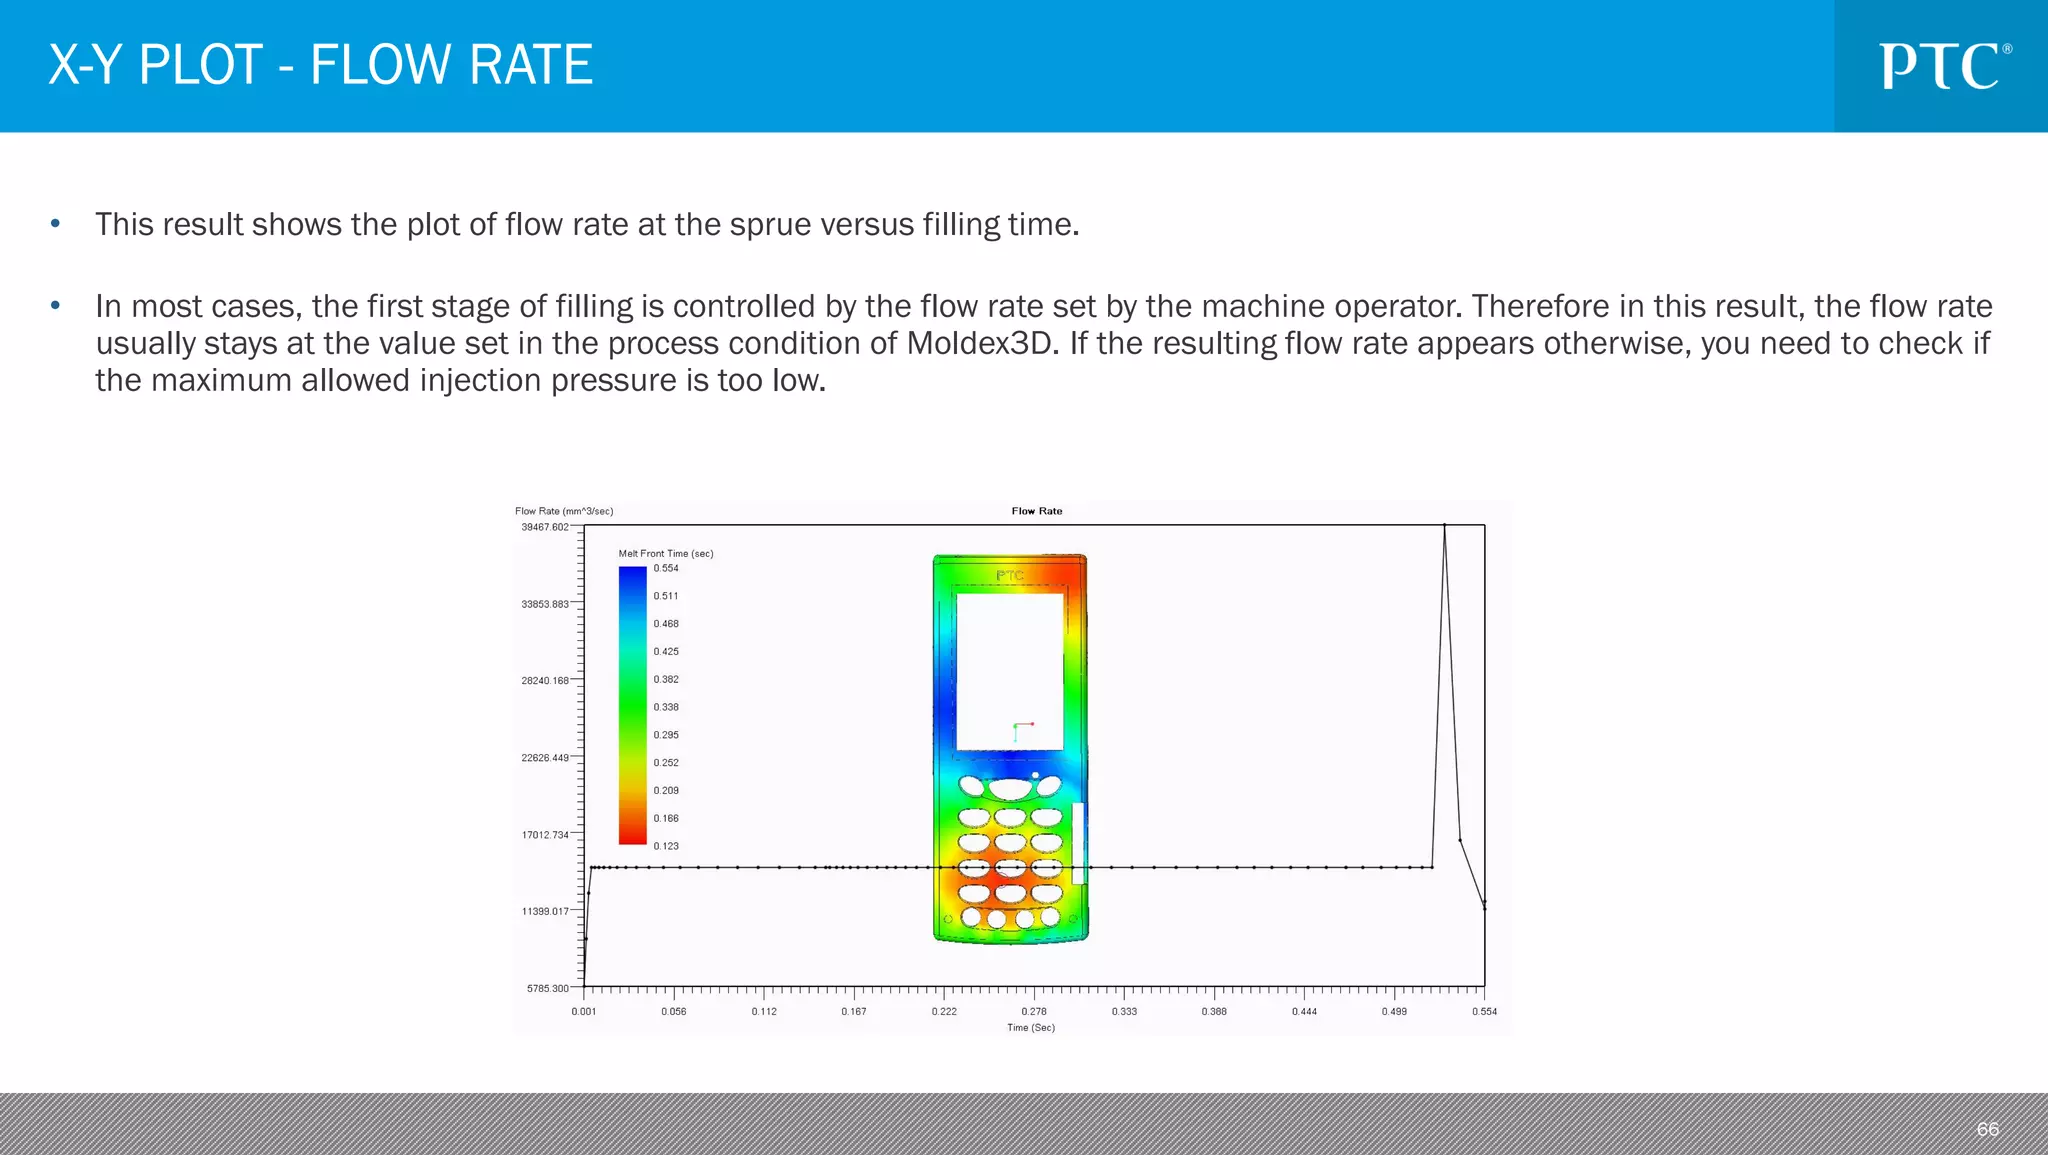
This document provides an overview of PTC's Creo Mold Analysis (CMA) software for injection molding simulation. It discusses injection molding processes, the CMA user interface and workflow, and provides a case study example of simulating a cell phone housing part. Key aspects covered include assigning materials, setting up gates and analysis, reviewing results such as melt front time, air traps, weld lines, and sink marks. The document also summarizes Moldex3D's product portfolio for injection molding simulation and analysis.
GD&T is an international way of describing a part accurately. It is used widely in all manufacturing sectors for part dimensioning. This ppt contains basic overview of GD&T. The detailed version will be uploaded soon.
Design for Manufacturability Guidelines Every Designer should FollowDFMPro
Learn some important design for manufacturing guidelines for designing sheet metal parts and see how you can easily automate and configure the DFM review process in your organization so that you don’t a miss a single design guideline while designing your product. To know more visit http://dfmpro.geometricglobal.com/
Forwa is a local precise injection mould maker in Dongguan with 13 year experience, 3600 sq.m workshop, 150 workers, , ISO9001 and ISO4001 certified, 45 minutes to Shenzhen port, equiped with 20 injection machine for mold trials and part production.
Specialzing in: super high precision moulds and special moulds like insert mould,double injection moulds(2K injection mould), overmould, Unscrew injection mould for OA, House electronic application, Automobile and Communication etc industry.
COMPUTER AIDED PROCESS PLANNING (CAPP)KRUNAL RAVAL
Computer-aided process planning (CAPP) helps determine the processing steps required to make a part after CAP has been used to define what is to be made. CAPP programs develop a process plan or route sheet by following either a variant or a generative approach.
Fixture is a work holding and support device used in the manufacturing industry.
In this slide all the details of Fixture is given and one problem statement is also given to manufacture a Fixture.
"Chemicaliën: Opslag in bulk of in kleine verpakkingen?" - Presentatie See-da...Martijn Vandewalle
Chemicaliën en / of milieugevaarlijke producten zijn alom tegenwoordig in alle sectoren. Deze zijn verkrijgbaar in diverse opslagsystemen en verpakkingen (bulk, drum, IBC, ...). Maar welke verpakking is nu het beste? Deze keuze is niet vanzelfsprekend en is afhankelijk van enkele criteria. Deze presentatie bekijkt de pro's en contra's van elke verpakking om u te begeleiden bij u keuze.
Deze presentatie werd gegeven op de See-days 2017 door Dhr. Geert Denutte.
Injection molding methods design optimization simulation of plastic toy build...IAEME Publication
Mold flow simulation helps designers to see how their designs will be resulted after injection molding process without needing to do the Injection Molding process. The use of simulation
programs saves time and reduces the costs of the Molding system design. Injection molding design simulation holds an important role in analyzing the outcome of the design.
CAPINC Summer of Simulation Part 3: The 5 Things to do Before Showing Anyone ...CAPINC
In this presentation we look at five steps any engineer can do to make their FEA results more trustworthy and useful, based on CAPINC’s years of experience helping customers get better returns on their Simulation investments.
DFM (design for manufacturing) example bluestar mould - automotive mold ma...Huy Dickens
Bluestar Mould is located in Shenzhen, China and has more than 20 year experience in mold making and plastic part production.
Website: http://bluestar-mould.com
Giúp người học có cái nhìn tổng quan về trình tự thiết kế khuôn dập NX, từ đó cảm thấy tự tin hơn và có thể tự học hay tham gia các khóa học khuôn dập NX
The injection molding process itself is a complex mix of time, temperature and pressure
variables with a multitude of manufacturing defects that can occur without the right combination of
processing parameters and design components. Determining optimal initial process parameter
settings critically influences productivity, quality, and costs of production in the plastic injection
molding (PIM) industry. Up to now, most production engineers have used trial-and-error method to
determine initial settings for a number of parameters, including melt temperature, injection pressure,
injection velocity, injection time, packing pressure, packing time, cooling temperature, and cooling
time which depend on the engineers’ experience and intuition to determine initial process parameter
settings. However, the trial-and-error process is costly and time consuming.
DESING OF MOULD TOOL & COOLING CHANNEL OPTIMIZATION OF INDUSTRIAL HELMETIjripublishers Ijri
A Plastic Material Is Any of A Wide Range of Synthetic Or Semi-Synthetic Organic Solids That Are Moldable. Plastics
Are Typically Organic Polymers Of High Molecular Mass, But They Often Contain Other Substances. They Are Usually
Synthetic, Most Commonly Derived From Petrochemicals, But Many Are Partially Natural.
Molding Is The Process of Manufacturing By Shaping Liquid Or Pliable Raw Material Using A Rigid Frame Called A Mold
Or Matrix. This It May Have Been Made Using A Pattern Or Model of The Final Object.
Process optimization of pressure die casting to eliminate defect using cae so...eSAT Journals
Abstract
Die Casting is the manufacturing process by which a liquid material is pressurized in to the mould, which contains a hallow
cavity of the desired shape, and then molten metal is allowed to solidify. The solidified part is known as casting which is ejected
or broken out to complete the process. Objective in this project is to develop tools, dies and gating system. Identify defects such as
gas defects, shrinkage cavities, and mould material defects, pouring material defects, metallurgical defects etc. and take measures
to reduce flaws by using CAE software. To reduce the amount airs entrapped in the mould by changing the gating system, runner
and overflow location and optimize the gating system and process parameters for best quality product and improved productivity.
Defects can be formed easily at critical location during pressure die casting of aluminium alloy part. It has defective effect on the
casting. Mould filling and solidification process of a part was simulated using Z-cast software.
Key Words: Casting, HPDC, Z-cast, CAE Software, Simulation.
Design of ‘plastic injection mold’ for an ‘air vent bezel’ through flow analy...eSAT Journals
Abstract Designer's of plastic injection Molds need to study from this point of view, the type of Mold to be designed, the physical Mold orientation, the dimensions for each of the element in the Mold, the location of the gate, runner, requirement of insert, draft angle requirement, shrinkage factor, location of cooling channels. Design can also be simplified by using standardized parts of the mold such as ejector pins. By eliminating the obstruction to smooth flow of plastic a good of quality component can be achieved. The effort of this thesis work is to find out the nuances in the Plastic Injection Mold Design while borrowing the inputs from the Flow Analysis (CAE) conducted for the 'Air vent bezel' to study the behavior of the Melt during flow. The Mold Design would incorporate suitable checking to ensure the best quality product in terms of `defect-free’ output. This thesis work consist methodology of plastic injection molding process, material requirement, how to overcome weld mark, shrinkage etc to satisfactorily assemble the component. Keywords: Draft angle, Shrinkage, CAE, weld mark
Understanding printed board assembly using simulation with design of experime...Kiran Hanjar
Understanding PCB assembly using simulation with DOE approach
To assess the feasibility of process flow logic and relative impact of changing line configurations
It is aimed to identify constraints or bottlenecks and development of improvement strategies accordingly
By using DOE, the factors that are affecting the system’s efficiency are identified
Finally to improve the system’s overall performance
TECNOLOGIE OPEN SOURCE PER INDUSTRIA 4.0 - Code_Aster & Injection MoldingAndrea Pisa
Nello stampaggio ad iniezione dei polimeri (injection molding) la termica dello stampo riveste un ruolo fondamentale sulla qualità del pezzo prodotto. Lo stampo, oltre a conferire la forma, è progettato con un circuito di condizionamento utile a smaltire omogeneamente il calore necessario a far solidificare il pezzo mantenendo allo stesso tempo una temperatura superficiale sufficientemente alta da permettere lo scorrimento del polimero nella cavità. Durante l’avvio produzione lo stampo passa da temperatura ambiente alle condizioni di regime attraverso un transitorio che dura un certo numero di cicli di stampaggio non noto a priori, normalmente i pezzi prodotti in questa fase vengono scartati in quanto non conformi. In questo lavoro Code_Aster è stato utilizzato per ottimizzare un avvio produzione simulando l’evoluzione termica derivante da una serie di cicli di stampaggio a partire da una condizione di avvio definita. Lo script di simulazione è stato inoltre progettato per interfacciare Code_Aster con un file xml contenente i parametri con cui l’operatore può facilmente modificare le condizioni del ciclo produttivo (iniezione, raffreddamento ed estrazione), i parametri del circuito di condizionamento e tutte le condizioni geometriche al contorno. Il responsabile produzione, utilizzando questo script Code_Aster, sarà così in grado di individuare preventivamente i settaggi macchina migliori per ridurre i cicli necessari al raggiungimento della condizione stazionaria, risparmiando tempo e risorse. Lo sviluppo dello script prevederà l’accoppiamento indiretto delle superfici di condizionamento con una simulazione CFD eseguita su openFoam al fine di migliorare l’accuratezza dei risultati.
Fast & Easy Electronics Thermal ManagementSimScale
Cloud-based simulation offers engineers a powerful CFD tool to assess the key variables that influence cooling, airflow, and thermal efficiency for optimizing the thermal and energy performance of electronics components. Forwiz System. Co., Ltd. is a South Korean company specialized in the field of SDN (Software Defined Networks) and electronics cooling. This webinar showcases how Forwiz uses SimScale to optimize their designs, enabling quick and accurate early-stage simulation and electronics cooling analyses.
More SimScale resources on electronics cooling:
What Is Heat Transfer?: https://bit.ly/3tARTwa
What is CFD | Computational Fluid Dynamics?: https://bit.ly/3lwhrrj
What Are the Navier-Stokes Equations?: https://bit.ly/3qYSKVz
How To Calculate Heat Dissipation In Watts?: https://bit.ly/3s4cLeG
Episode 27 : Project Management Costs
Cost Method
1. If there is lack of information regarding the existing plant, investment cost can be estimated by using cost factor. It requires the existence of a process concept and the rough layout of the main equipment in order to determine the cost of the main processing unit.
Operating Cost
Consists of (a) Cost of raw material
Utility cost
Labour cost
Maintenance cost
Utility Cost
1. It is quantity based and consisted of electric power, steam and coolant consumption, heating media such as coal and other energy sources like hydrogen.
SAJJAD KHUDHUR ABBAS
Chemical Engineering , Al-Muthanna University, Iraq
Oil & Gas Safety and Health Professional – OSHACADEMY
Trainer of Trainers (TOT) - Canadian Center of Human
Development
Episode 27 : Project Management Costs
Cost Method
1. If there is lack of information regarding the existing plant, investment cost can be estimated by using cost factor. It requires the existence of a process concept and the rough layout of the main equipment in order to determine the cost of the main processing unit.
Operating Cost
Consists of (a) Cost of raw material
Utility cost
Labour cost
Maintenance cost
Utility Cost
1. It is quantity based and consisted of electric power, steam and coolant consumption, heating media such as coal and other energy sources like hydrogen.
You could be a professional graphic designer and still make mistakes. There is always the possibility of human error. On the other hand if you’re not a designer, the chances of making some common graphic design mistakes are even higher. Because you don’t know what you don’t know. That’s where this blog comes in. To make your job easier and help you create better designs, we have put together a list of common graphic design mistakes that you need to avoid.
White wonder, Work developed by Eva TschoppMansi Shah
White Wonder by Eva Tschopp
A tale about our culture around the use of fertilizers and pesticides visiting small farms around Ahmedabad in Matar and Shilaj.
Book Formatting: Quality Control Checks for DesignersConfidence Ago
This presentation was made to help designers who work in publishing houses or format books for printing ensure quality.
Quality control is vital to every industry. This is why every department in a company need create a method they use in ensuring quality. This, perhaps, will not only improve the quality of products and bring errors to the barest minimum, but take it to a near perfect finish.
It is beyond a moot point that a good book will somewhat be judged by its cover, but the content of the book remains king. No matter how beautiful the cover, if the quality of writing or presentation is off, that will be a reason for readers not to come back to the book or recommend it.
So, this presentation points designers to some important things that may be missed by an editor that they could eventually discover and call the attention of the editor.
Between Filth and Fortune- Urban Cattle Foraging Realities by Devi S Nair, An...Mansi Shah
This study examines cattle rearing in urban and rural settings, focusing on milk production and consumption. By exploring a case in Ahmedabad, it highlights the challenges and processes in dairy farming across different environments, emphasising the need for sustainable practices and the essential role of milk in daily consumption.
Transforming Brand Perception and Boosting Profitabilityaaryangarg12
In today's digital era, the dynamics of brand perception, consumer behavior, and profitability have been profoundly reshaped by the synergy of branding, social media, and website design. This research paper investigates the transformative power of these elements in influencing how individuals perceive brands and products and how this transformation can be harnessed to drive sales and profitability for businesses.
Through an exploration of brand psychology and consumer behavior, this study sheds light on the intricate ways in which effective branding strategies, strategic social media engagement, and user-centric website design contribute to altering consumers' perceptions. We delve into the principles that underlie successful brand transformations, examining how visual identity, messaging, and storytelling can captivate and resonate with target audiences.
Methodologically, this research employs a comprehensive approach, combining qualitative and quantitative analyses. Real-world case studies illustrate the impact of branding, social media campaigns, and website redesigns on consumer perception, sales figures, and profitability. We assess the various metrics, including brand awareness, customer engagement, conversion rates, and revenue growth, to measure the effectiveness of these strategies.
The results underscore the pivotal role of cohesive branding, social media influence, and website usability in shaping positive brand perceptions, influencing consumer decisions, and ultimately bolstering sales and profitability. This paper provides actionable insights and strategic recommendations for businesses seeking to leverage branding, social media, and website design as potent tools to enhance their market position and financial success.
Hello everyone! I am thrilled to present my latest portfolio on LinkedIn, marking the culmination of my architectural journey thus far. Over the span of five years, I've been fortunate to acquire a wealth of knowledge under the guidance of esteemed professors and industry mentors. From rigorous academic pursuits to practical engagements, each experience has contributed to my growth and refinement as an architecture student. This portfolio not only showcases my projects but also underscores my attention to detail and to innovative architecture as a profession.
Unleash Your Inner Demon with the "Let's Summon Demons" T-Shirt. Calling all fans of dark humor and edgy fashion! The "Let's Summon Demons" t-shirt is a unique way to express yourself and turn heads.
https://dribbble.com/shots/24253051-Let-s-Summon-Demons-Shirt
Expert Accessory Dwelling Unit (ADU) Drafting ServicesResDraft
Whether you’re looking to create a guest house, a rental unit, or a private retreat, our experienced team will design a space that complements your existing home and maximizes your investment. We provide personalized, comprehensive expert accessory dwelling unit (ADU)drafting solutions tailored to your needs, ensuring a seamless process from concept to completion.
1. PTC CREO MOLD
ANALYSIS EXTENSION
Robin Wei (robinwei@moldex3d.com)
Russell J.H. Hsu (ruhsu@ptc.com)
September 2014
2. 2
• Injection Molding Processes
• Introduction to Creo Mold Analysis
• Case Study
• Moldex3D Product Portfolio
• Appendix A
• Appendix B
TABLE OF CONTENTS
5. 5
The melt passes through
different thickness areas
The 2 different gating scenario
INJECTION MOLDING PROCESSES
1.Hesitation
2.Race track phenomenon
3.Air-trap
4.Flow mark
5.Unbalanced flow pattern
7. 7
• Process Wide Mold Filling Simulation – Creo Mold Analysis
CMA OVERVIEW
Design part
Perform a
simulation with
CMA
Check
Result
Modify the
geometry or
process condition
MODELING SIMULATE
MODIFY
13. 13
GATE SETUP
1. Select “Gate Setup” 2. Select ”Add” and then click a
melt entrance position
14. 14
GATE SETUP (CONT’D)
3. Enter the gate diameter 4. Users can add new gate,
edit and delete existing
gate
15. 15
ANALYSIS SETUP
Select “Analysis setup” to set the process condition and mesh level
Filling time (sec.)
Filling time here is defined as the time required to fully
fill the cavity with “incompressible” material. Based on
cavity volume (part volume + cold runner volume) and
filling time, a given volumetric flow rate is forwarded to
Moldex3D Flow solver.
Melt Temperature (℃)
Melt temperature is the temperature of the plastic melt
at the melt inlet of the model.
Mold Temperature (℃)
Mold temperature is applied to the temperature
boundary condition between mold base and part. CMA
assumes that the boundary temperature distribution is
uniform.
16. 16
ANALYSIS SETUP
Select “Analysis setup” to set the process condition and mesh level
If users calculate the max cooling time
and sink mark, the packing analysis
would be added into analysis process.
17. 17
ANALYSIS SETUP
Select “Analysis setup” to set the process condition and mesh level
Move slider can select from “Coarse” to “Fine” for
different mesh levels.
• The lower level means the fewer elements, which
speeds up the computation.
• The higher level means the more elements, which
contributes to more accurate computation result.
20. 20
REVIEW RESULT ADVISOR
Click “Results Advisor” to find the problem the model may have.
Short shot
Air trap
Air traps found inside the cavity.
This may cause voids or surface defect.
Degradation
The resultant melt temperature is more than the
maximum working temperature of the material.
Hesitation
The flow speed is too low in some regions in the
cavity causing flow hesitation. In extreme cases,
flow hesitation may lead to hesitation mark on the
model surface or even short shot.
Unbalanced gate contribution
The melt contribution for each gate is unbalanced.
Weld line
Sharp welding angles found at some places. Weld
lines may become visible.
Short shot
Model is incompletely filled at the end of filling.
Short shot may occur.
21. 21
REVIEW RESULT ADVISOR
Click the issues, the screen will
show the corresponding result
Click “Results Advisor” to find the problem the model may have.
Short shot
23. 23
CHECK ANALYSIS RESULTS - VIEW CONTROL
Choose the analysis result and click “View Control”
Clipping Function
To clip the present model to view result inside.
Slicing
Show single/multiple slicing plane.
Parameters
To define a clipping plane by entering the
equation of the plane
24. 24
CHECK ANALYSIS RESULTS - VIEW CONTROL
Isosurface
Show Isosurface on the model. The
values of every point on the isosurface
are the same.
Choose the analysis result and click “View Control”
Parameters
Define the value to display
25. 25
CHECK ANALYSIS RESULTS - VIEW CONTROL
Switch the Tab to “Legend” to change
the display limit of the legend bar
Choose the analysis result and click “View Control”
27. 27
SAVE AND RETRIEVE DATA
• Click “Save Project” to save CMA data as *.xedz file.
• To check the previously analyzed result, click “ Retrieve
Project” and load the *.xedz file that keeps the CMA data.
29. 29
• Dimension
– Length: 127 mm
– Width: 50 mm
– Height: 5 mm
– Average Thickness: 0.7 mm
• Materials
– PP Advanced Composites ATX-880N-1
• Processing Conditions
– Filling time: 0.54 Sec
– Melt temperature: 210°C
– Mold temperature: 50°C
CASE STUDY - CELL PHONE HOUSING
Product Information
30. 30
• Potential Problems
– Air Trap
– Degradation
– Unbalanced flow
– Welding line
ORIGINAL DESIGN – TWO GATES
Original Design – Two Gates located on the ends of the product
Gates
31. 31
• Length/Thickness Ratio
– The maximum L/T ratio reaches to 153.54
POTENTIAL PROBLEMS
Welding Line
The welding lines are aligned, forming a long
weak line on the center
32. 32
• Unbalanced flow
– There is a 13% difference between the contributions of each gate
POTENTIAL PROBLEMS
Sprue pressure
The maximum sprue pressure reaches to
76.78 MPa
34. 34
• Length/Thickness Ratio
– The maximum L/T ratio has been reduced from153.54 to 63.487
IMPROVEMENTS – LENGTH/THICKNESS RATIO
Original design Revised design
35. 35
• Unbalanced flow
– The gate contributions are even in the revised design
IMPROVEMENTS – UNBALANCED FLOW
Original design Revised design
36. 36
• Sprue pressure
– The maximum sprue pressure decreased by 29 MP in revised design
IMPROVEMENTS – SPRUE PRESSURE
37. 37
• Weld Line
– The number and length of weld lines decreased
– The weld line aren’t aligned
IMPROVEMENTS – WELD LINE
Original design Revised design
39. 39
Structure and Market Position
MOLDEX3D PRODUCT STRUCTURE
eDesign Basic
CMA
Creo
eDesign
eDesignSYNC
Creo
40. Design Verification
and PLM Integration
Optimized Part
Designs
Productivit
y Sophisticate process
Multi-Component Molding
Fiber Orientation
Valve gate control
Advanced hot runner
Conformal cooling
Product Life Cycle Efficiency
HPC / Remote Computing
Cooling time reduction
Accuracy
Sensor and measurement
Powerful post-processing
tools
Quality
Warpage prediction
Identify flow balance
Identify residual stress
Material degradation
Shrinkage prediction
Tooling Validation
Clamping force
Multi-Cavity flow balance
Runner balance
Injection pressure
Packing pressure
41. 01
Flow
Everything starts
from filling analysis
02
Pack
Shrinkage compensation,
minimize warpage effect
03
Cool
Efficient mold
temperature
management
04
Warp
Minimize part
deformation
for design accuracy
MCM
Precise multi-
component
molding analysis
Fiber
Predict fiber length and orientation to
obtain optimal designs and process
conditions
High Performance Computing
(HPC)
Enable parallel computing and cluster
speed up the analysis process
43. 43
INDICATORS
Indicators provide information and suggestions to optimize the analysis results:
-Automatic Gate Creation (Gate Location Indicator)
-Cooling Time Indicator
-L/t Indicator
Detail instruction will be shown in the following pages.
44. 44
• Number of gates – The gate counts
• Gate Direction – mold open direction (+/- X,Y,Z)
• Gate diameter – The diameter of gates (All the gates are the same)
• Click “Calculate” will calculate proper gates location.
• After calculation click “Apply” can add gate automatically
AUTOMATIC GATE CREATION
45. 45
• Flow Length / Thickness Ratio
• Legend Range Setting – slider can change Min. and Max. scale bar
L/T INDICATOR
46. 46
• Legend Range Setting – slider can change Min. and Max. scale bar
• Material Information – info of material
– Density (g/cm^3)
– Melt Temperature (℃)
– Mold Temperature (℃)
– Eject Temperature (℃)
– Heat Capacity (erg/g.K)
– Thermal Conductivity (erg/sec.cm.K)
COOLING TIME INDICATOR
48. 48
• Melt front is a position indicator as melt front boundary movement in different time duration in
the filling process.
• From the melt front advancement one can:
– Examine the filling pattern of the molding
– Check potential incomplete filling (short shot) problem
– Identify weld line locations
– Identify air trap locations
– Check gate contribution for runner balance
– Check proper gate location to balance flow and eliminate weldline.
MELT FRONT TIME
49. 49
• Air Trap result shows the possible locations that air trap could have occurred.
• Weld Line result shows the weld lines that indicate potential spots of weaker structure. The
darker the weld line, the weaker the structure.
AIR TRAP & WELD LINE
50. 50
• Sink Mark Indicator is the index to evaluate the packing effect.
• Positive value indicates that the packing is not enough, which it may lead to sink mark. Negative
value indicates over-packing.
• An optimized packing result will have sink mark indicator close to zero.
SINK MARK INDICATOR
52. 52
• Pressure distribution of the cavity is shown in different colors at current instant. Based on the
pressure drop and distribution, users can revise the part and mold design.
• From the pressure distribution one can:
– Check the pressure transmission situation
– Check runner system pressure drop
– Check flow balance of the design
– Avoid overpacking and flashing of melt
– Examine the extent of packing/holding.
PRESSURE
53. 53
• Plastic melt temperature distribution at current instant.
• For 3D calculation, the temperature distribution expresses temperatures in all three
dimensional for the entire cavity.
TEMPERATURE
54. 54
• Center temperature result shows the center melt temperature in the thickness direction at
current time step.
• The center temperature is calculated by interpolating from the temperature values of the nodes
that forms the element at the center of the path along the thickness direction.
CENTER TEMPERATURE
55. 55
• Bulk temperature is the velocity-weighted average melt temperature in the thickness direction
at current time step.
• In general, bulk temperature distribution can reflect the trend of flow path and therefore the
actual path of pressure transmission.
BULK TEMPERATURE
56. 56
• This result shows the recorded peak value of shear stress of each element during the filling stage. Note that the maximum shear
stress values shown in this result are not necessarily in the same time step.
• You can use this result to determine if the maximum shear stress in the finished part will exceed the maximum allowed shear stress.
MAX. SHEAR STRESS
57. 57
• This result shows the recorded peak value of shear rate of each element during the filling stage. Note that the maximum shear rate
values shown in this result are not necessarily in the same time step.
• Shear rate is the rate of shear deformation of the material during the polymer processing. Shear rate distribution is related to the
variation of velocity gradient and molecular orientation. High shear rate tends to drastically deform molecular chains even to break
and then weaken the strength of product. Viscous heating due to high shear rate also should be noticed.
MAX. SHEAR RATE
58. 58
• Frozen Layer Ratio result shows the volume percentage of frozen plastic with respect to part thickness at current time step. This
value will reach 100% as time passes by.
• The picture and the equation below explain how frozen layer ratio is calculated.
• Where is the thickness of the upper frozen layer, is the thickness of the lower frozen layer, and is the thickness of the cavity.
FROZEN LAYER RATIO
59. 59
• Max. Volume Shrinkage shows the maximum volumetric shrinkage across the part thickness at
current time step.
• If this result shows locally high positive value, sink mark or void may appear on the finished part
depends on the thickness of frozen layer.
MAX. COOLING TIME
60. 60
• Velocity Vector result shows the velocity vector of plastic melt at current time step.
VELOCITY VECTOR
61. 61
• Volumetric shrinkage shows the percentage of part volume change due to PVT change as the part is cooled from high temperature,
high pressure conditions at current instant to room temperature, ambient pressure conditions.
• Positive value represents volume shrinkage while negative value represents volume expansion due to over-packing.
• Non-uniform volumetric shrinkage will lead to warpage and distortion of molded parts.
VOLUMETRIC SHRINKAGE
62. 62
• Gate Contribution result shows the contribution to the volume of injected melt for each gate at
current time step.
• Note that the result values are shown in percentage.
• Normally a balanced gate contribution is required for obtaining optimized results.
GATE CONTRIBUTION
63. 63
• Material Orientation result shows the flow direction of plastic melt at current time step.
MATERIAL ORIENTATION
64. 64
• This result shows the plot of sprue pressure versus filling time.
• You can use this result to look for any unusual sprue pressure rise during filling.
• Often the sprue pressure will not exceed the maximum allowed injection pressure that is set in the process condition. If the resulting
sprue pressure curve stays at the maximum allowed injection pressure, hesitation or even short shot might occur.
X-Y PLOT - SPRUE PRESSURE
65. 65
• This result shows the plot of clamping force versus filling time.
• Note that this value is the calculated required clamping force; it is not the force that molding machine outputs.
• You can use this result to identify possible flash problem. From past experience, if the calculated clamping force is larger than 70%
of machine maximum clamping force, there is a good chance that plastic melt will be squeezed outside the cavity and cause flash.
X-Y PLOT - CLAMPING FORCE
66. 66
• This result shows the plot of flow rate at the sprue versus filling time.
• In most cases, the first stage of filling is controlled by the flow rate set by the machine operator. Therefore in this result, the flow rate
usually stays at the value set in the process condition of Moldex3D. If the resulting flow rate appears otherwise, you need to check if
the maximum allowed injection pressure is too low.
X-Y PLOT - FLOW RATE