
Recommended
Recommended
More Related Content
What's hot
What's hot (20)
Viewers also liked
Viewers also liked (19)
Similar to Sample Moldflow Analysis Report For Automotive Part
Similar to Sample Moldflow Analysis Report For Automotive Part (20)
Recently uploaded
Recently uploaded (20)
Sample Moldflow Analysis Report For Automotive Part
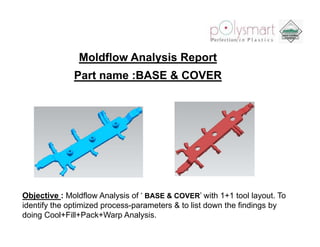
- 1. Moldflow Analysis Report Part name :BASE & COVER Objective : Moldflow Analysis of ‘ BASE & COVER’ with 1+1 tool layout. To identify the optimized process-parameters & to list down the findings by doing Cool+Fill+Pack+Warp Analysis.
- 2. Who We Are www.polysmart.com
- 3. Project Details Product : BASE & COVER Material : PA6 – 20% Glass-filled. Grade : Akulon K222-KGV4(DSM) Processing Conditions : Mold temperature – 80O C Melt temperature – 262O C Injection time – 2s Objective : Moldflow Analysis of ‘BASE & COVER with 1+1 tool layout. To BASE COVER’ layout identify the optimized process-parameters & to list down the findings by doing Cool+Fill+Pack+Warp Analysis.
- 4. Feed System Details COVER BASE Hot sprue details Dia: - 10mm Height - 60mm Runner details Top Width: – 6.0mm Runner details Bottom Width: - 4.0mm Top Width: – 5.0mm Height: - 4 5mm 4.5mm Bottom Width: - 3.5mm Height: - 4.0mm Edge Gate details Width: - 5.0mm Depth: - 1.5mm
- 5. Feed System Details BASE COVER
- 6. Material Details Shear Rate Vs Viscosity Shear rate plot shows that when the shear rate is increased, the material flows easily. Increasing shear rate by gate dimensions and injection rate can help material to flow easily. PVT graph indicates that below 215° C melt temperature, packing pressure would not have much impact on shrinkage. PVT
- 7. Zone Plot Comments: The Zone plot gives us the idea of preliminary process-setting & then further it is optimized.
- 8. Process Parameters Packing Profile
- 10. Fill Time Plot Comments: Part is filling completely in 2.42s & with flow rate of 46CC/s.Minor imbalance is observed in the filling which can be neglected as it is not affecting the quality of the component. Overall Contour plot shows uniform spacing between the contour lines (95% of the component) which indicates that there is no flow related problem occurring during filling of the component.
- 11. Fill Time Interval Plot Fill @ 25% Fill @ 50% Plot Shows the Filling of the component at Fill @ 100% Fill @ 75% various intervals intervals.
- 12. Pressure At Injection Location 80.3Mpa 72Mpa Comments: Comments This plot shows pressure at injection location Packing press re sho s press re location. pressure given is initially 90% of filling pressure for 8s & then in 1s it decays to zero. Total packing given in 8+1=9s
- 13. Frozen Layer Fraction Comments: The plot shows the frozen layer fraction for the component, the component gets completely frozen in 20s.
- 14. Temperature At Flow Front During Cavity Filling Comments: This plot shows temperature flow front for the component. Rise in temperature observed is up to 2o C due to shear heating & drop in temperature is observed is up to 15o C (Melt temperature is 262oC).Therefore the flow front temperature range is within the acceptable limit.
- 15. Fiber Orientation Plot Comments: The plot shows the movement of fibers during the injection molding process, averaged over the thickness.
- 16. Volumetric Shrinkage At Ejection Comments : The Plot shows the volumetric shrinkage across the component. Higher values are observed in the thick walled areas marked in the plot. The volumetric shrinkage ranges in between 1.4% to 7.9%. *Volumetric shrinkage and the linear shrinkage are different.
- 17. Shear Rate Comments : The max shear rate value observed is 86591 1/s which is within the recommended limit of which is specified by Material Manufacturer.
- 18. Clamp Tonnage Plot Comments : Maximum clamp tonnage required is 224 tonnes based on the calculations done by Moldflow.
- 19. Air Trap Plot Comments : The observed air-trap can be vented out by providing air-vents in the mold. If proper venting is not provided at end of fill areas then it may lead to short shot or burn marks on the component.
- 20. Weldline Plot Comments : The temperature when weldline were formed is high (263.7°C), hence the weld strength will be good & area near the weldline will be structurally strong.
- 21. Sink Marks Plot Comments : Max sink marks depth observed is 0.04mm.As per the guidelines, for the normal surfaces the max limit is 0.04mm,if it exceeds the recommended limit then it will leave a visible mark onto the surface. In this case the values are just within the acceptable limit.
- 23. Cooling Circuit Efficiency Plot Circuit Coolant Circuit heat Temperature. removal Efficiency. Comments : The plot shows the cooling circuit efficiency.
- 24. Coolant Flow Rate & Reynolds Number. Coolant Flow-Rate. Circuit Reynolds Number. Comments : The plot shows the circuit flow rate & reynolds number.
- 25. Average Temperature Part. Comments : The Plot shows the average temperature of the part at the end of the cooling time. Higher values are observed in the thick walled areas which are marked in the plot.
- 26. Temperature Maximum Part. Comments : The plot shows the maximum temperature in the part at the end of the cooling time. The max temperature observed is 180°C which is just within the limit of Ejection temperature.
- 28. Deflection in X-Direction Component Shrinking inward. Deflection pattern is scaled 5 times to understand the shape of the component after deflection. Comments : Shrinkage observed in X- direction is (+0.73mm, -0.56mm).The observed shrinkage value is 0.96%. While setting the mould dimensions it is g g essential to note the shrinkage in that area. Please note that the calculated deflection value may not be the same as actual conditions. However, warpage results can be used to understand the deflection pattern of the component.
- 29. Deflection in Y-Direction Component Shrinking downwards Deflection pattern is scaled 5 times to understand the shape of the component after deflection. deflection Component Sh i ki C t Shrinking upwards Comments : Shrinkage observed in Y- direction is (+1.62mm, -1.74mm). The observed shrinkage value i 0 95% hi k l is 0.95%. Please note that the calculated deflection value may not be the same as actual conditions. However, warpage results can be used to understand the deflection pattern of the component.
- 30. Deflection in Z-Direction Component Warping Upward Component Warping Downward Component Warping Upward Deflection pattern is scaled 5 times to understand the shape of the component after deflection. Comments : Deflection observed in Z- direction is (+1.27mm, -0.74mm). Please note that the calculated deflection value may not be the same as actual conditions. However, warpage results can be used to understand the deflection pattern of the component.
- 31. Recommended Processing Parameters. Injection Time: - 2s Case1 Case2 (Optimized) Mold Temp 80°C Mold Temp 80°C Melt Temperature: - 262°C 262 C Melt Temp 260°C Melt Temp 262°C Mold Temperature: - 80°C V/P Switchover V/P Switchover Packing Profile: P ki P fil - 97% of Filling 96% of Filling Packing Pressure Packing Pressure 90% of Filling 90% of Filling Pressure. Pressure. Clamp Force 266T Clamp Force 224T Disclaimer: The analysis has been carried out as per the material database available in Moldflow. If the viscosity of the material differs than what is considered in database, the results would vary. i it f th t i l diff th h ti id di d t b th lt ld Polysmart accepts no responsibility for the results obtained on shop floor. The process conditions are simulated and the results obtained are reproduced in the report. ******************************************************************************
- 32. Conclusion Component gets filled completely with no flow related problem except minor flow imbalance, but that can be neglected as it is not affecting the quality of component. Weldlines in the component are formed at higher temperature (i e near to melt (i.e. temperature). This indicates that the area near weldlines will be structurally strong. In the sinkmark plot the max sink mark depth observed is around 0.04mm which is just within the recommended limit limit. Mold temperature & Melt temperature needs to be precisely control, to control sink marks. It is recommended t give sufficient draft for proper ejection of the component & i d d to i ffi i t d ft f j ti f th t to prevent the component sticking into the cavity. It recommended to give air-vents at the end of fill areas to prevent short shot or burn mark on th component. b k the t It is recommended, that if warpage in the molded component observed is high after molding then finally it is recommended to use cooling fixture to control warpage. warpage
- 33. POLYSMART TECHNOLOGIES PVT LTD LTD. 94,Bombay Talkies Compound, Shreenath Chambers, 3rd Floor, Malad (West) B-66 & 67, Gyaneshwar Paduka Chowk, Mumbai:- 400064 Ferguson College Road, India. Pune: - 411005. Tel:- +91-22-28824448, e 9 88 8, Tel: - +91-020-25520311 / 312 +91 020 25520311 312. +91-22-28823241,91-22-28813508. Fax:- +91-22-28820629 Website:- W b it www.polysmart.com l t Disclaimer: The analysis has been carried out as per the material database available in Moldflow. If the viscosity of the material differs than what is considered in database, the results would vary. Polysmart accepts no responsibility for the results obtained on shop floor. The process conditions are simulated and the results obtained are reproduced in the report. ******************************************************************************