This document discusses conditions for performing a chi-square goodness-of-fit test and chi-square test for homogeneity. The chi-square goodness-of-fit test requires that all expected counts be greater than 5. The chi-square test for homogeneity can be used to compare distributions across multiple groups, requires random sampling and independence of observations, and that expected counts be at least 5. The document provides an example comparing wine purchases with different music, calculates the chi-square statistic, and interprets the p-value to determine if distributions differ.
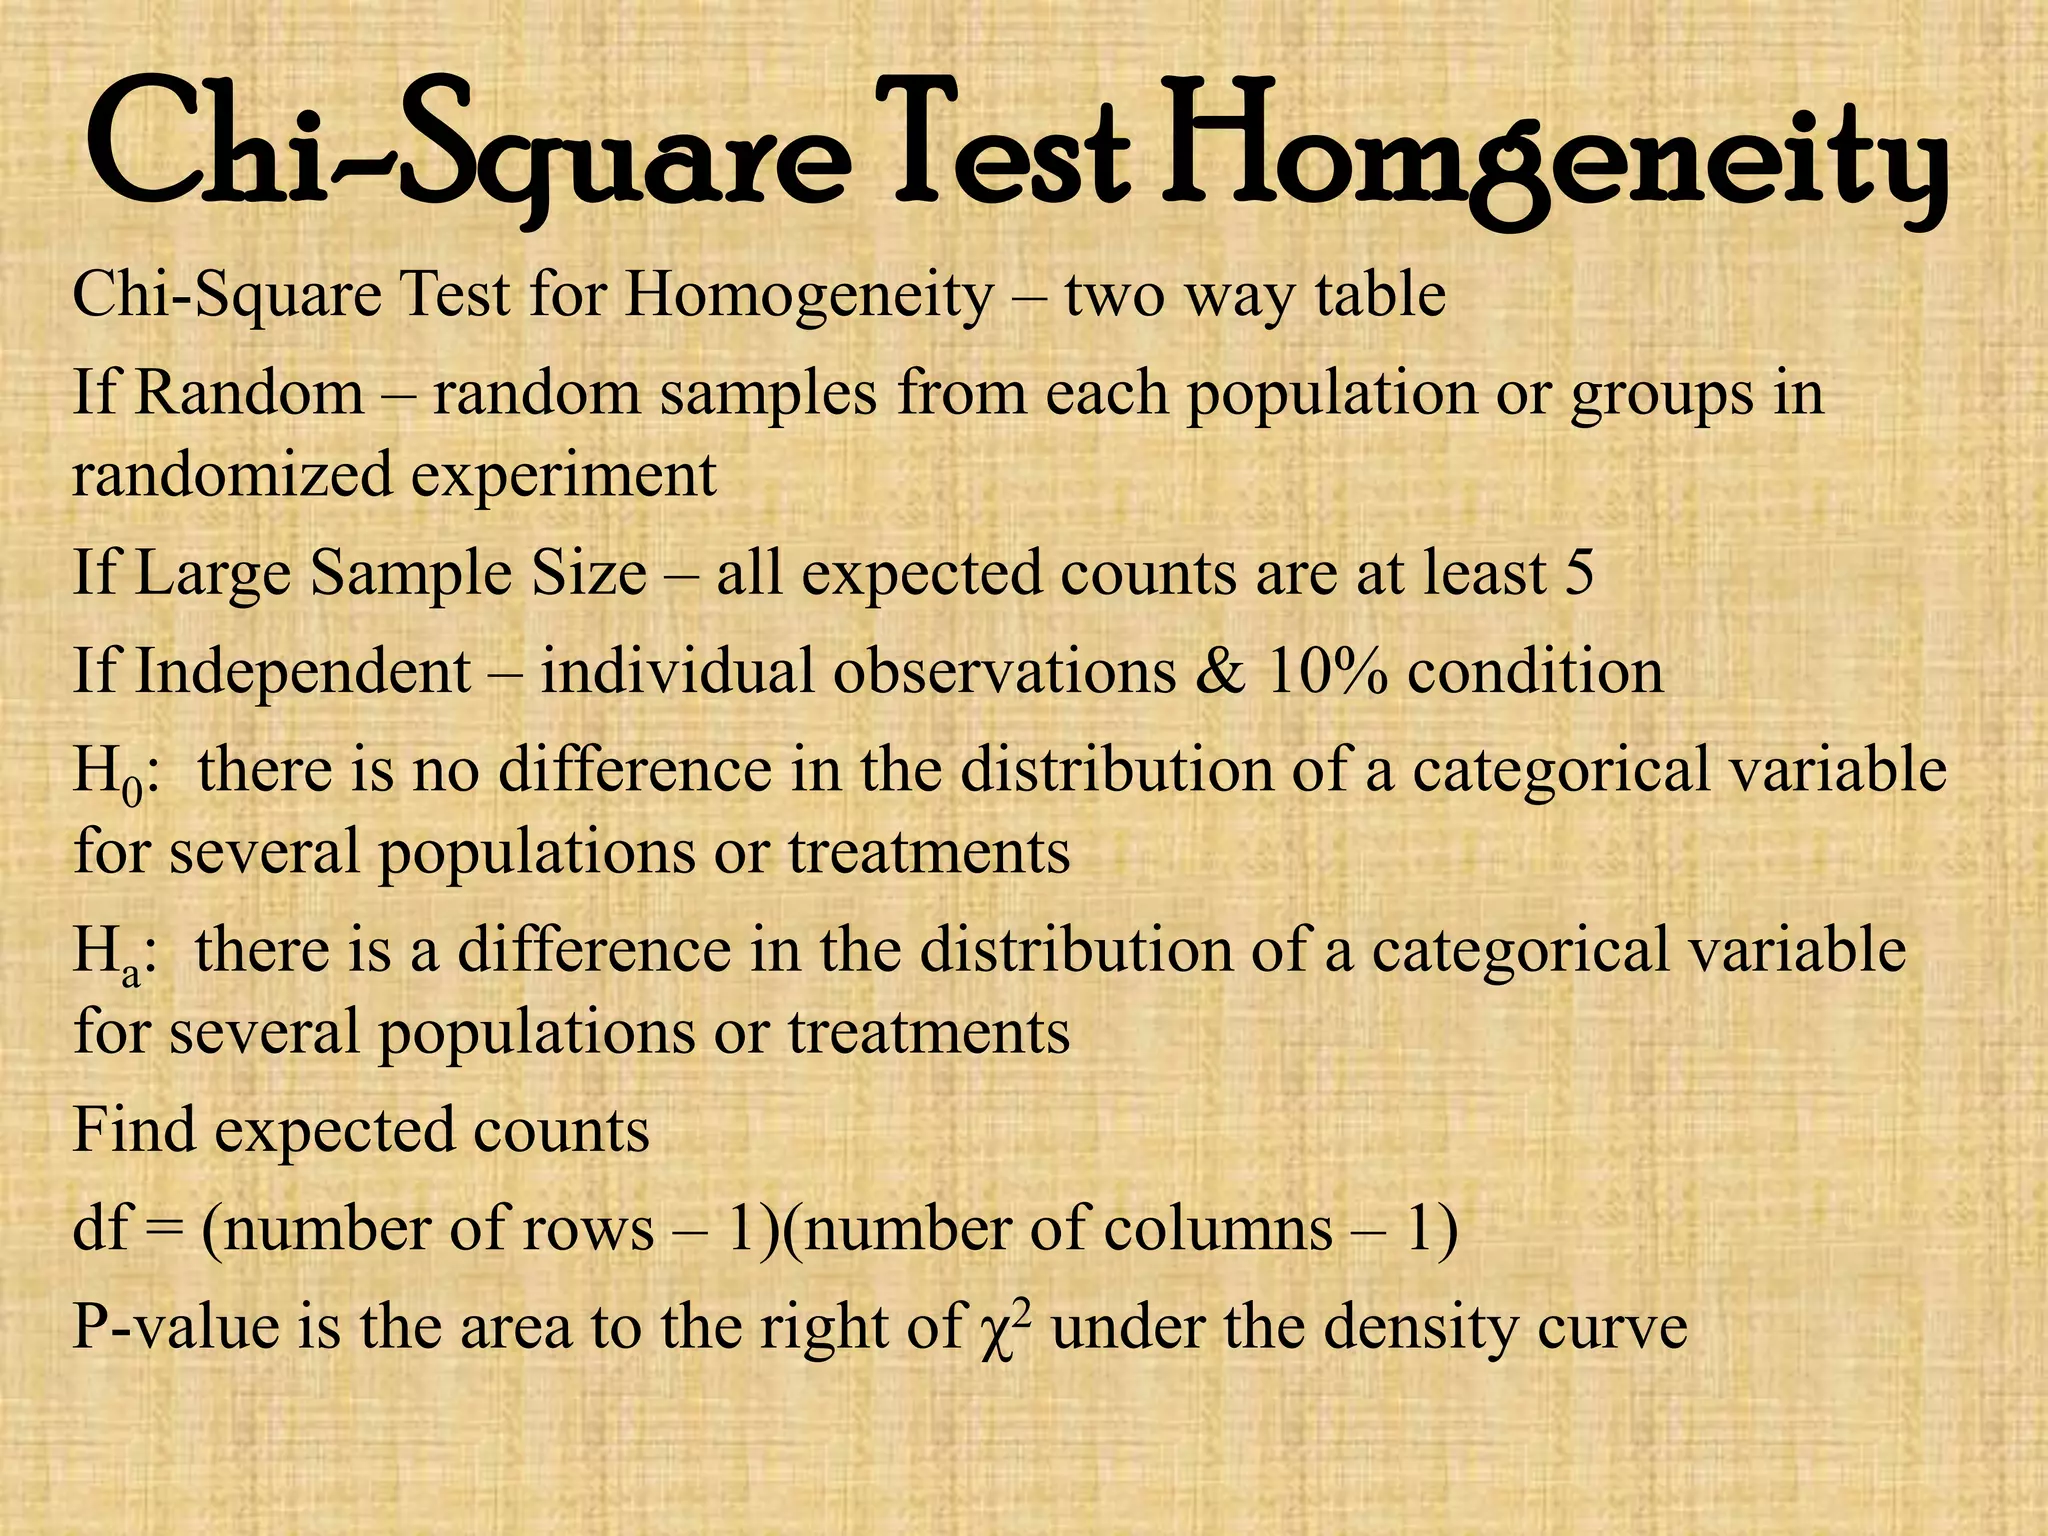
T-distribution is the most famous theoretical probability distribution in continuous family of distributions. T distribution is used in estimation where normal distribution cannot be used to estimate population parameters. Copy the link given below and paste it in new browser window to get more information on T distribution:- http://www.transtutors.com/homework-help/statistics/t-distribution.aspx
A Marketing Analysis of Four Brands of Watches: HMT, Titan, Swatch, TAG HeuerDr. Asokendu Samanta
Preface: Time is Money. With the advent of new technology, a revolutionary change is occurred in the watch market of India. Previously only a few brands were ruling the market. However with the passage of time and with the opening of free trade, there is no dearth of various national and international brands in the market. A few years ago, people used to buy watch, only to check time. However, now they buy not only to check time but also for fashion.
In the present report an attempt has been made to analyze the four brands of the watch namely, HMT and Titan of India and Swatch and Tag Heuer of Switzerland. SWOT analyses of the each brand are presented in evaluating their prospect in Indian market.
The first chapter deals with HMT, one of the national brands of India. In the second chapter, various aspects of Titan, the market leader of India are presented. Third and fourth chapters deal with international brands, Swatch and Tag Heuer respectively. Emphasis is given particularly to analyze the advertisements of each brand, identifying what marketers are trying to achieve. At the end, conclusions are drawn in chapter five summarizing various critical aspects.
Please put answers below the boxes1) A politician claims that .docxLeilaniPoolsy
Please put answers below the boxes
1)
A politician claims that he is supported by a clear majority of voters. In a recent survey, 35 out of 51 randomly selected voters indicated that they would vote for the politician. Use a 5% significance level for the test. Use Table 1.
a.
Select the null and the alternative hypotheses.
H0: p = 0.50; HA: p ≠ 0.50
H0: p ≤ 0.50; HA: p > 0.50
H0: p ≥ 0.50; HA: p < 0.50
b.
Calculate the sample proportion. (Round your answer to 3 decimal places.)
Sample proportion
c.
Calculate the value of test statistic. (Round intermediate calculations to 4 decimal places. Round your answer to 2 decimal places.)
Test statistic
d.
Calculate the p-value of the test statistic. (Round intermediate calculations to 4 decimal places. Round "z" value to 2 decimal places and final answer to 4 decimal places.)
p-value
e.
What is the conclusion?
Do not reject H0; the politician is not supported by a clear majority
Do not reject H0; the politician is supported by a clear majority
Reject H0; the politician is not supported by a clear majority
Reject H0; the politician is supported by a clear majority
2)
Consider the following contingency table.
B
Bc
A
22
24
Ac
28
26
a.
Convert the contingency table into a joint probability table. (Round your intermediate calculations and final answers to 4 decimal places.)
B
Bc
Total
A
Ac
Total
b.
What is the probability that A occurs? (Round your intermediate calculations and final answer to 4 decimal places.)
Probability
c.
What is the probability that A and B occur? (Round your intermediate calculations and final answer to 4 decimal places.)
Probability
d.
Given that B has occurred, what is the probability that A occurs? (Round your intermediate calculations and final answer to 4 decimal places.)
Probability
e.
Given that Ac has occurred, what is the probability that B occurs? (Round your intermediate calculations and final answer to 4 decimal places.)
Probability
f.
Are A and B mutually exclusive events?
Yes because P(A | B) ≠ P(A).
Yes because P(A ∩ B) ≠ 0.
No because P(A | B) ≠ P(A).
No because P(A ∩ B) ≠ 0.
g.
Are A and B independent events?
Yes because P(A | B) ≠ P(A).
Yes because P(A ∩ B) ≠ 0.
No because P(A | B) ≠ P(A).
No because P(A ∩ B) ≠ 0.
3)
A hair salon in Cambridge, Massachusetts, reports that on seven randomly selected weekdays, the number of customers who visited the salon were 72, 55, 49, 35, 39, 23, and 77. It can be assumed that weekday customer visits follow a normal distribution. Use Table 2.
a.
Construct a 90% confidence interval for the average number of customers who visit the salon on weekdays. (Round intermediate calculations to 4 decimal places, "sample mean" and "sample standard deviation" to 2 decimal places and "t" value to 3 decimal places, and final answers to 2 decimal places.)
Confidence interval
to
b.
Construct a 99% confidence interval for the average number of customers who visit the .
[The following information applies to the questions displayed belo.docxdanielfoster65629
[The following information applies to the questions displayed below.]
A sample of 36 observations is selected from a normal population. The sample mean is 12, and the population standard deviation is 3. Conduct the following test of hypothesis using the 0.01 significance level.
H0: μ ≤ 10
H1: μ > 10
1.
Value:
10.00 points
Required information
a.
Is this a one- or two-tailed test?
One-tailed test
Two-tailed test
References
EBook & Resources
Multiple Choice Difficulty: 2 Intermediate Learning Objective: 10-05 Conduct a test of a hypothesis about a population mean.
eBook: Conduct a test of a hypothesis about a population mean.
Check my work
2.
Value:
10.00 points
Required information
b.
What is the decision rule?
Reject H0 when z ≤ 2.326
Reject H0 when z > 2.326
References
EBook & Resources
Multiple Choice Difficulty: 2 Intermediate Learning Objective: 10-05 Conduct a test of a hypothesis about a population mean.
eBook: Conduct a test of a hypothesis about a population mean.
Check my work
3.
Value:
10.00 points
Required information
c.
What is the value of the test statistic?
Value of the test statistic
References
EBook & Resources
Worksheet Difficulty: 2 Intermediate Learning Objective: 10-05 Conduct a test of a hypothesis about a population mean.
eBook: Conduct a test of a hypothesis about a population mean.
Check my work
4.
Value:
10.00 points
Required information
d.
What is your decision regarding H0?
Fail to reject H0
Reject H0
References
EBook & Resources
Multiple Choice Difficulty: 2 Intermediate Learning Objective: 10-05 Conduct a test of a hypothesis about a population mean.
eBook: Conduct a test of a hypothesis about a population mean.
Check my work
5.
Value:
10.00 points
Required information
e.
What is the p-value?
p-value
References
Given the following hypotheses:
H0 : μ = 400
H1 : μ ≠ 400
A random sample of 12 observations is selected from a normal population. The sample mean was 407 and the sample standard deviation 6. Using the .01 significance level:
a.
State the decision rule. (Negative amount should be indicated by a minus sign. Round your answers to 3 decimal places.)
Reject H0 when the test statistic is the interval (,).
b.
Compute the value of the test statistic. (Round your answer to 3 decimal places.)
Value of the test statistic
c.
What is your decision regarding the null hypothesis?
Do not reject
Reject
The management of White Industries is considering a new method of assembling its golf cart. The present method requires 42.3 minutes, on the average, to assemble a cart. The mean assembly time for a random sample of 24 carts, using the new method, was 40.6 minutes, and the standard deviation of the sample was 2.7 minutes. Using the .10 level of significance, can we conclude that the assembly time using the new method is faster?
a.
What is the decision rule? (Negative amount should be indicated by a minus sign. Round your answer to 3 decimal places.)
Rej.
Statistics practice for finalBe sure to review the following.docxdessiechisomjj4
Statistics practice for final
Be sure to review the following and have this information handy when taking Final GHA:
· Calculating z alpha/2 and t alpha/2 on Tables II and IV
· Find sample size for estimating population mean. Formula 8.3 p. 321 OCR.
· Stating H0 and H1 claims about variation and about the mean. Chapter 9 OCR.
· Type I and Type II errors p. 345 OCR.
· Confidence Interval for difference between two population means. Chapter 10 OCR p. 428
· Pooled sample standard deviation. Chapter 10 OCR p. 397
· What do Chi-Square tests measure? How are their degrees of freedom calculated? Chapter 12 OCR
· Find F test statistic using One-Way ANOVA.xls Be sure to enable editing and change values to match your problem. One-Way ANOVA.xls
· Find equation of regression line used to predict. To do on Excel, go to a blank worksheet, enter x values in one column and their matching y values in another column. Click Insert – Select Scatterplot. Right click any one of the points (diamonds) on the graph. Left click “Add a Trendline.” Check “Display Equation on Chart” box. Regression equation will appear on chart. Try it here with No. 20 below.
Practice Problems
Chapter 8 Final Review
1) In which of the following situations is it reasonable to use the z-interval
procedure to obtain a confidence interval for the population mean?
Assume that the population standard deviation is known.
A. n = 10, the data contain no outliers, the variable under consideration is
not normally distributed.
B. n = 10, the variable under consideration is normally distributed.
C. n = 18, the data contain no outliers, the variable under consideration is
far from being normally distributed.
D. n = 18, the data contain outliers, the variable under consideration is
normally distributed.
Find the necessary sample size.
2) The weekly earnings of students in one age group are normally
distributed with a standard deviation of 10 dollars. A researcher wishes to
estimate the mean weekly earnings of students in this age group. Find the
sample size needed to assure with 95 percent confidence that the sample
mean will not differ from the population mean by more than 2 dollars.
Find the specified t-value.
3) For a t-curve with df = 6, find the two t-values that divide the area under
the curve into a middle 0.99 area and two outside areas of 0.005.
Provide an appropriate response.
4) Under what conditions would you choose to use the t-interval procedure
instead of the z-interval procedure in order to obtain a confidence
interval for a population mean? What conditions must be satisfied in
order to use the t-interval procedure?
CHAPTER 8 Answers
1) B
2) 97
3) -3.707, 3.707
4) When the population standard deviation is unknown, the t-interval procedure is used instead of the
z-interval procedure. The t-interval procedure works provided that the population is normally
distributed or the.
One. Clark Heter is an industrial engineer at Lyons Products. He .docxhopeaustin33688
One. Clark Heter is an industrial engineer at Lyons Products. He would like to determine whether there are more units produced on the night shift than on the day shift. A sample of 50 day-shift workers showed that the mean number of units produced was 353, with a population standard deviation of 25. A sample of 55 night-shift workers showed that the mean number of units produced was 363, with a population standard deviation of 31 units.
At the .01 significance level, is the number of units produced on the night shift larger?
(a)
This is a -tailed test.
(b)
The decision rule is to reject if Z < . (Negative amount should be indicated by a minus sign. Round your answer to 2 decimal places.)
(c)
The test statistic is Z = . (Negative amount should be indicated by a minus sign. Round your answer to 2 decimal places.)
TWO
Each month the National Association of Purchasing Managers publishes the NAPM index. One of the questions asked on the survey to purchasing agents is: Do you think the economy is contracting? Last month, of the 310 responses, 164 answered yes to the question. This month, 177 of the 291 responses indicated they felt the economy was contracting.
At the .02 significance level, can we conclude that a larger proportion of the agents believe the economy is contracting this month?
pc = . (Do not round the intermediate value. Round your answer to 2 decimal places.)
The test statistic is . (Negative amount should be indicated by a minus sign. Do not round the intermediate value. Round your answer to 2 decimal places.)
Decision: the null. H0 : π1 ≥ π2
THREE
The manufacturer of an MP3 player wanted to know whether a 10 percent reduction in price is enough to increase the sales of its product. To investigate, the owner randomly selected eight outlets and sold the MP3 player at the reduced price. At seven randomly selected outlets, the MP3 player was sold at the regular price. Reported below is the number of units sold last month at the sampled outlets.
Regular price
133
124
88
112
144
128
96
Reduced price
124
134
152
134
114
109
113
114
At the .050 significance level, can the manufacturer conclude that the price reduction resulted in an increase in sales? Hint: For the calculations, assume the Reduced price as the first sample.
The pooled variance is . (Round your answer to 2 decimal places.)
The test statistic is . (Round your answer to 2 decimal places.)
H0.
FOUR
One of the music industry's most pressing questions is: Can paid download stores contend nose-to-nose with free peer-to-peer download services? Data gathered over the last 12 months show Apple's iTunes was used by an average of 1.81 million households with a sample standard deviation of .47 million family units. Over the same 12 months WinMX (a no-cost P2P download service) was used by an average of 2.21 million families with a sample standard deviation of .32 million. Assume the population standard deviations are not the sam.
Categorical Data and Statistical AnalysisMichael770443
In this presentation, we will introduce two tests and hypothesis testing based on it, and different non-parametric methods such as the Kolmogorov-Smirnov test, the Wilcoxon’s signed-rank test, the Mann-Whitney U test, and the Kruskal-Wallis test.
Francesca Gottschalk - How can education support child empowerment.pptxEduSkills OECD
Francesca Gottschalk from the OECD’s Centre for Educational Research and Innovation presents at the Ask an Expert Webinar: How can education support child empowerment?
Palestine last event orientationfvgnh .pptxRaedMohamed3
An EFL lesson about the current events in Palestine. It is intended to be for intermediate students who wish to increase their listening skills through a short lesson in power point.
Unit 8 - Information and Communication Technology (Paper I).pdfThiyagu K
This slides describes the basic concepts of ICT, basics of Email, Emerging Technology and Digital Initiatives in Education. This presentations aligns with the UGC Paper I syllabus.
The Roman Empire A Historical Colossus.pdfkaushalkr1407
The Roman Empire, a vast and enduring power, stands as one of history's most remarkable civilizations, leaving an indelible imprint on the world. It emerged from the Roman Republic, transitioning into an imperial powerhouse under the leadership of Augustus Caesar in 27 BCE. This transformation marked the beginning of an era defined by unprecedented territorial expansion, architectural marvels, and profound cultural influence.
The empire's roots lie in the city of Rome, founded, according to legend, by Romulus in 753 BCE. Over centuries, Rome evolved from a small settlement to a formidable republic, characterized by a complex political system with elected officials and checks on power. However, internal strife, class conflicts, and military ambitions paved the way for the end of the Republic. Julius Caesar’s dictatorship and subsequent assassination in 44 BCE created a power vacuum, leading to a civil war. Octavian, later Augustus, emerged victorious, heralding the Roman Empire’s birth.
Under Augustus, the empire experienced the Pax Romana, a 200-year period of relative peace and stability. Augustus reformed the military, established efficient administrative systems, and initiated grand construction projects. The empire's borders expanded, encompassing territories from Britain to Egypt and from Spain to the Euphrates. Roman legions, renowned for their discipline and engineering prowess, secured and maintained these vast territories, building roads, fortifications, and cities that facilitated control and integration.
The Roman Empire’s society was hierarchical, with a rigid class system. At the top were the patricians, wealthy elites who held significant political power. Below them were the plebeians, free citizens with limited political influence, and the vast numbers of slaves who formed the backbone of the economy. The family unit was central, governed by the paterfamilias, the male head who held absolute authority.
Culturally, the Romans were eclectic, absorbing and adapting elements from the civilizations they encountered, particularly the Greeks. Roman art, literature, and philosophy reflected this synthesis, creating a rich cultural tapestry. Latin, the Roman language, became the lingua franca of the Western world, influencing numerous modern languages.
Roman architecture and engineering achievements were monumental. They perfected the arch, vault, and dome, constructing enduring structures like the Colosseum, Pantheon, and aqueducts. These engineering marvels not only showcased Roman ingenuity but also served practical purposes, from public entertainment to water supply.
Synthetic Fiber Construction in lab .pptxPavel ( NSTU)
Synthetic fiber production is a fascinating and complex field that blends chemistry, engineering, and environmental science. By understanding these aspects, students can gain a comprehensive view of synthetic fiber production, its impact on society and the environment, and the potential for future innovations. Synthetic fibers play a crucial role in modern society, impacting various aspects of daily life, industry, and the environment. ynthetic fibers are integral to modern life, offering a range of benefits from cost-effectiveness and versatility to innovative applications and performance characteristics. While they pose environmental challenges, ongoing research and development aim to create more sustainable and eco-friendly alternatives. Understanding the importance of synthetic fibers helps in appreciating their role in the economy, industry, and daily life, while also emphasizing the need for sustainable practices and innovation.
Biological screening of herbal drugs: Introduction and Need for
Phyto-Pharmacological Screening, New Strategies for evaluating
Natural Products, In vitro evaluation techniques for Antioxidants, Antimicrobial and Anticancer drugs. In vivo evaluation techniques
for Anti-inflammatory, Antiulcer, Anticancer, Wound healing, Antidiabetic, Hepatoprotective, Cardio protective, Diuretics and
Antifertility, Toxicity studies as per OECD guidelines
How to Make a Field invisible in Odoo 17Celine George
It is possible to hide or invisible some fields in odoo. Commonly using “invisible” attribute in the field definition to invisible the fields. This slide will show how to make a field invisible in odoo 17.
A Strategic Approach: GenAI in EducationPeter Windle
Artificial Intelligence (AI) technologies such as Generative AI, Image Generators and Large Language Models have had a dramatic impact on teaching, learning and assessment over the past 18 months. The most immediate threat AI posed was to Academic Integrity with Higher Education Institutes (HEIs) focusing their efforts on combating the use of GenAI in assessment. Guidelines were developed for staff and students, policies put in place too. Innovative educators have forged paths in the use of Generative AI for teaching, learning and assessments leading to pockets of transformation springing up across HEIs, often with little or no top-down guidance, support or direction.
This Gasta posits a strategic approach to integrating AI into HEIs to prepare staff, students and the curriculum for an evolving world and workplace. We will highlight the advantages of working with these technologies beyond the realm of teaching, learning and assessment by considering prompt engineering skills, industry impact, curriculum changes, and the need for staff upskilling. In contrast, not engaging strategically with Generative AI poses risks, including falling behind peers, missed opportunities and failing to ensure our graduates remain employable. The rapid evolution of AI technologies necessitates a proactive and strategic approach if we are to remain relevant.
Macroeconomics- Movie Location
This will be used as part of your Personal Professional Portfolio once graded.
Objective:
Prepare a presentation or a paper using research, basic comparative analysis, data organization and application of economic information. You will make an informed assessment of an economic climate outside of the United States to accomplish an entertainment industry objective.
Embracing GenAI - A Strategic ImperativePeter Windle
Artificial Intelligence (AI) technologies such as Generative AI, Image Generators and Large Language Models have had a dramatic impact on teaching, learning and assessment over the past 18 months. The most immediate threat AI posed was to Academic Integrity with Higher Education Institutes (HEIs) focusing their efforts on combating the use of GenAI in assessment. Guidelines were developed for staff and students, policies put in place too. Innovative educators have forged paths in the use of Generative AI for teaching, learning and assessments leading to pockets of transformation springing up across HEIs, often with little or no top-down guidance, support or direction.
This Gasta posits a strategic approach to integrating AI into HEIs to prepare staff, students and the curriculum for an evolving world and workplace. We will highlight the advantages of working with these technologies beyond the realm of teaching, learning and assessment by considering prompt engineering skills, industry impact, curriculum changes, and the need for staff upskilling. In contrast, not engaging strategically with Generative AI poses risks, including falling behind peers, missed opportunities and failing to ensure our graduates remain employable. The rapid evolution of AI technologies necessitates a proactive and strategic approach if we are to remain relevant.
1. Focus Fox
Select the best option:
Which of the following is a condition that must be met in order to
carry out a chi-square goodness-of-fit test?
a. The population must be normally distributed, or the sample size
must be greater than 30
b. The cell counts for our sample have to be approximately the same
as the expected counts
c. All observed cell counts must be greater than 5
d. All expected counts must be greater than 5
e. More than one of these conditions must be met
2. Chi-Square Test Homgeneity
Chi-Square Test for Homogeneity – two way table
If Random – random samples from each population or groups in
randomized experiment
If Large Sample Size – all expected counts are at least 5
If Independent – individual observations & 10% condition
H0: there is no difference in the distribution of a categorical variable
for several populations or treatments
Ha: there is a difference in the distribution of a categorical variable
for several populations or treatments
Find expected counts
df = (number of rows – 1)(number of columns – 1)
P-value is the area to the right of χ2 under the density curve
3. Chi-Square Test Homgeneity
H0: there is no difference in the distributions of wine purchases at
this store when no music, French accordion music, or Italian string
music is played.
Ha: there is a difference in the distributions of wine purchases at this
store when no music, French accordion, or Italian string music is
played.
Previously calculated test statistic χ2 = 18.28
Wine No Music French Italian Totals
French 30 39 30 99
Italian 11 1 19 31
Other 43 35 35 113
Totals 84 75 84 243
4. Chi-Square Test Homgeneity
Previously calculated test statistic χ2 = 18.28
Use Table C to find the P-value.
Now use χ2cdf command on calculator
Wine No Music French Italian Totals
French 30 39 30 99
Italian 11 1 19 31
Other 43 35 35 113
Totals 84 75 84 243
5. Chi-Square Test Homgeneity
Previously calculated test statistic χ2 = 18.28
Interpret the P-value from the calculator in context.
What conclusion would you draw?
Wine No Music French Italian Totals
French 30 39 30 99
Italian 11 1 19 31
Other 43 35 35 113
Totals 84 75 84 243
6. Chi-Square Test Homgeneity
Using Technology:
Enter the observed data in Matrix A
Select χ2 test - STATS – TESTS – χ2 - Test
Observed: [A]
Expected: [B]
Choose calculate then 2nd Enter and Draw
Select and enter Matrix [B]
Tables are commonly referenced by dimensions row by column –
2x3
Pg. 706
7. Chi-Square Test Homgeneity
Follow-Up Analysis
The chi-square test for homogeneity allows us to compare the
distribution of a categorical variable for any number of populations
or treatments.
If we reject the null of no difference, follow-up analysis is required
- Examine which cell in the two-way table show large deviations
between observed and expected counts.
- Look at the which contribute the most to the chi-square statistic
Pg. 709 – minitab output and analysis