The document describes two common methods for hypothesis testing:
1) The traditional method involves identifying the null and alternative hypotheses, significance level, critical values, test statistic, and making a decision to reject or fail to reject the null hypothesis.
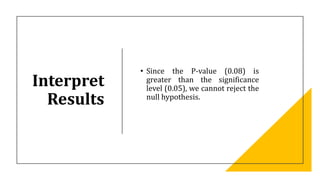
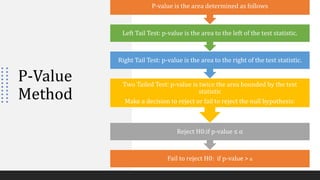
2) The p-value method compares the p-value to the significance level (α) to decide whether to reject or fail to reject the null hypothesis.
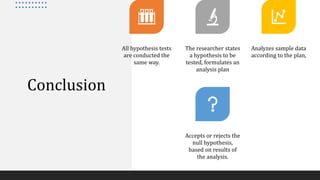
All hypothesis tests follow the same general steps: state hypotheses, formulate an analysis plan, analyze sample data, and interpret results to accept or reject the null hypothesis.


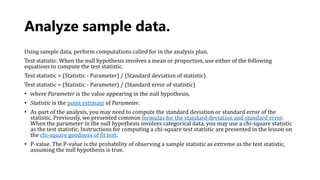
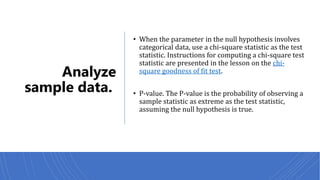


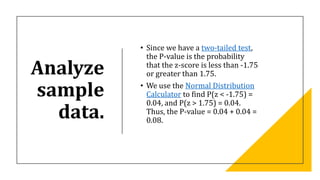
![Analyze sample data.
• Using sample data, we calculate the standard
deviation (σ) and compute the z-score test
statistic
• (z).σ = sqrt[ P * ( 1 - P ) / n ]
• σ = sqrt [(0.8 * 0.2) / 100]
• σ = sqrt(0.0016) = 0.04
• z = (p - P) / σ = (.73 - .80)/0.04 = -1.75
• where P is the hypothesized value of population
proportion in the null hypothesis, p is the sample
proportion, and n is the sample size.](https://image.slidesharecdn.com/10-hypothesisteesting-210303063244/85/hypothesis-teesting-15-320.jpg)