Download as PDF, PPTX

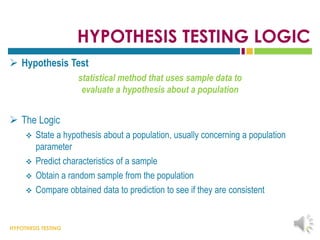
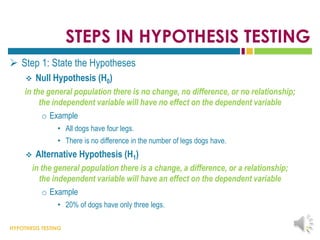
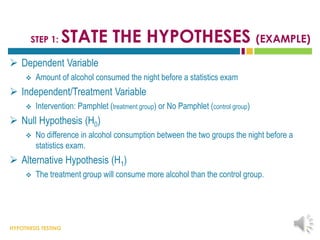
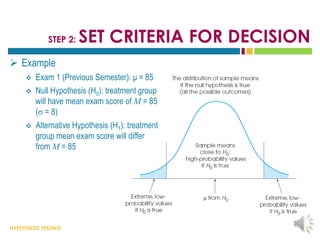
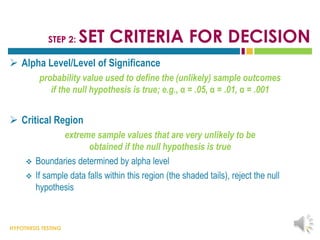
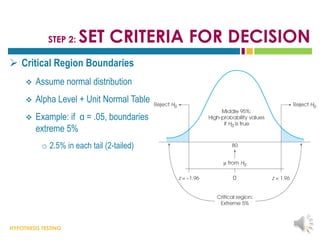
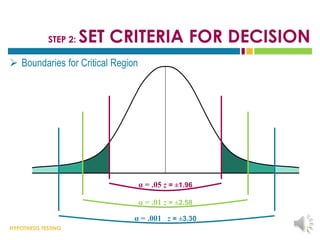
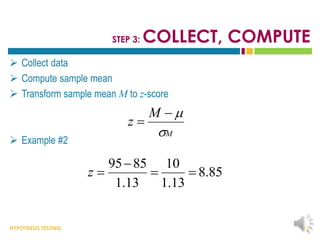
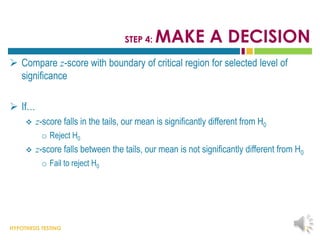
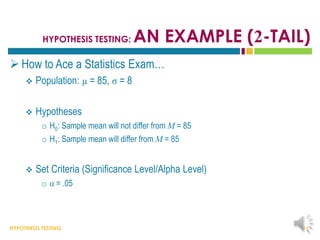
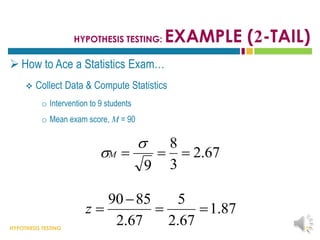
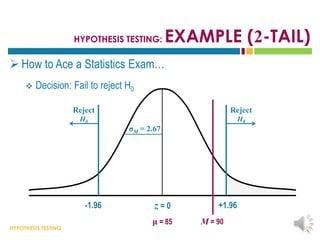
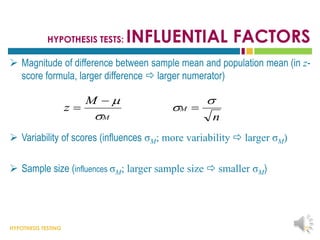
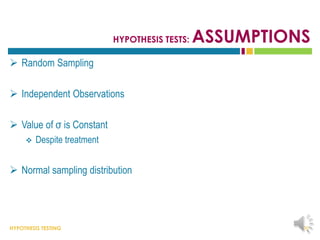
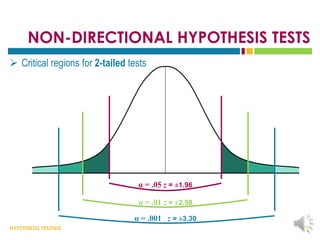
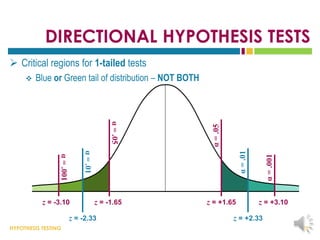

This document provides an overview of hypothesis testing. It begins with an outline of the key topics to be covered, including the logic of hypothesis testing, types of errors, specific hypothesis tests, effect size, and statistical power. The body of the document then defines these concepts in more detail through examples and explanations. It discusses how to state hypotheses, set decision criteria, collect and analyze data, and make conclusions regarding whether to reject the null hypothesis. Factors that influence hypothesis tests like sample characteristics and test assumptions are also outlined.


