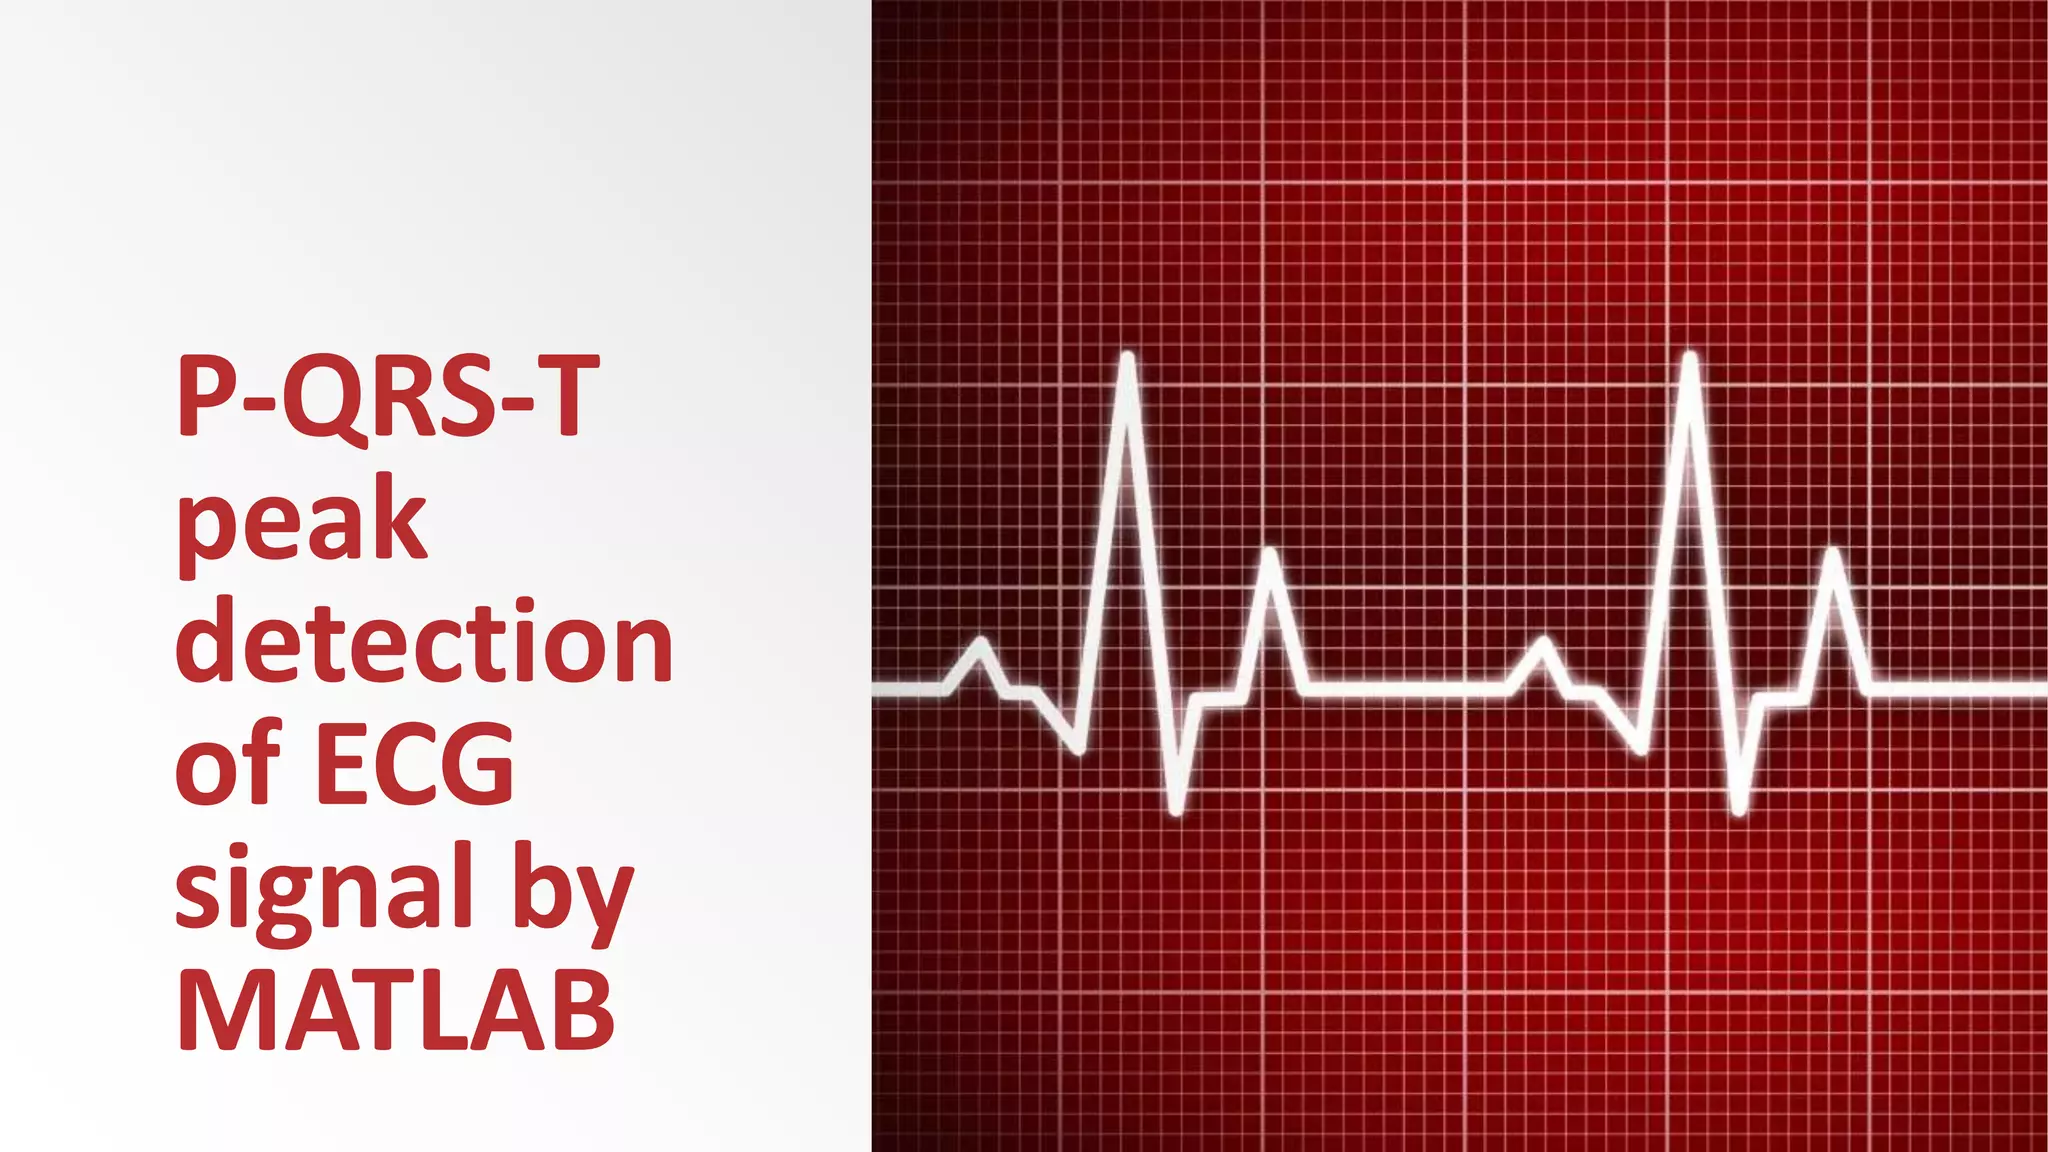
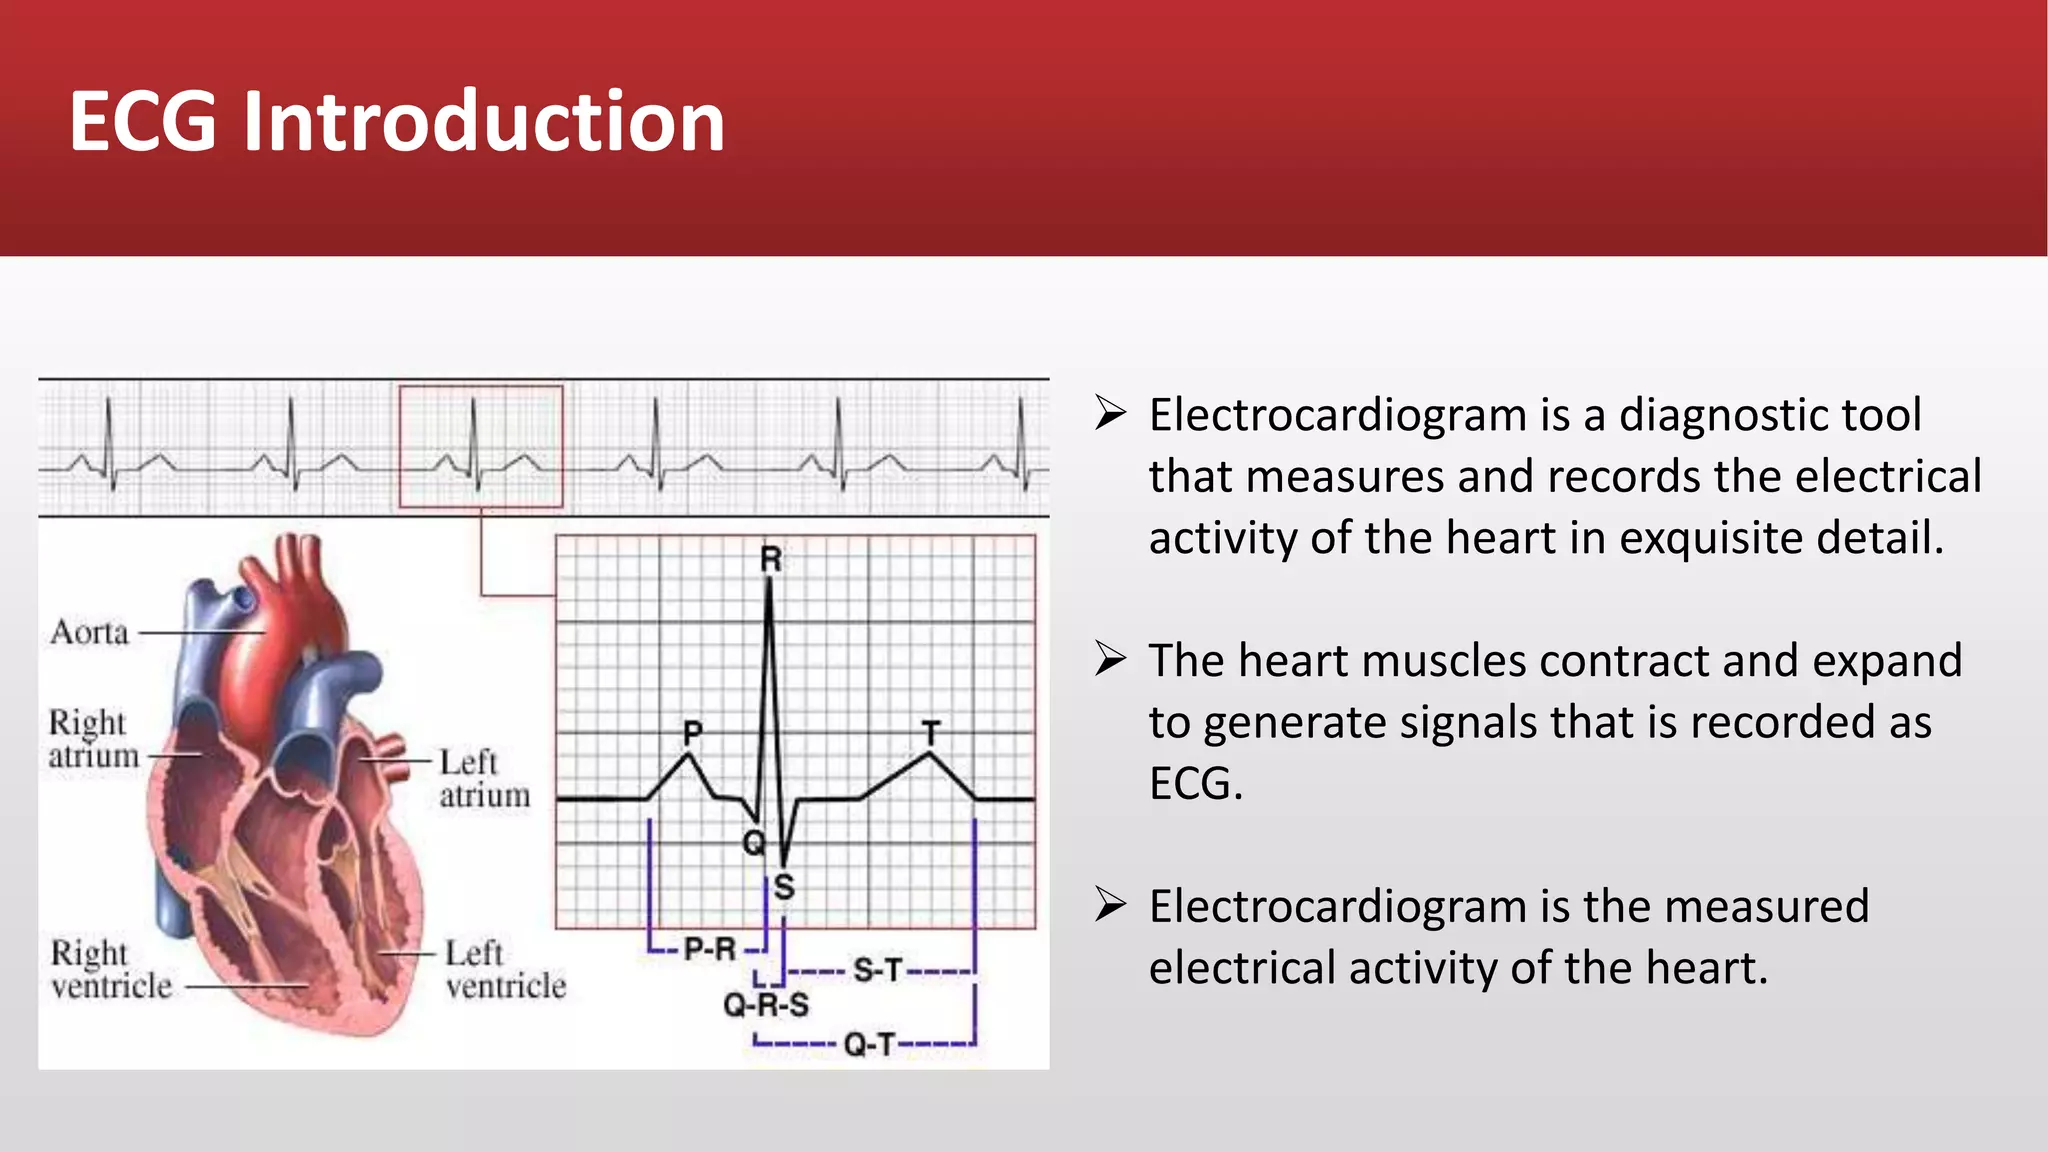
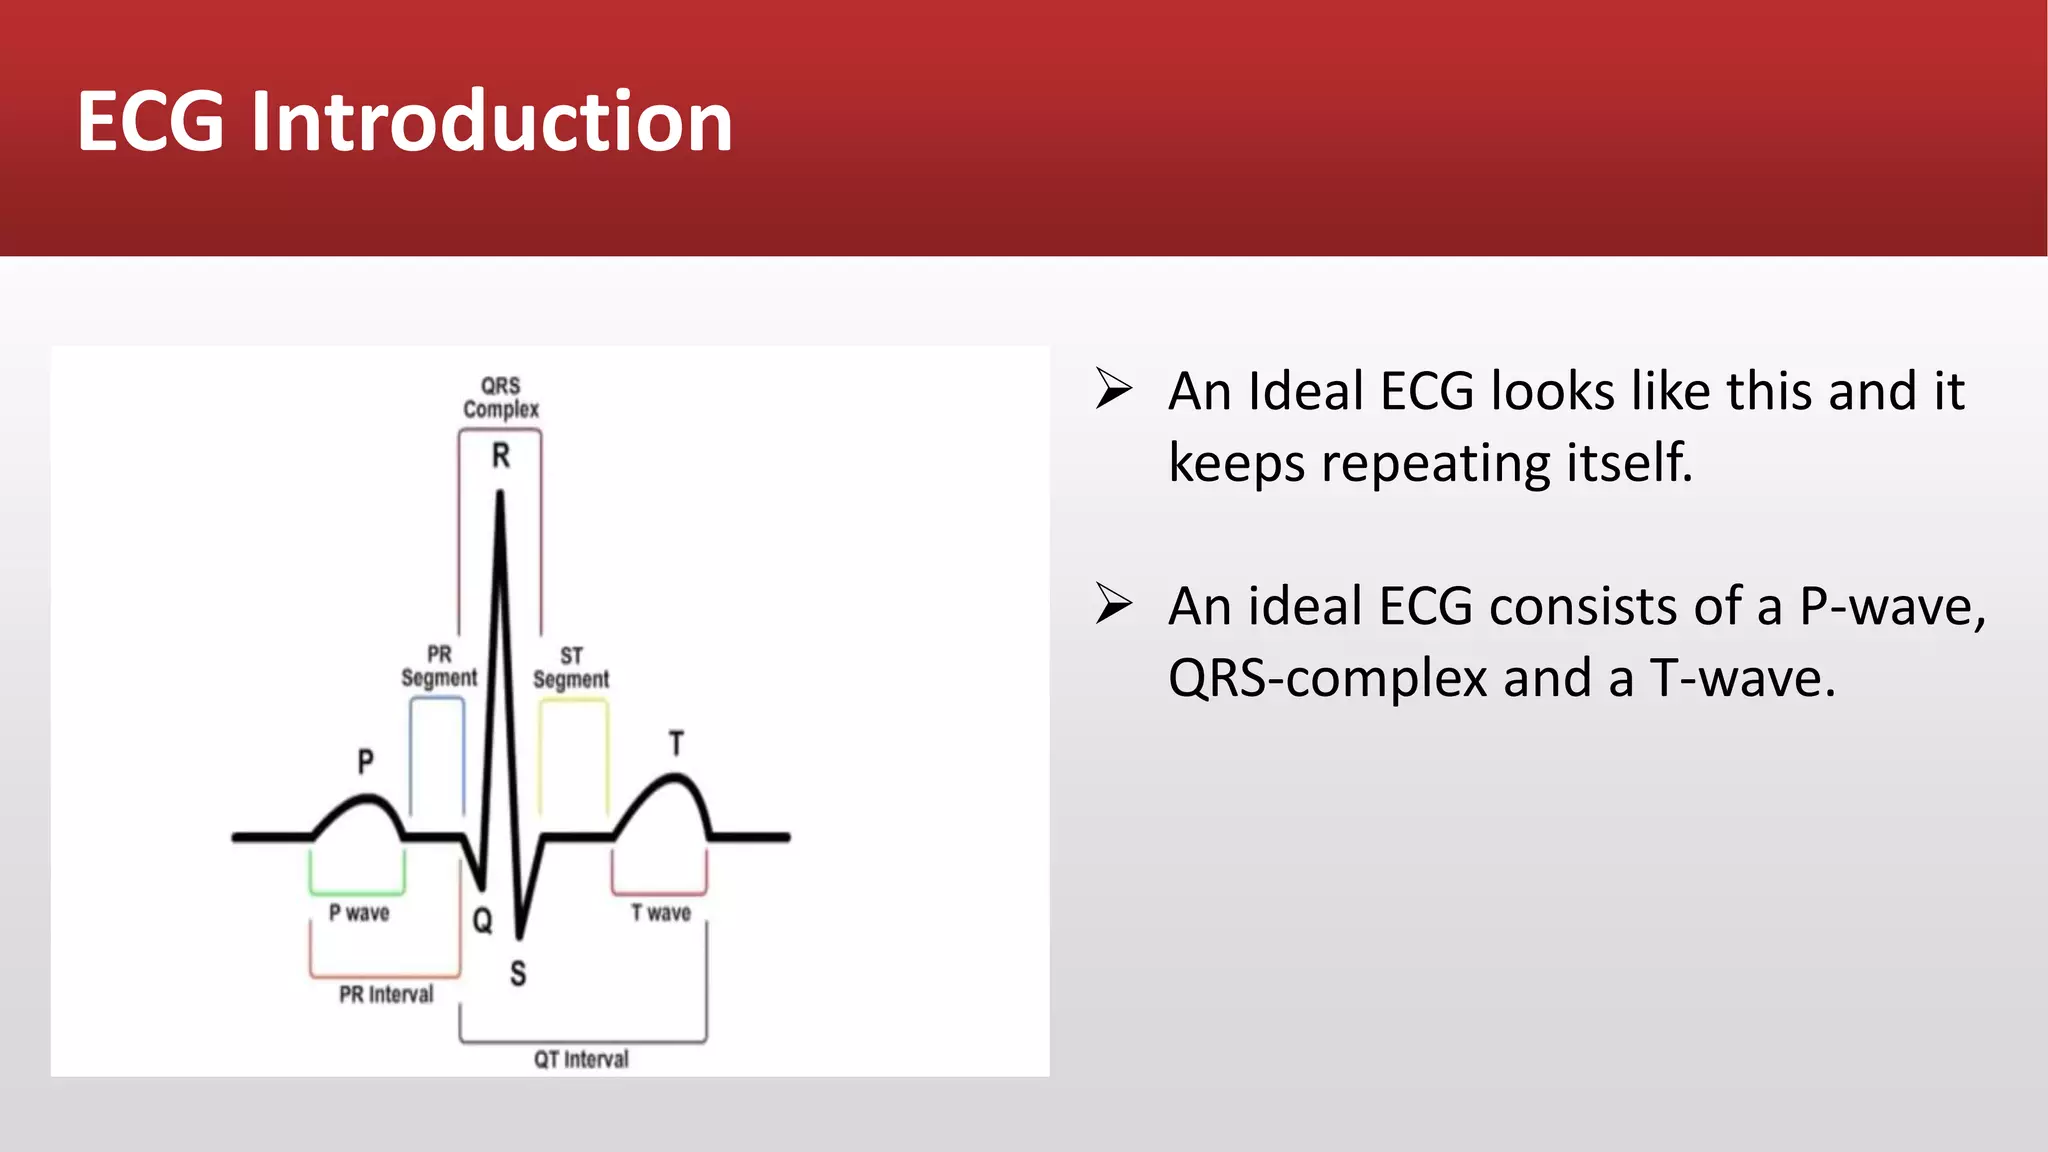
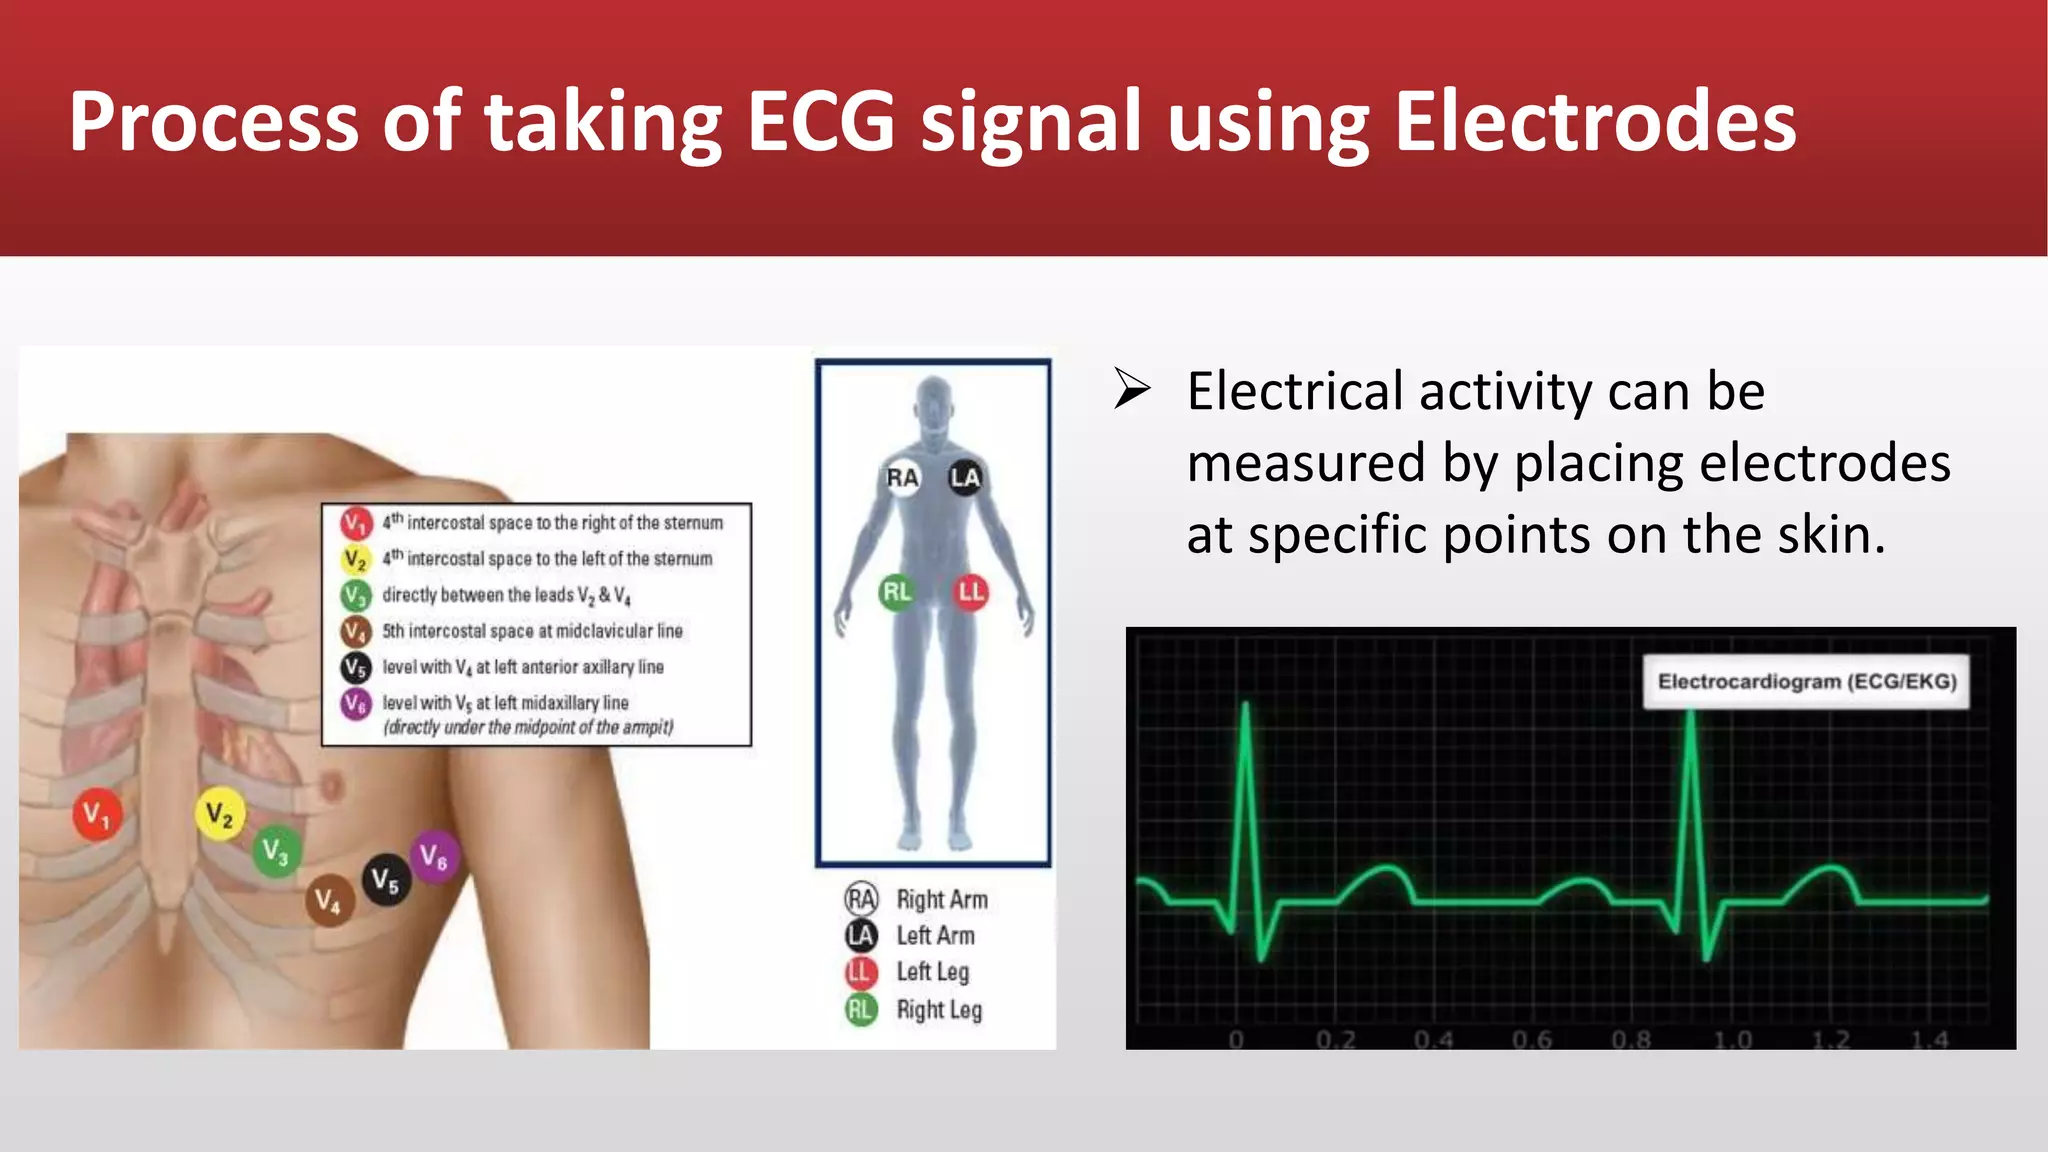
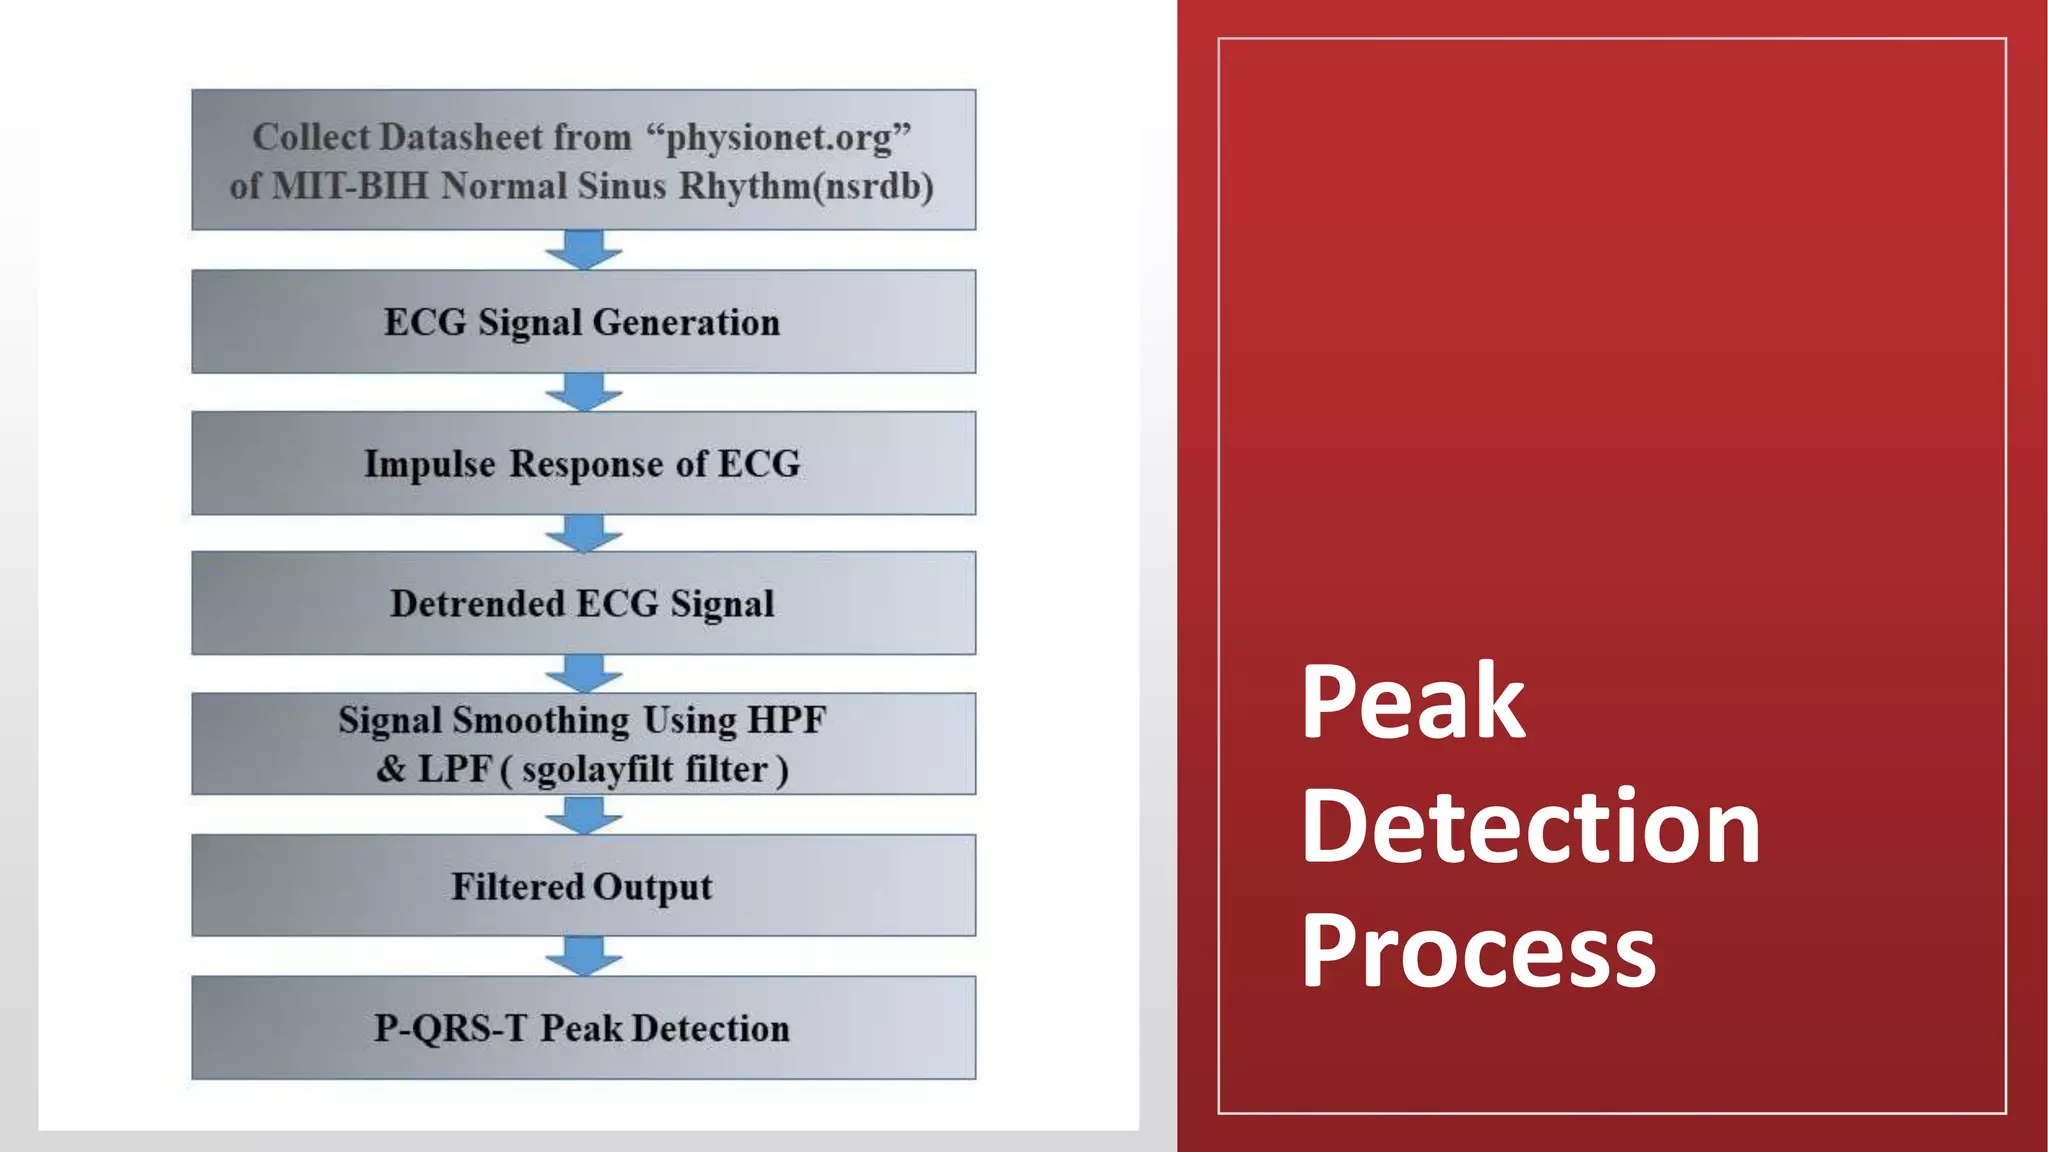
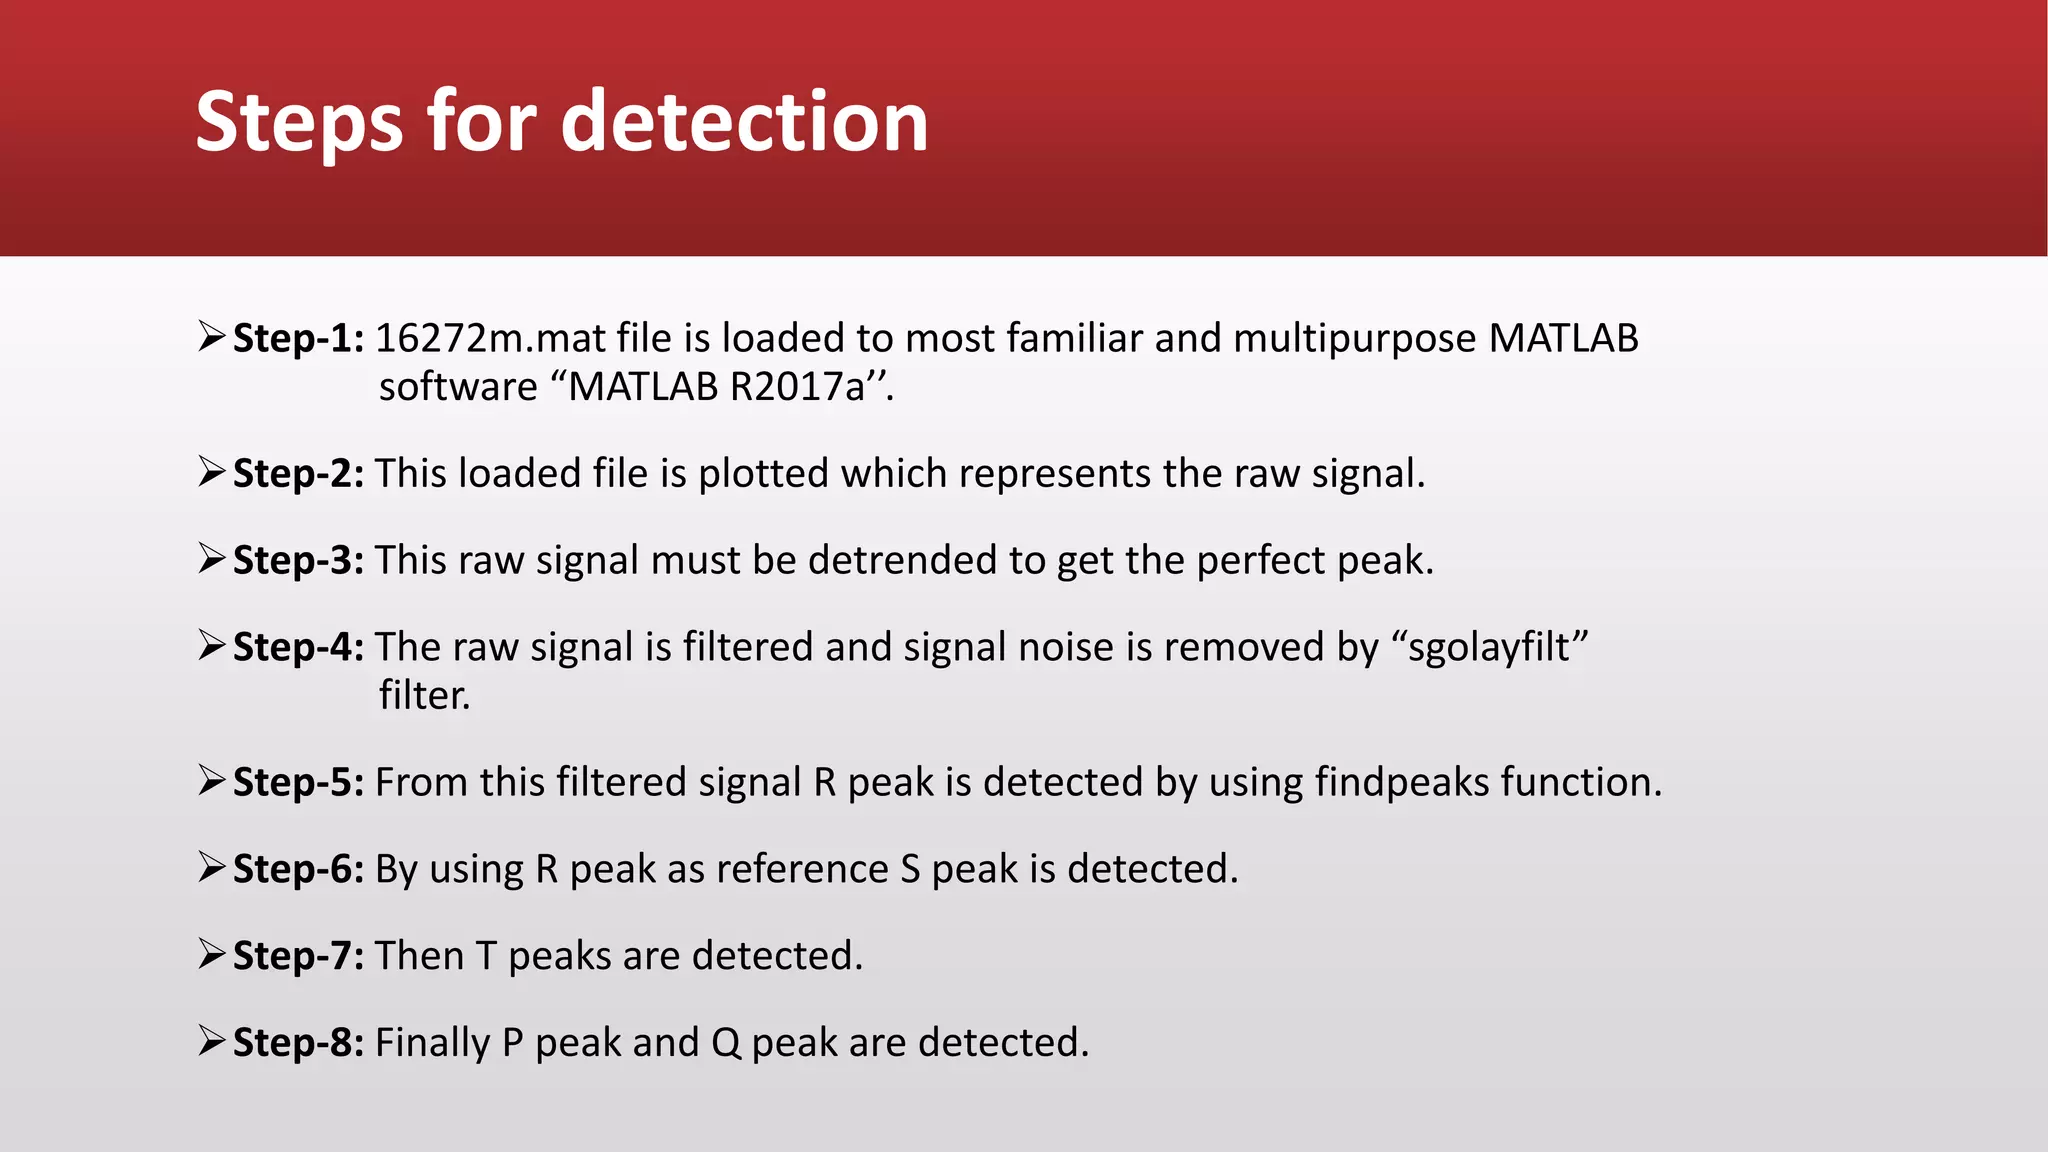
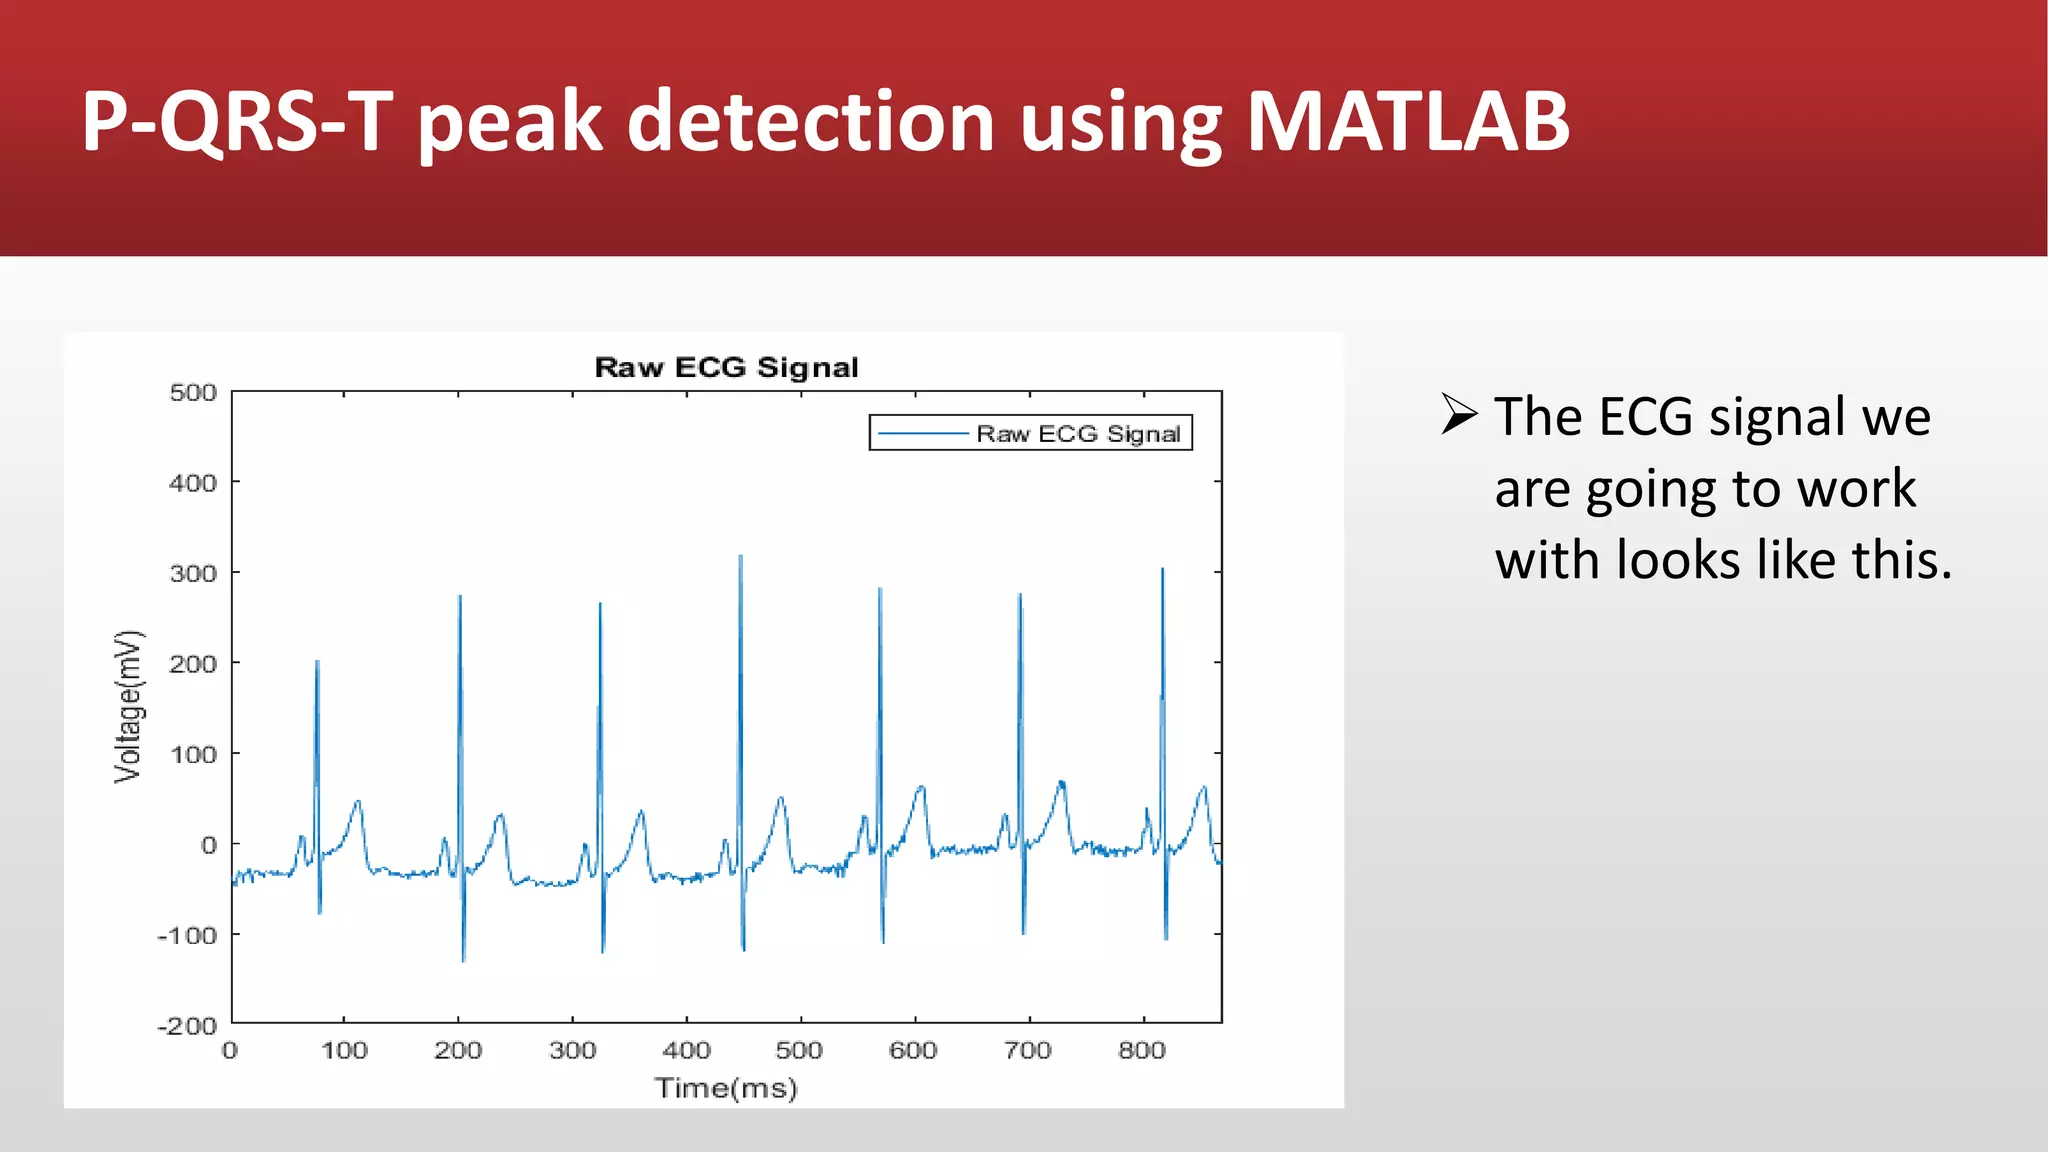
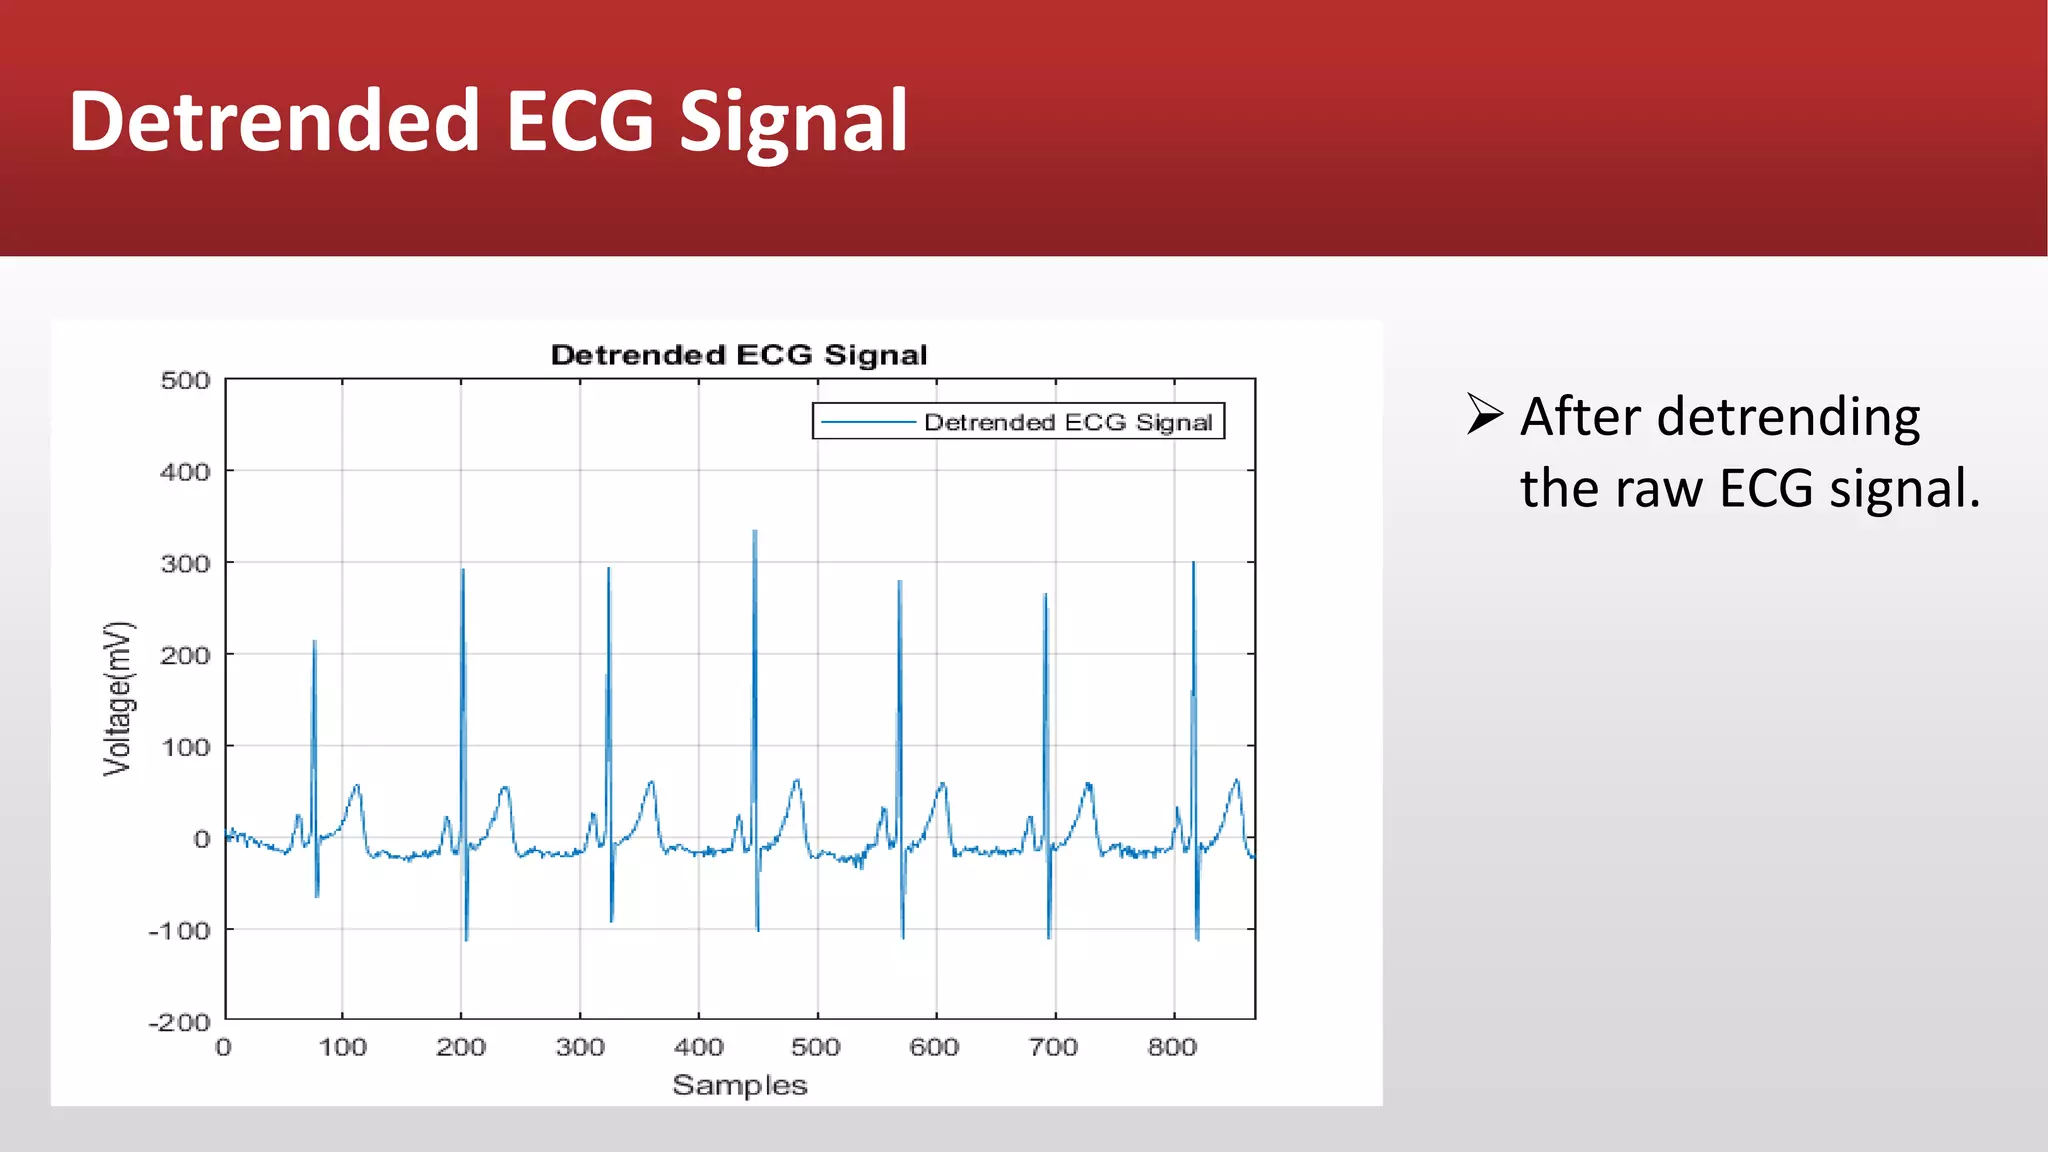
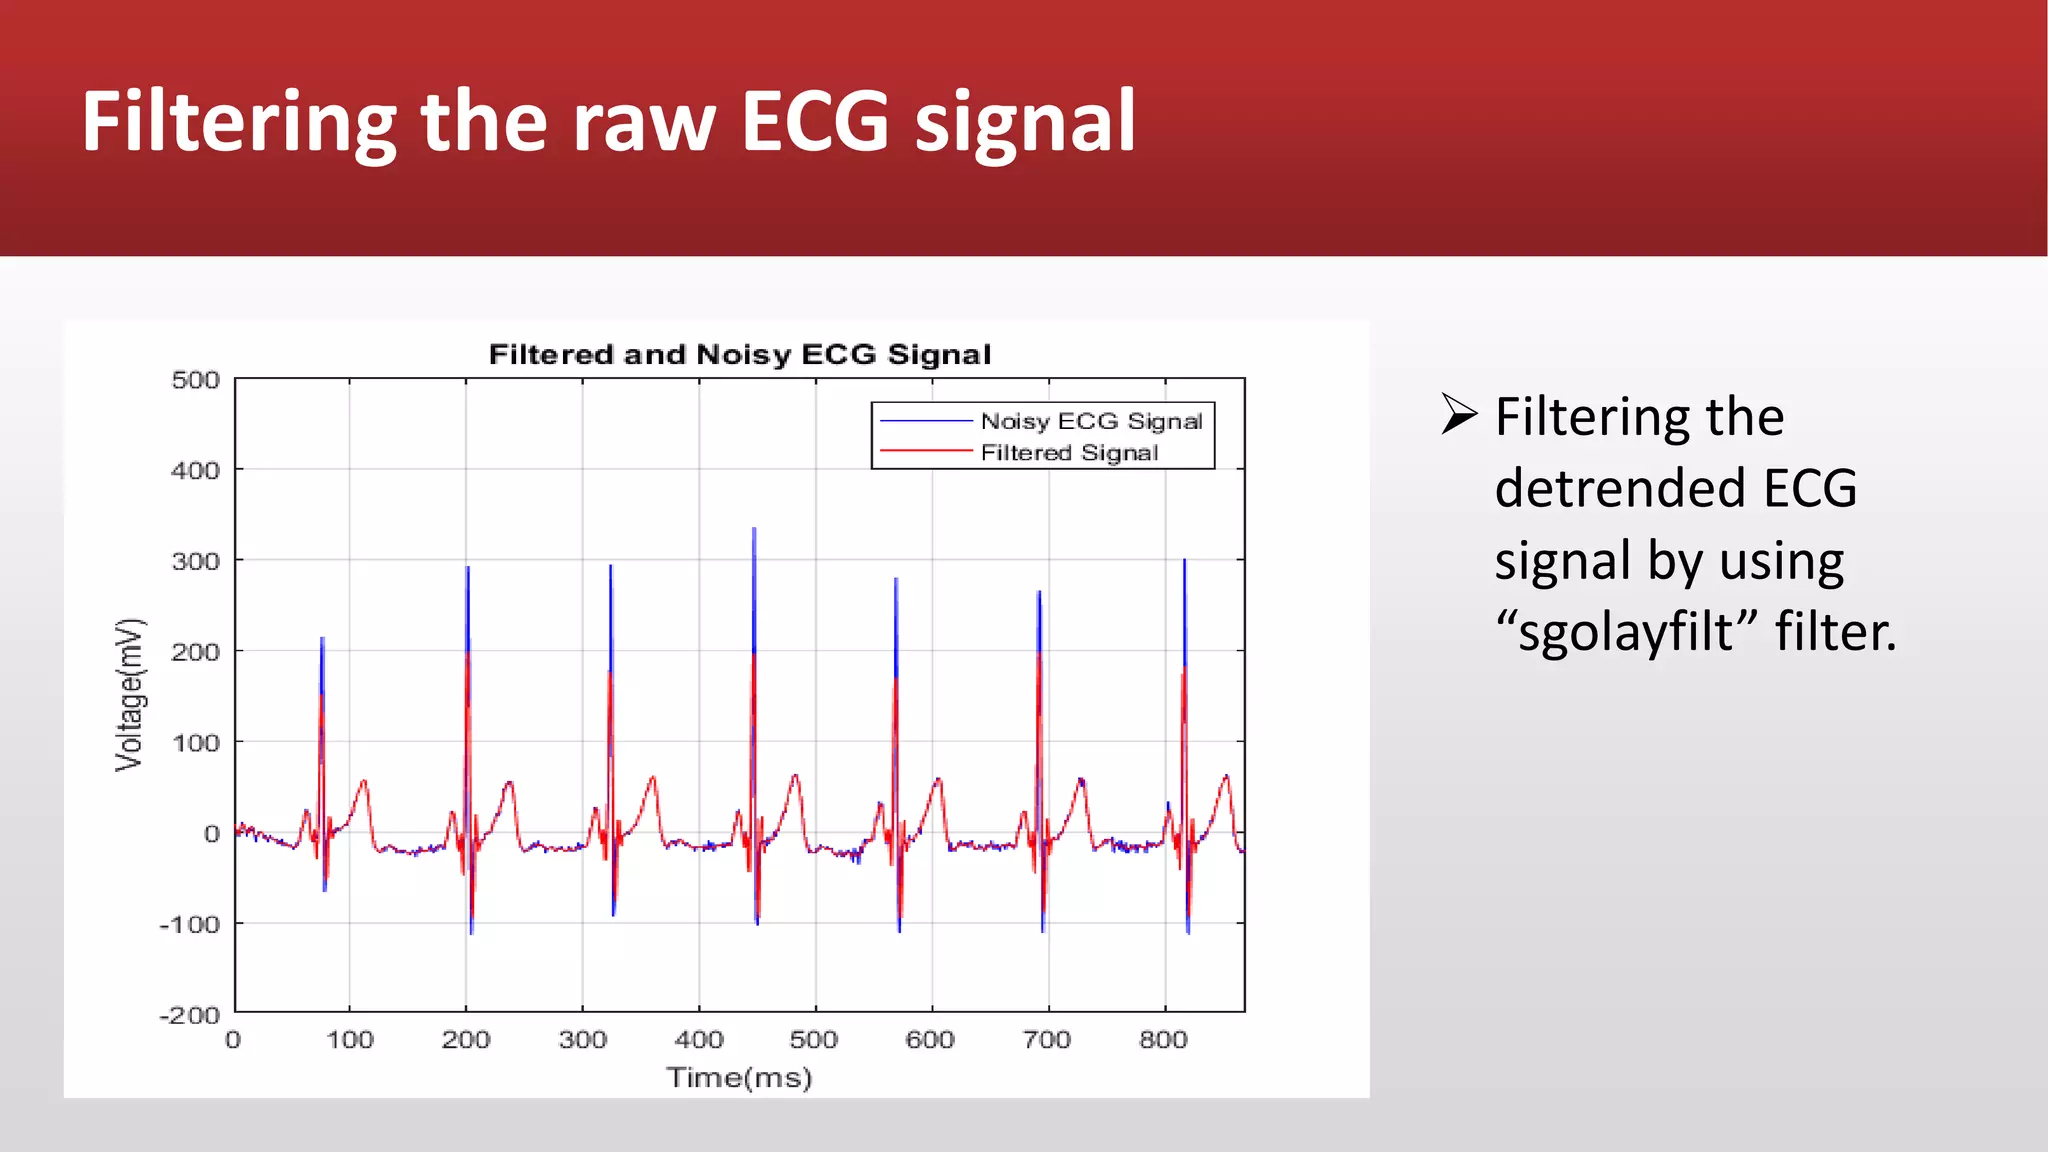
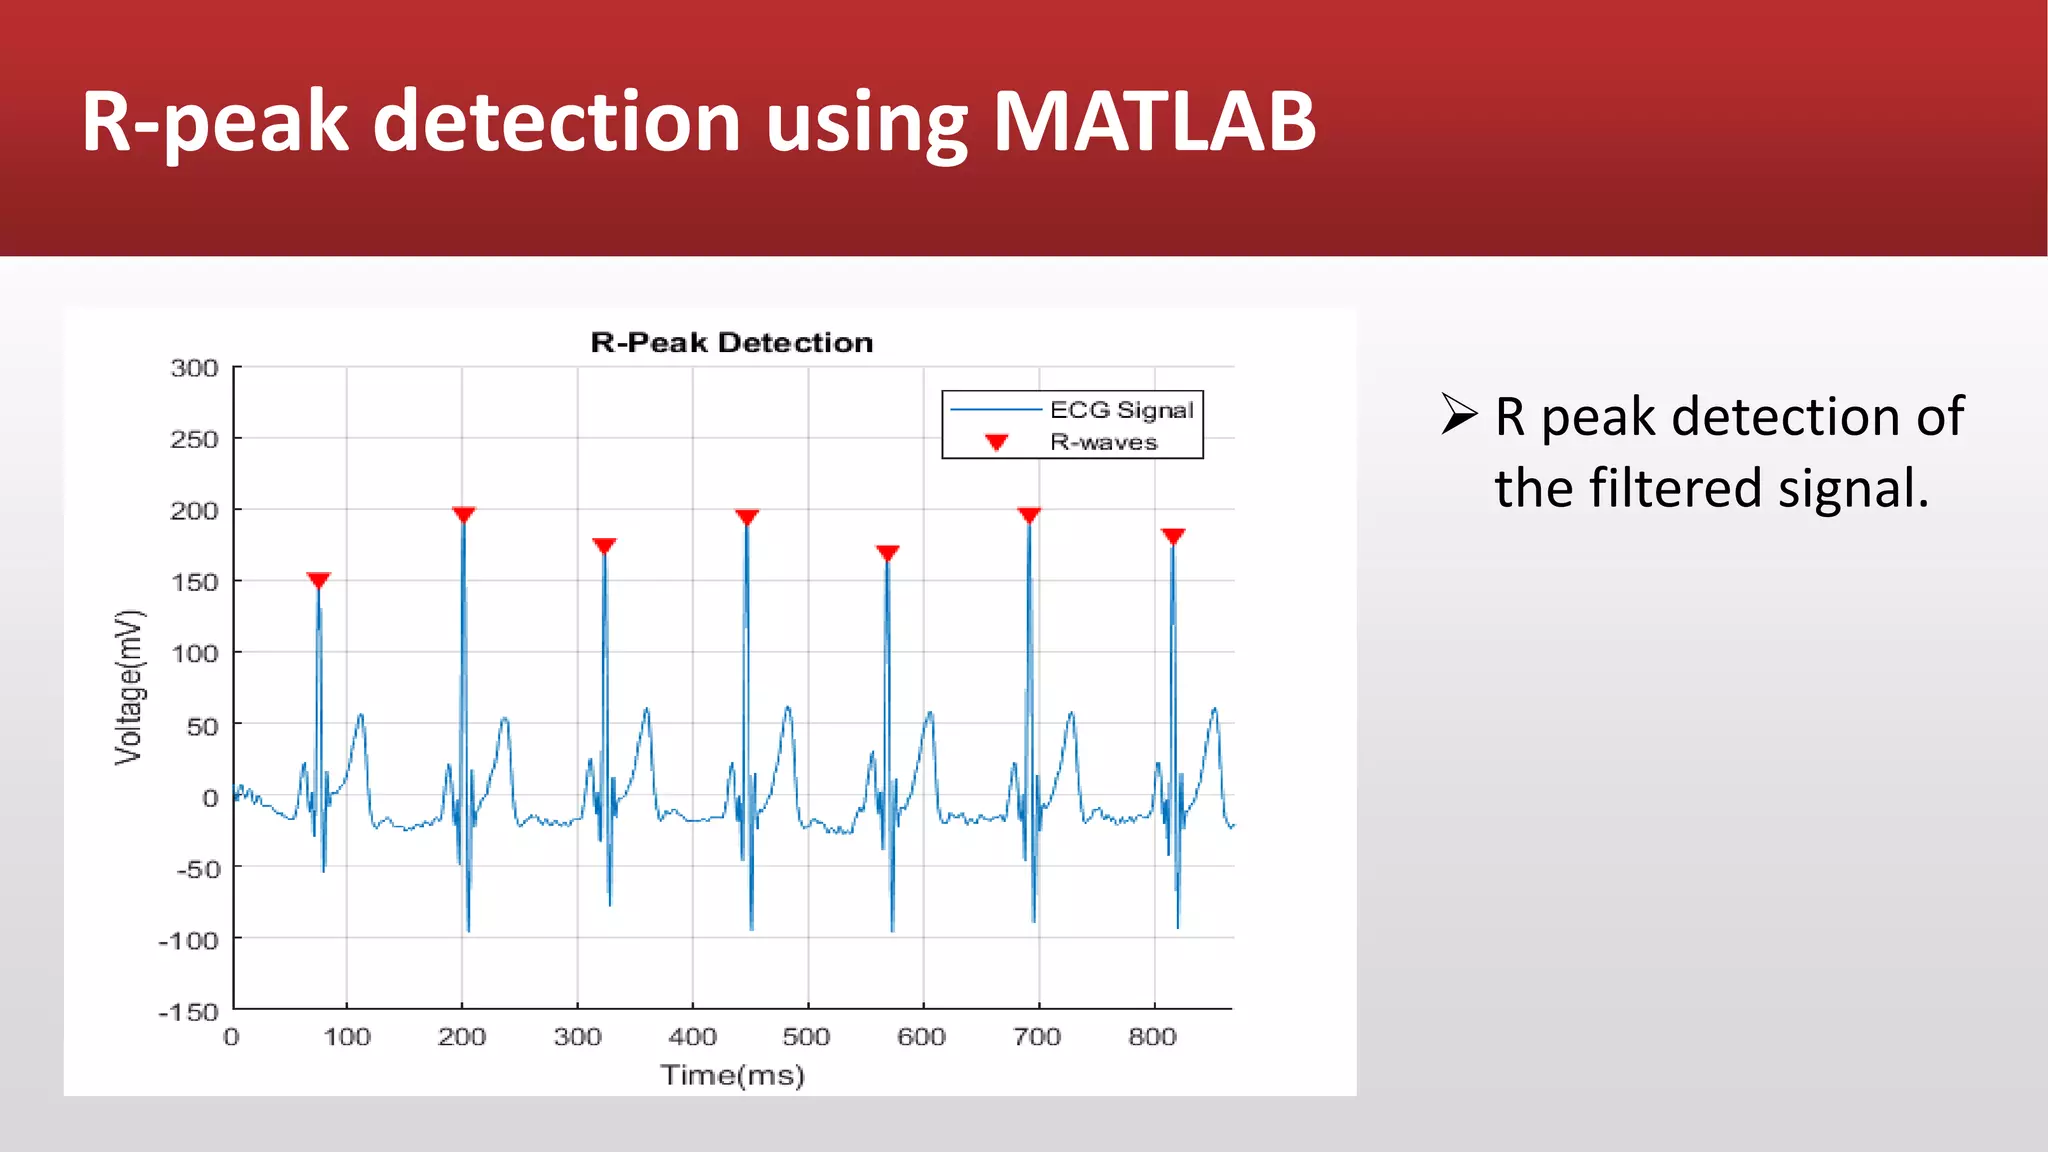
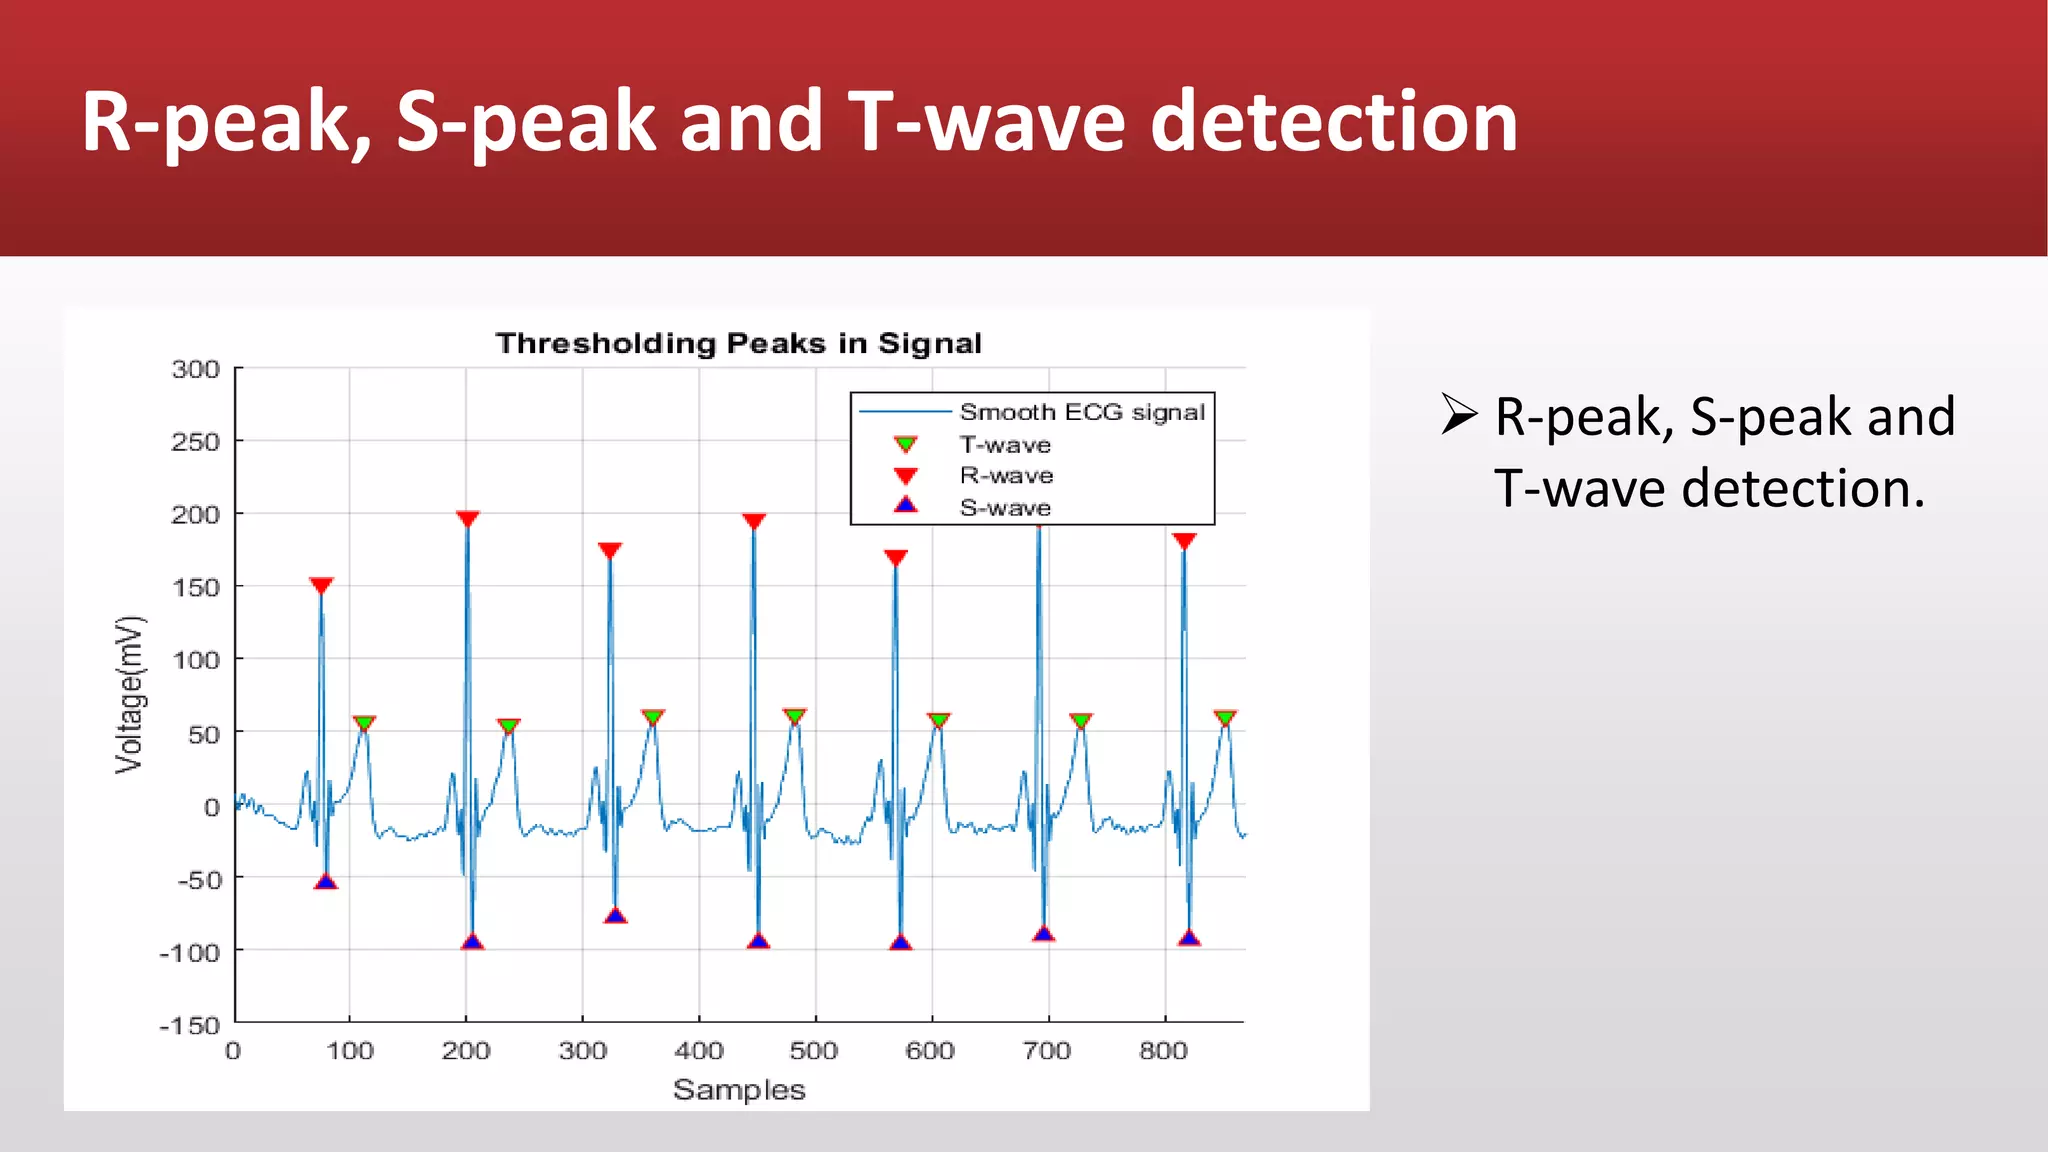
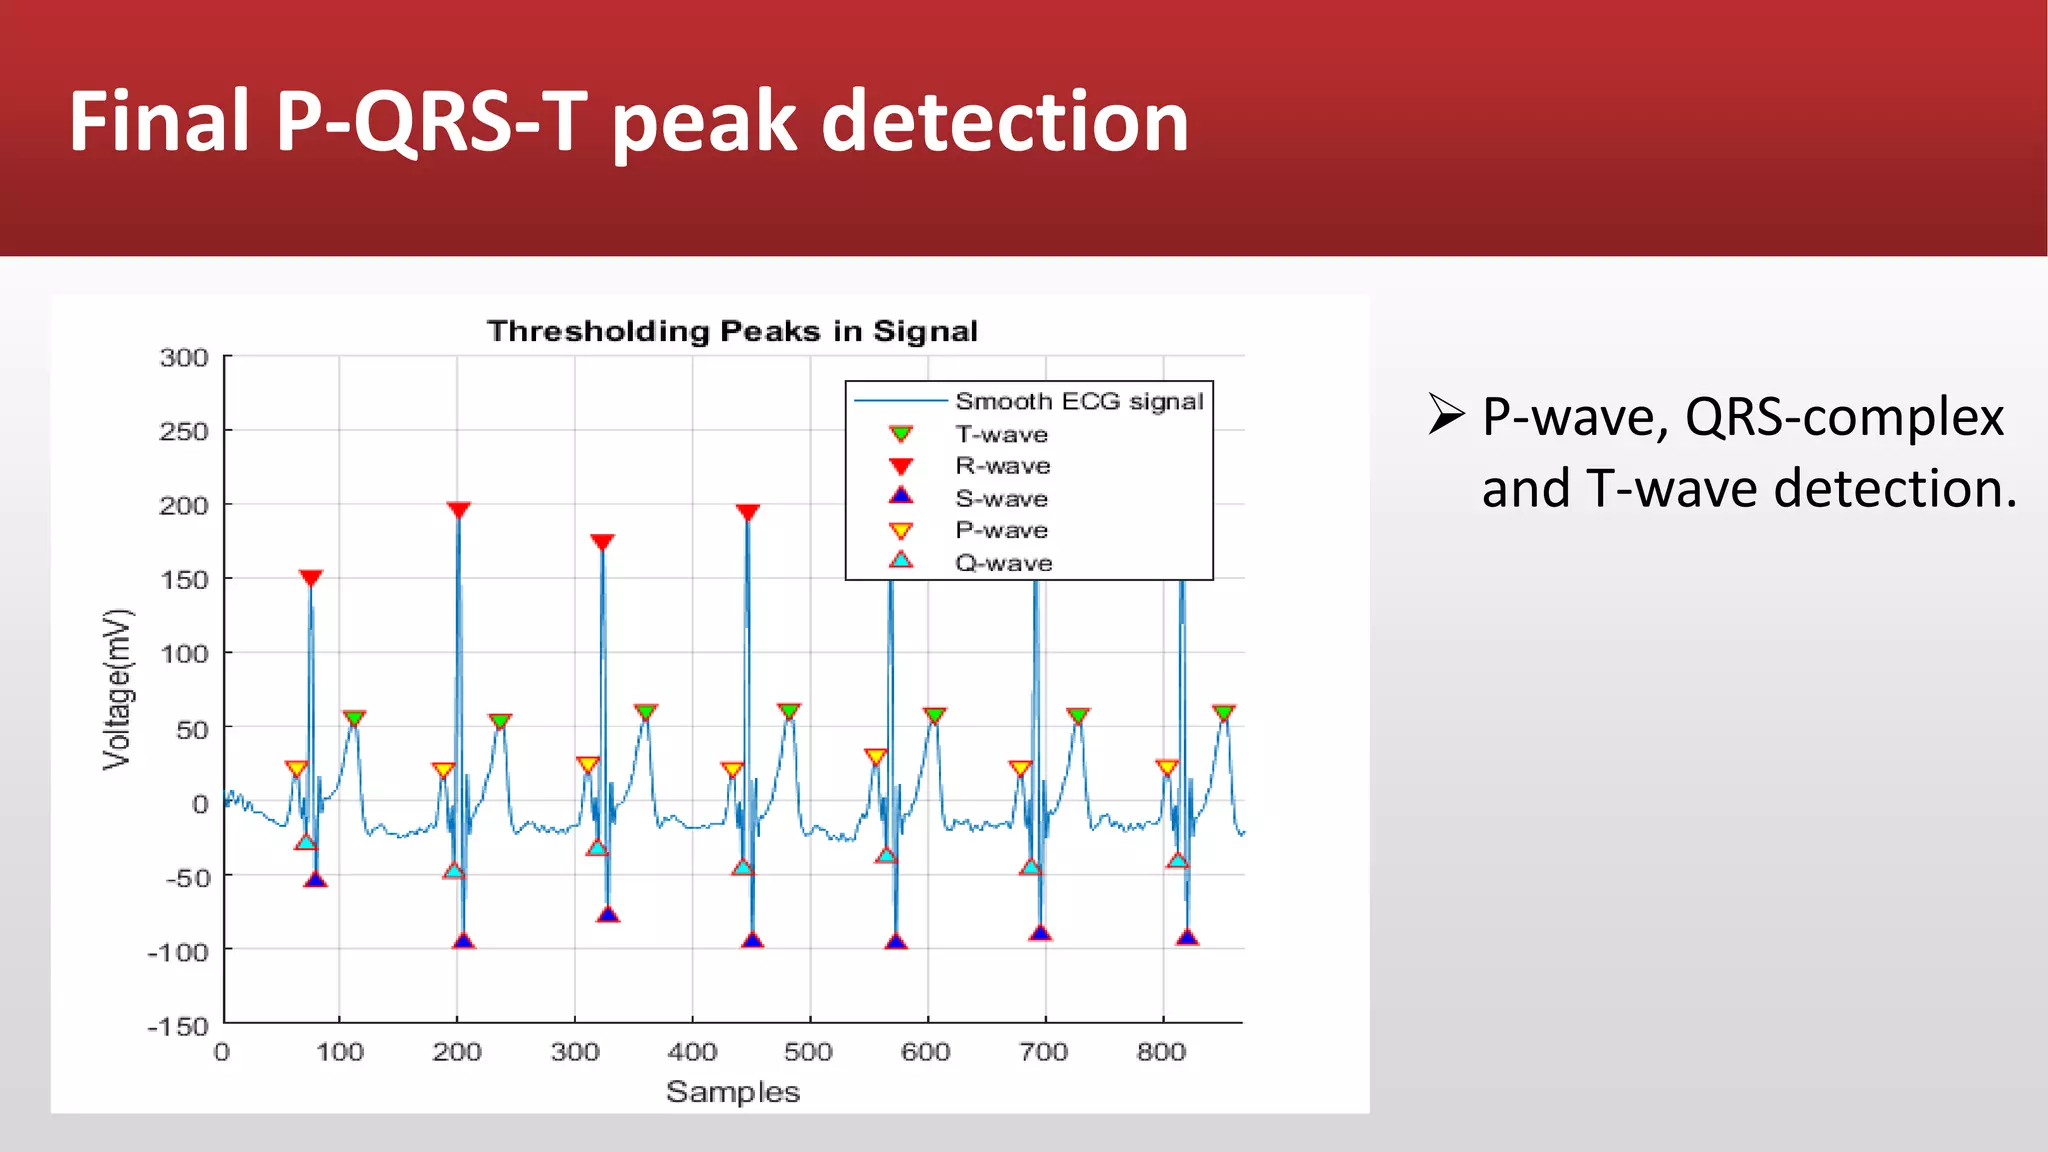
This presentation summarizes a student project on detecting P-QRS-T peaks in an electrocardiogram (ECG) signal using MATLAB. The project aims to analyze ECG records and simulate the heart's electrical activity as represented by the P-wave, QRS complex, and T-wave. The presentation discusses why ECG is important, how ECG works, and the steps used to detect the peaks, including loading an ECG file into MATLAB, filtering the signal, and detecting peaks with functions like findpeaks. The goal is to help identify cardiovascular conditions by measuring peak intervals and comparing signals to databases of abnormalities.