Download to read offline
![International Research Journal of Engineering and Technology (IRJET) e-ISSN: 2395-0056
Volume: 06 Issue: 04 | Apr 2019 www.irjet.net p-ISSN: 2395-0072
© 2019, IRJET | Impact Factor value: 7.211 | ISO 9001:2008 Certified Journal | Page 2223
R–Peak Detection of ECG Signal using Thresholding Method
Kanupriya Bittharia1, Pooja Tiwari1, Shivani Saxena2
1M.Tech VLSI Design , Banasthali Vidyapith, Banasthali, Raj.
2Department of Electronics, Banasthali Vidyapith, Banasthali, Raj. 304022
---------------------------------------------------------------------***----------------------------------------------------------------------
Abstract:- Irregularity in heart rate, called arrhythmia, may be fatal in future and can cause several heart diseases, hence,
there is a need for an automatic detection of such irregularities in the heart beat. This paper deals with the method of
thresholding used to analyze the ECG signal and detect the R-peaks to measure heart rate. The ECG data is taken from the
MIT-BIH Arrhythmia Database. The analysis is done on MATLAB software for different ECG records and finally, classified ECG
beats are used to categorize various heartbeats as normal heart rate, slow heart rate (bradycardia) and fast heart rate
(tachycardia).
Keywords: Arrhythmia, Thresholding, ECG, Heart Rate, MATLAB.
1. Introduction:
Irregularity in heart beat or rhyme, called arrhythmia, arising from disturbance, occurs in electrical activity of heart. It may
cause the origin of severe cardiac disease in future.
It has been stated by the World Health Organization (WHO) that the major cause of deaths worldwide is the increase in
heart diseases. Annually, around 17.3 million deaths worldwide take place due to different heart diseases and it has been
predicted to increase upto 23.6 million in the year 2030. Therefore, there is a need for early detection of heart diseases
and regular monitoring of heart in order to reduce the increasing number of deaths caused by cardiac diseases. [4]
For primary diagnostics purpose, Electrocardiogram (ECG) is one of the most widely used system to check condition of
heart and provides useful diagnostic information about the cardiovascular system [1]. A general ECG signal representation
is given in fig 1.
Fig 1: ECG signal [2]
The conventional clinical ECG system employs 12 or 15 lead electrodes (wet ECG), which are affixed to specific parts of
the chest, arms, or hands and legs. This often requires cleaning the attachment site and patient should be stationary
while ECG. Although this type of ECG provides good signal quality, it is inconvenient and may cause skin irritation,
allergic reactions, and inflammation due to toxicological issues of the gels in long-term treatments. Therefore, the wet
ECG electrode system may be unsuitable for long-term ECG monitoring and might require clinically experts. Now, the
health care communities are working in the direction to develop portable ECG embedded system for computation and
monitoring of heart rate in self health care. Available systems are bulky, expensive and have patient discomfort. Heart
beat can be calculated by using two parameters from an ECG signal:
1. QRS Complex
2. R-R interval](https://image.slidesharecdn.com/irjet-v6i4479-190703063533/75/IRJET-R-Peak-Detection-of-ECG-Signal-using-Thresholding-Method-1-2048.jpg)
![International Research Journal of Engineering and Technology (IRJET) e-ISSN: 2395-0056
Volume: 06 Issue: 04 | Apr 2019 www.irjet.net p-ISSN: 2395-0072
© 2019, IRJET | Impact Factor value: 7.211 | ISO 9001:2008 Certified Journal | Page 2224
Detection of P wave, T wave and QRS complex wave is difficult as ECG signal varies with time due to psychological
conditions of mind and presence of noise. R-peak can be easily detected as compared to other peaks because of its
highest amplitude.Table 1, shows various methods for detecting ECG signal.
Table 1: Various methods for detecting ECG signal
As from theabove table, we can see that thresholding is a simple technique and takes lesser time to give the
results,therefore, the proposed method used for detecting R-peak for heart rate detection is ‘thresholding’. The
threshold value is set in such a manner that only the R-peaks get detected and all other peaks which are below the
threshold value are ignored.
2. Material & methods:
The work in this project used ECG samples from MIT-BIH arrhythmia database. MIT-BIH signals have sampling frequency
of 360 Hz with 30 mins recording. The MIT-BIH Arrhythmia Database is the available set of standard test material for
evaluation of arrhythmia detectors from physio.net [12].
2.1 R-peak detection using thresholding
The threshold value of applied ECG signal depends on the incoming signal, average high amplitude peak can be labelled as
an R peak if its amplitude satisfies both the equations given below:
Author/Year Method Remark
Aditi Sengupta [3] Using adaptive thresholding. Using high order statistics (HOS)
AnggitFerditaNugraha [4] Pan-
Tompkins method
99.83% sensitivity and 0.40% total
error detection.
Harjeet Kaur [5] Hybrid linearization and principal
component analysis.
99.90% sensitivity, 99.97% positive
predictivity, error rate of 0.120%.
TasnovaTanzilKhan [6] By extracting ECG features such as P, T
wave, QRS complex, PR, QT, RR, ST
intervals and ST segment deviations.
Several conditions for arrhythmia have
been successfully detected
MG Tsipouras [7] RR interval sliding window, centred in the
middle RR interval, to classify each beat
using a rule-based approach
Performance is 95.85%
Zhongmin Lin [8] Adaptive Threshold is used to detect R-
peaks
sensitivity of 99.79% and accuracy of
99.81 %.
Amandeep Kaur [9] Hamming self-convolution window Sensitivity 99.93%, error rate 0.117%
Muhidin A. Mohamed [10] Daubechies Wavelet Transform Deviation error of less than 10%
DejanStantic and Jun Jo
[11]
Wavelet transform 100% accuracy
If amplitude(k)>amplitude(k+1) &&
amplitude(k)>amplitude(k-1) --eq1
If (peak_amplitude>threshold) --eq. 2.
display (“Prominent peak found”)](https://image.slidesharecdn.com/irjet-v6i4479-190703063533/75/IRJET-R-Peak-Detection-of-ECG-Signal-using-Thresholding-Method-2-2048.jpg)
![International Research Journal of Engineering and Technology (IRJET) e-ISSN: 2395-0056
Volume: 06 Issue: 04 | Apr 2019 www.irjet.net p-ISSN: 2395-0072
© 2019, IRJET | Impact Factor value: 7.211 | ISO 9001:2008 Certified Journal | Page 2225
where, k is the sample where R-peak is present, k+1 and k-1 are the exceeding and preceding samples of k sample
respectively, as shown in fig 2 and fig 3.
The function ‘findpeaks()’ is a predefined function in MATLAB and is used as a basis for detection of heart beat. This
function detects the local maxima (peaks) of the input signal. As shown in fig 2 and discussed previously, the comparison is
done between the peaks of two neighboring samples and then it is checked whether the peak of the sample is greater than
the peaks of its neighboring samples, if it is greater, then, the location or sample of this peak is returned as the sample
having the R-peak.
Hence, with regular comparison, the findpeaks() function helps in determining the R-peaks locations in the proposed
algorithm. R-peaks are detected by eliminating the smaller peaks in its neighbour by using amplitude thresholding.
Fig 2: Finding peaks in an ECG signal.
Fig 3: Applying threshold on amplitude of peaks.
Also, a minimum value is set in the amplitude range of R-peak as the “threshold”.Particularly for R-peak detection, the
value of threshold is 0.4 - 1mV. Samples satisfying both the equation 1 and 2 of being a peak and the threshold are detected
as R-peaks and the sample number of R-peaks is displayed on the command window as output. From the detected peaks
we calculate parameters like average RR interval that is the mean of the intervals between each pair of consecutive R-
peaks.
2.2 Measured mean RR interval:
It is the distance between two RR peaks in ECGSignal. The proposed algorithm is shown below:
where function “Interval R1,R2 is the distance between R-peaks R1 and R2”, as shown in fig 4.
mean_RR_interval=[interval(R1,R2)+interval
(R2,R3)+i
nterval(R3, R4) +....interval(Rn-1,Rn)]/n
mean_RR_interval=[interval(R1,R2)+interval
(R2,R3)+interval(R3,R4) +....interval(Rn-
1,Rn)]/n](https://image.slidesharecdn.com/irjet-v6i4479-190703063533/75/IRJET-R-Peak-Detection-of-ECG-Signal-using-Thresholding-Method-3-2048.jpg)
![International Research Journal of Engineering and Technology (IRJET) e-ISSN: 2395-0056
Volume: 06 Issue: 04 | Apr 2019 www.irjet.net p-ISSN: 2395-0072
© 2019, IRJET | Impact Factor value: 7.211 | ISO 9001:2008 Certified Journal | Page 2226
Fig 4: An example of calculation of average R-R interval of an ECG sample.
2.3 Heart Rate Calculation:
The heart rate is the beat count (number of R-peaks found) per minute. The features extracted above can be used to give
heart rate as; From RR interval, the heart rate can be determined as:
2.4 Heart Rate Classification:
Based on the values of the features extracted (R-peaks and RR interval and heart rate) from the ECG waveform,
classification conditions were formed. On the basis of the heart rate, set of three conditions is formed on the basis of
arrhythmias. The three arrhythmia classification conditions are: [13]
Using these conditions, detection of different types of arrhythmia is possible according to the heartbeat, signal is thus
classified as bradycardia, tachycardia and normal.
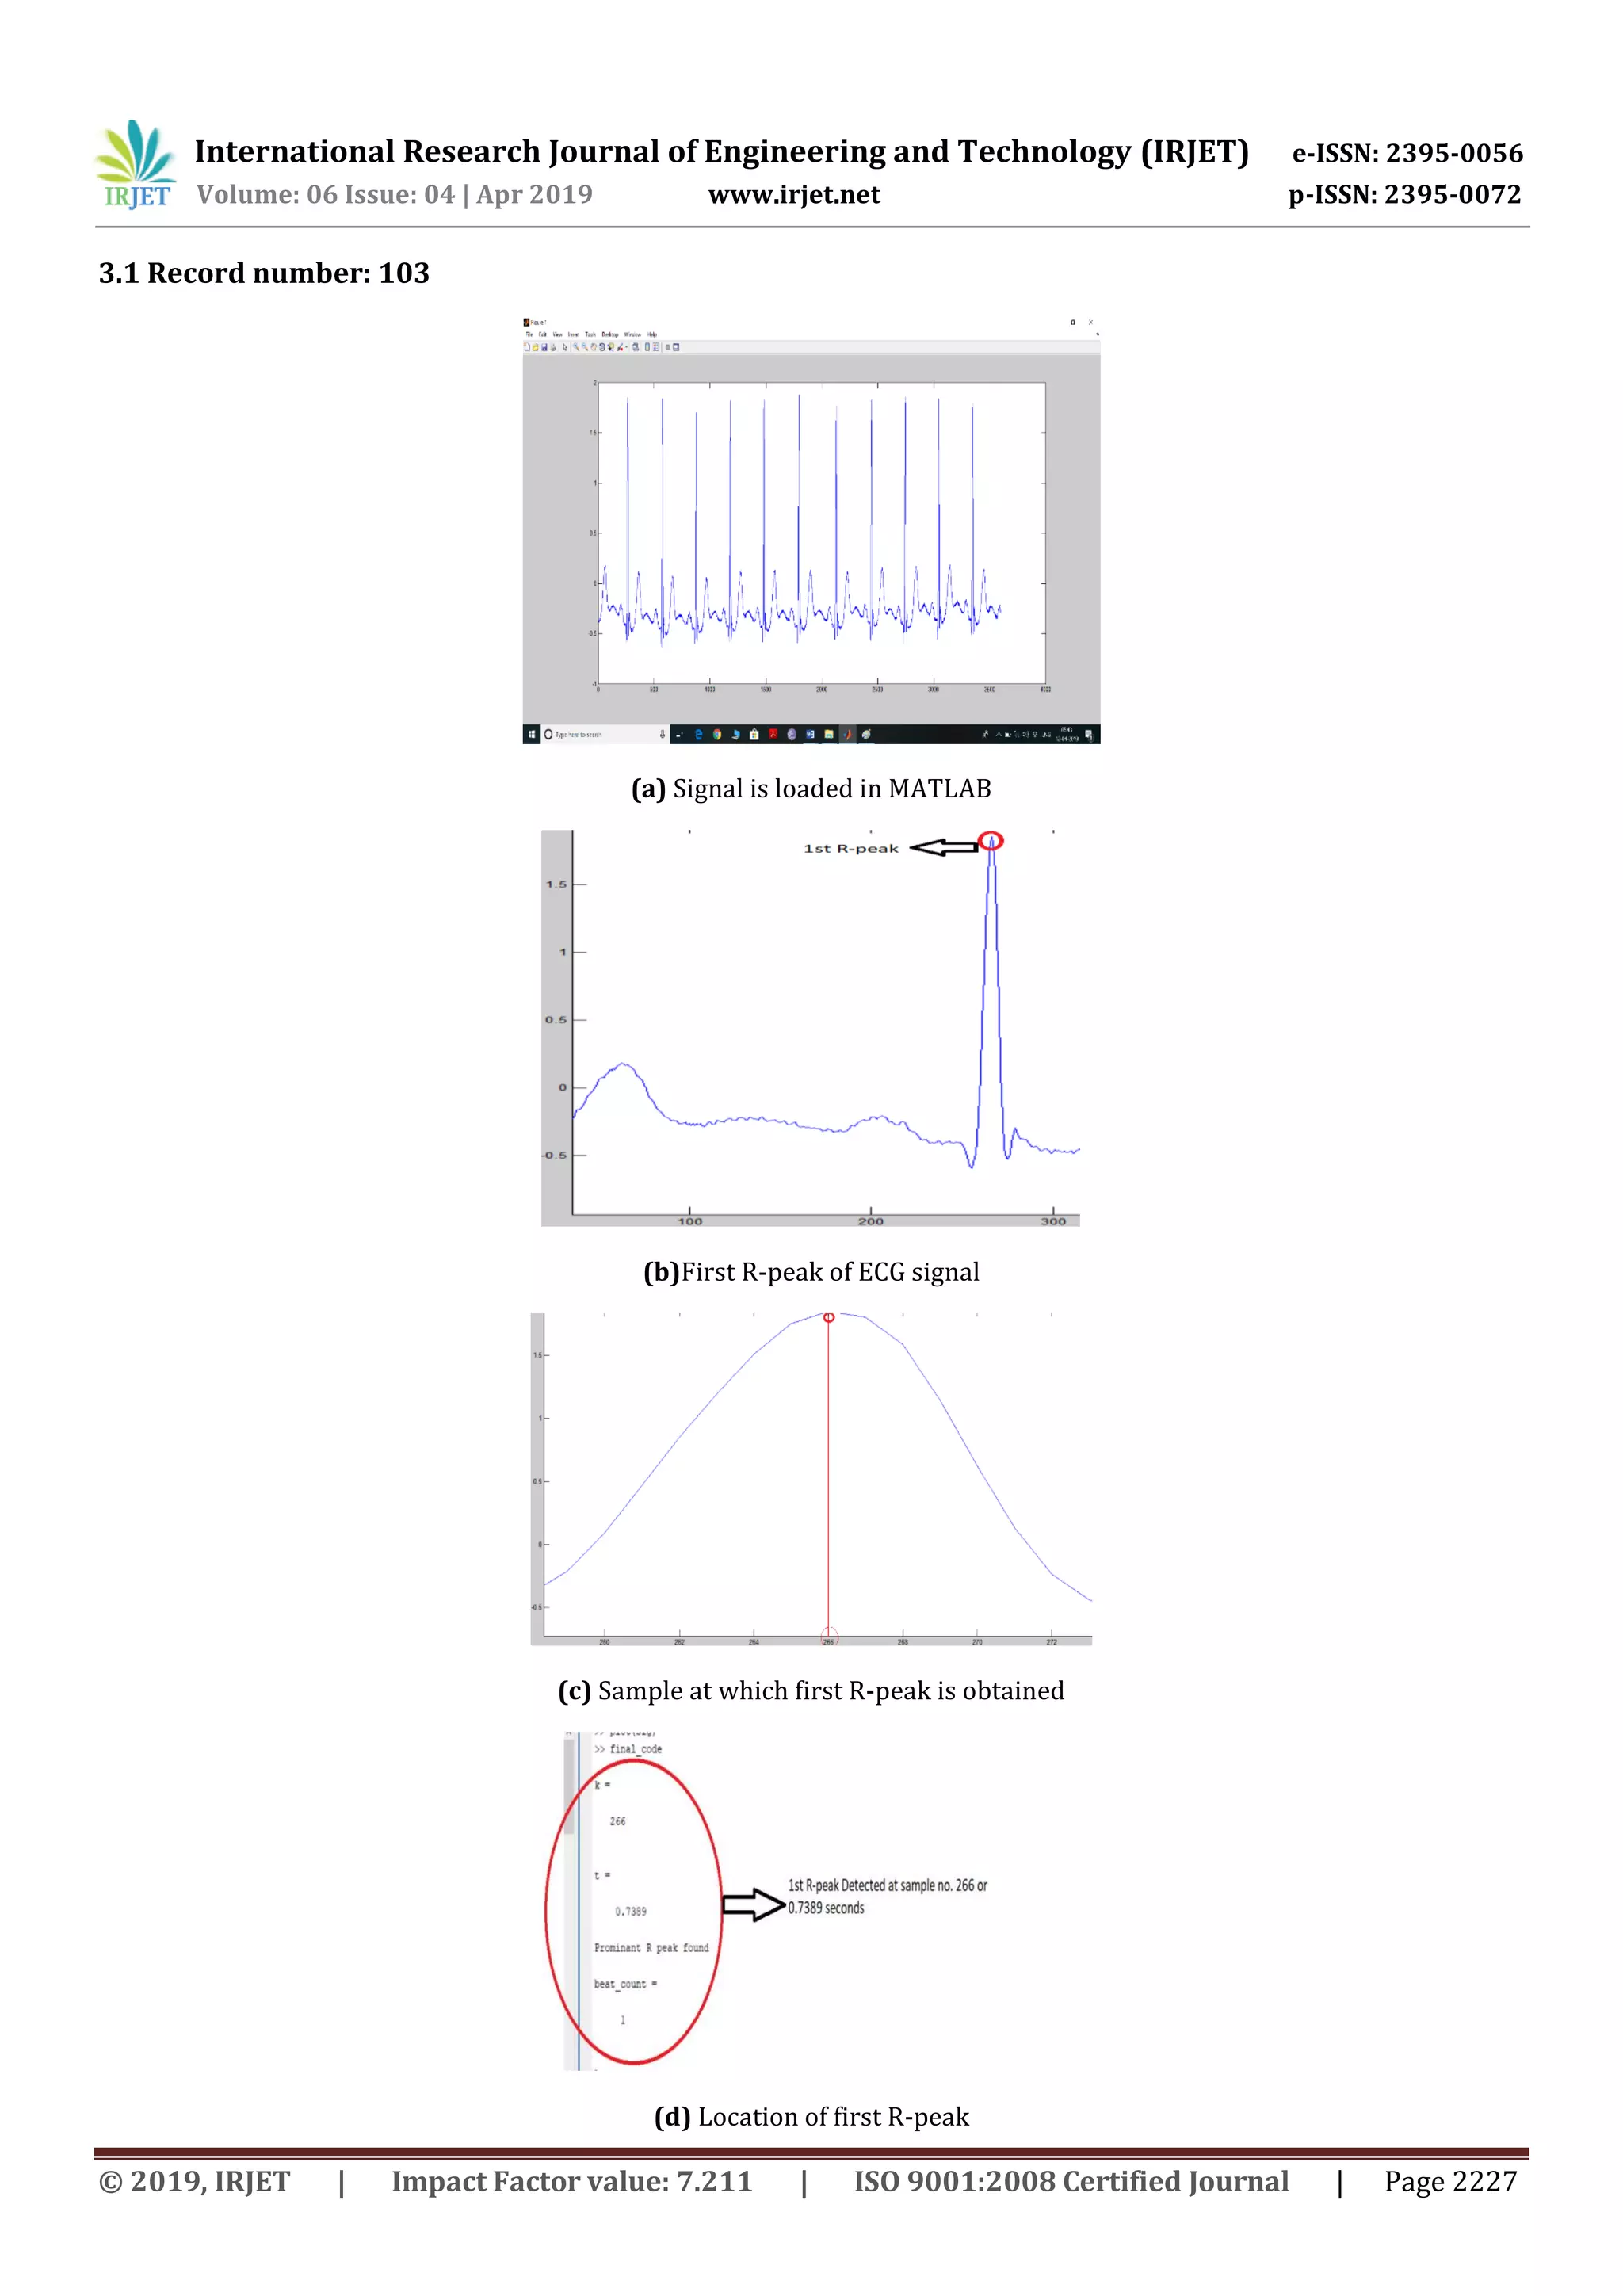
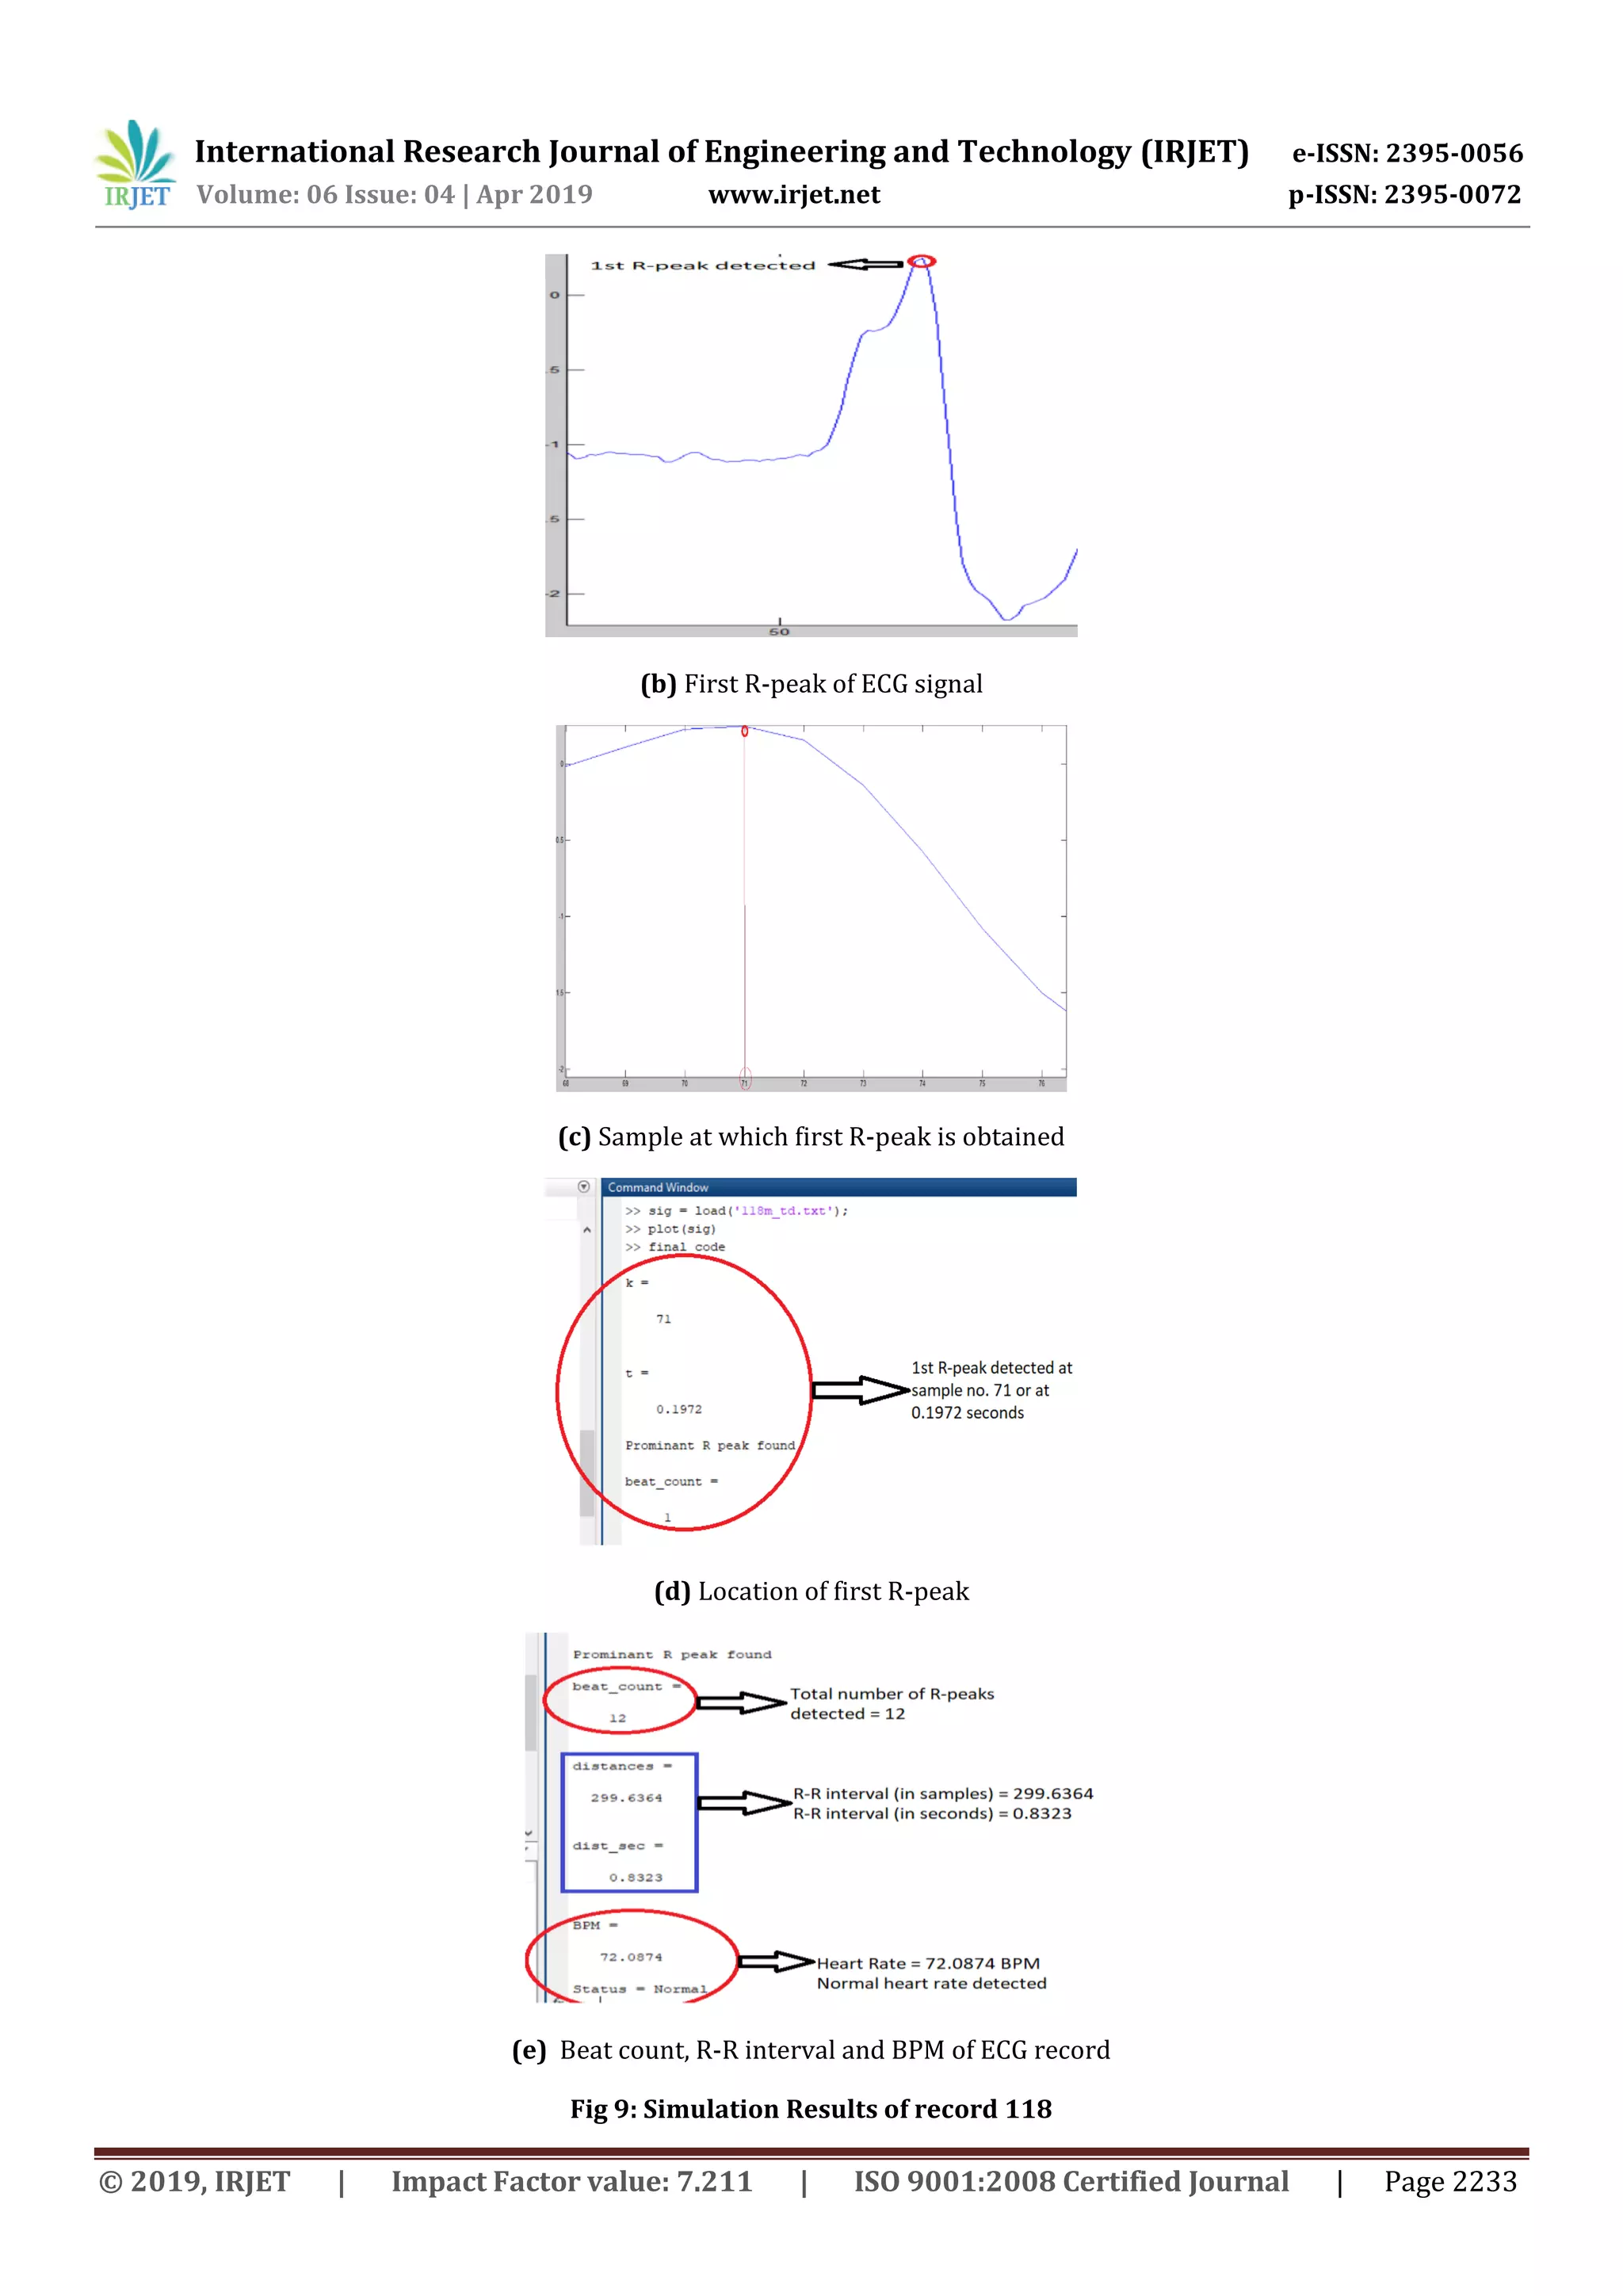
3. Experimentation:
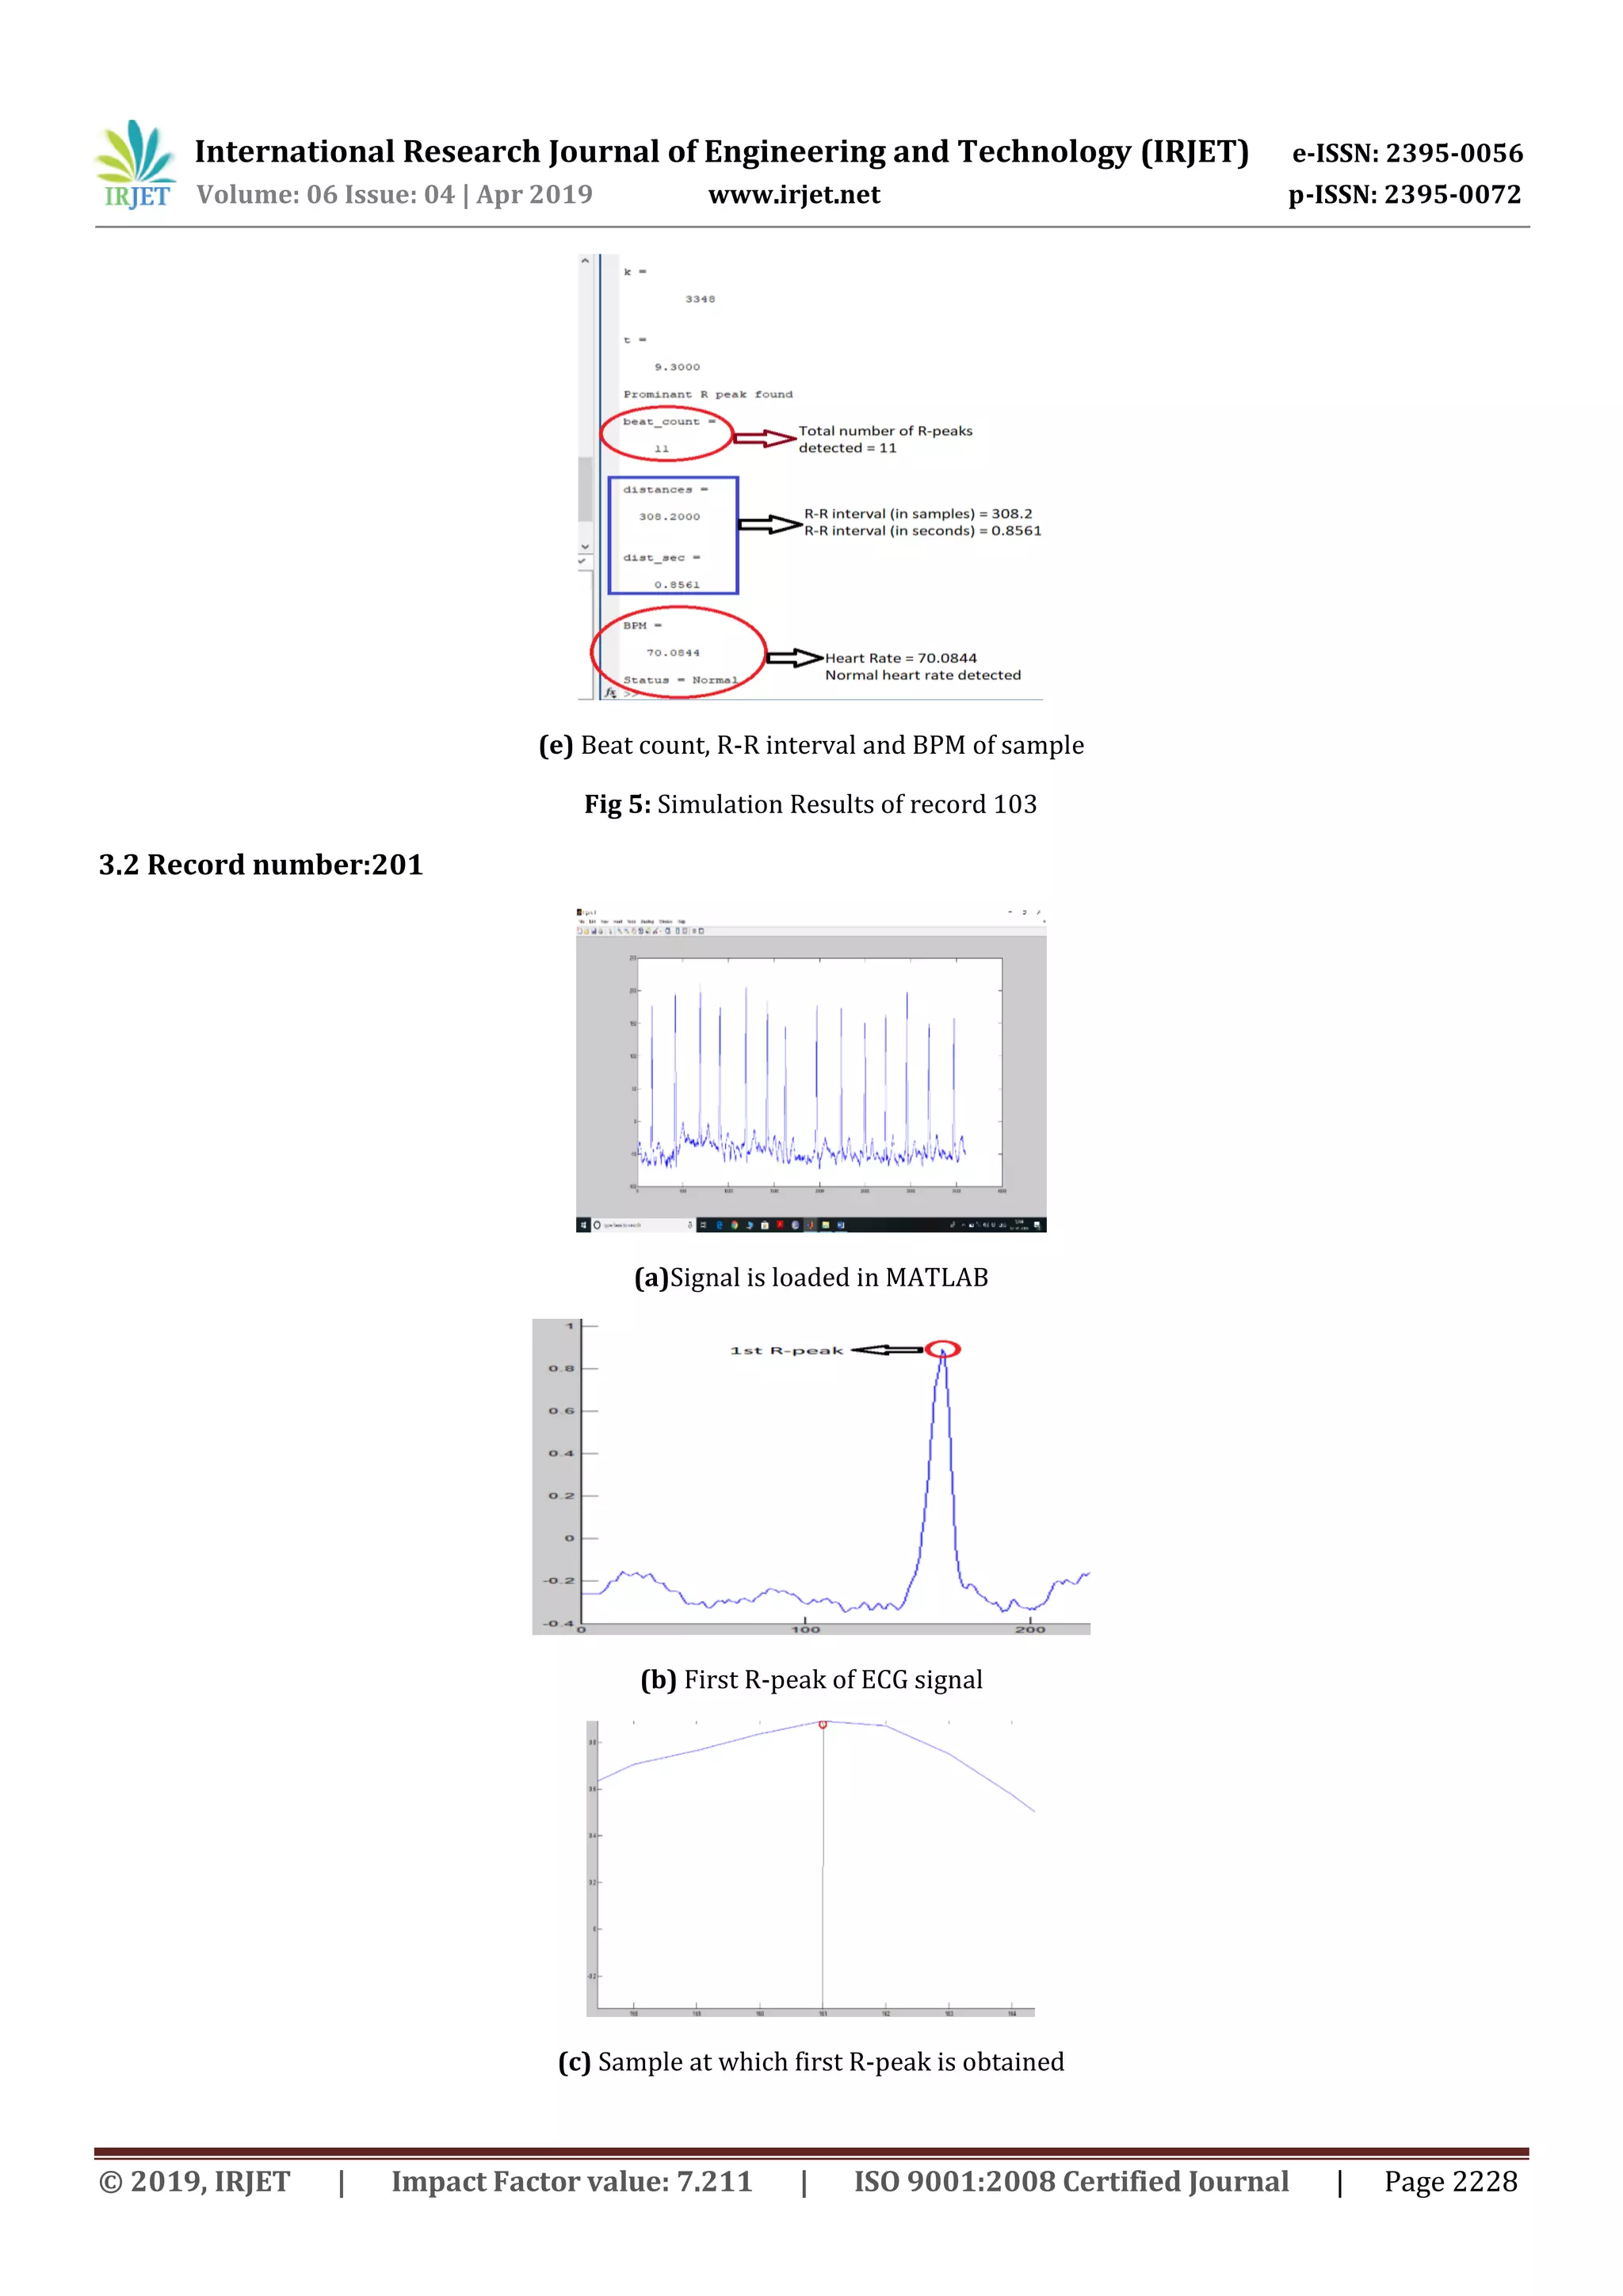
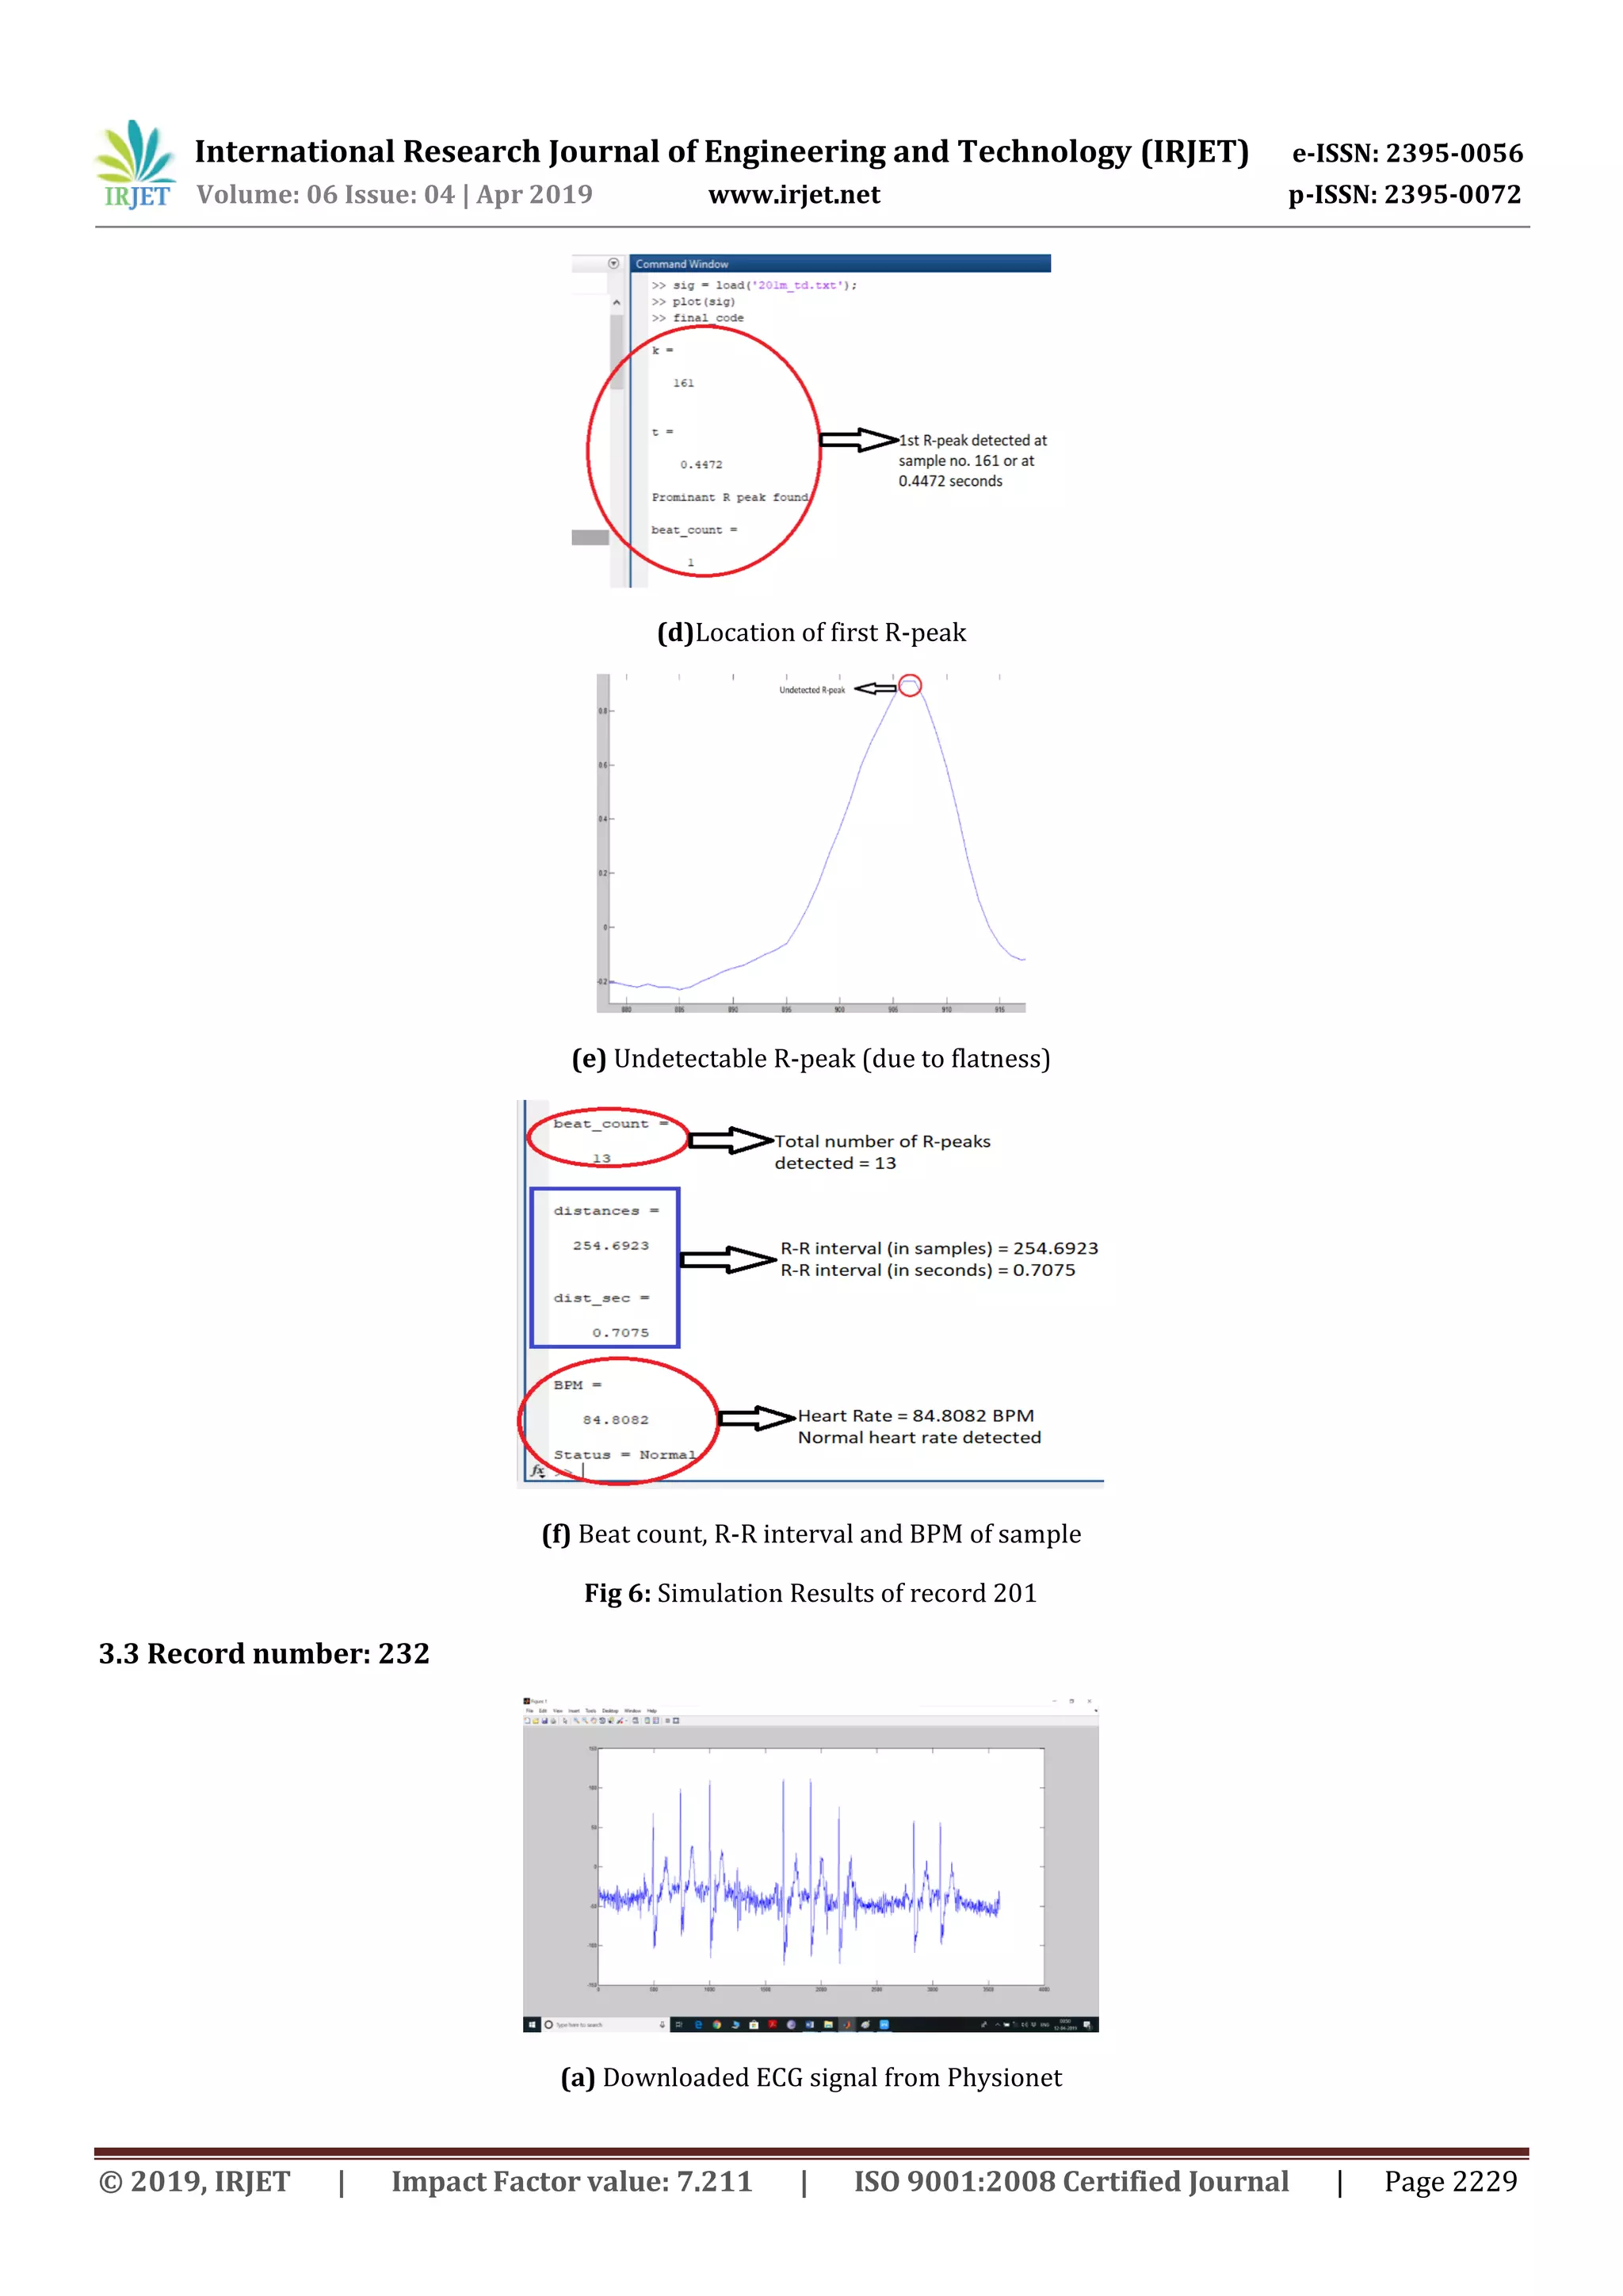
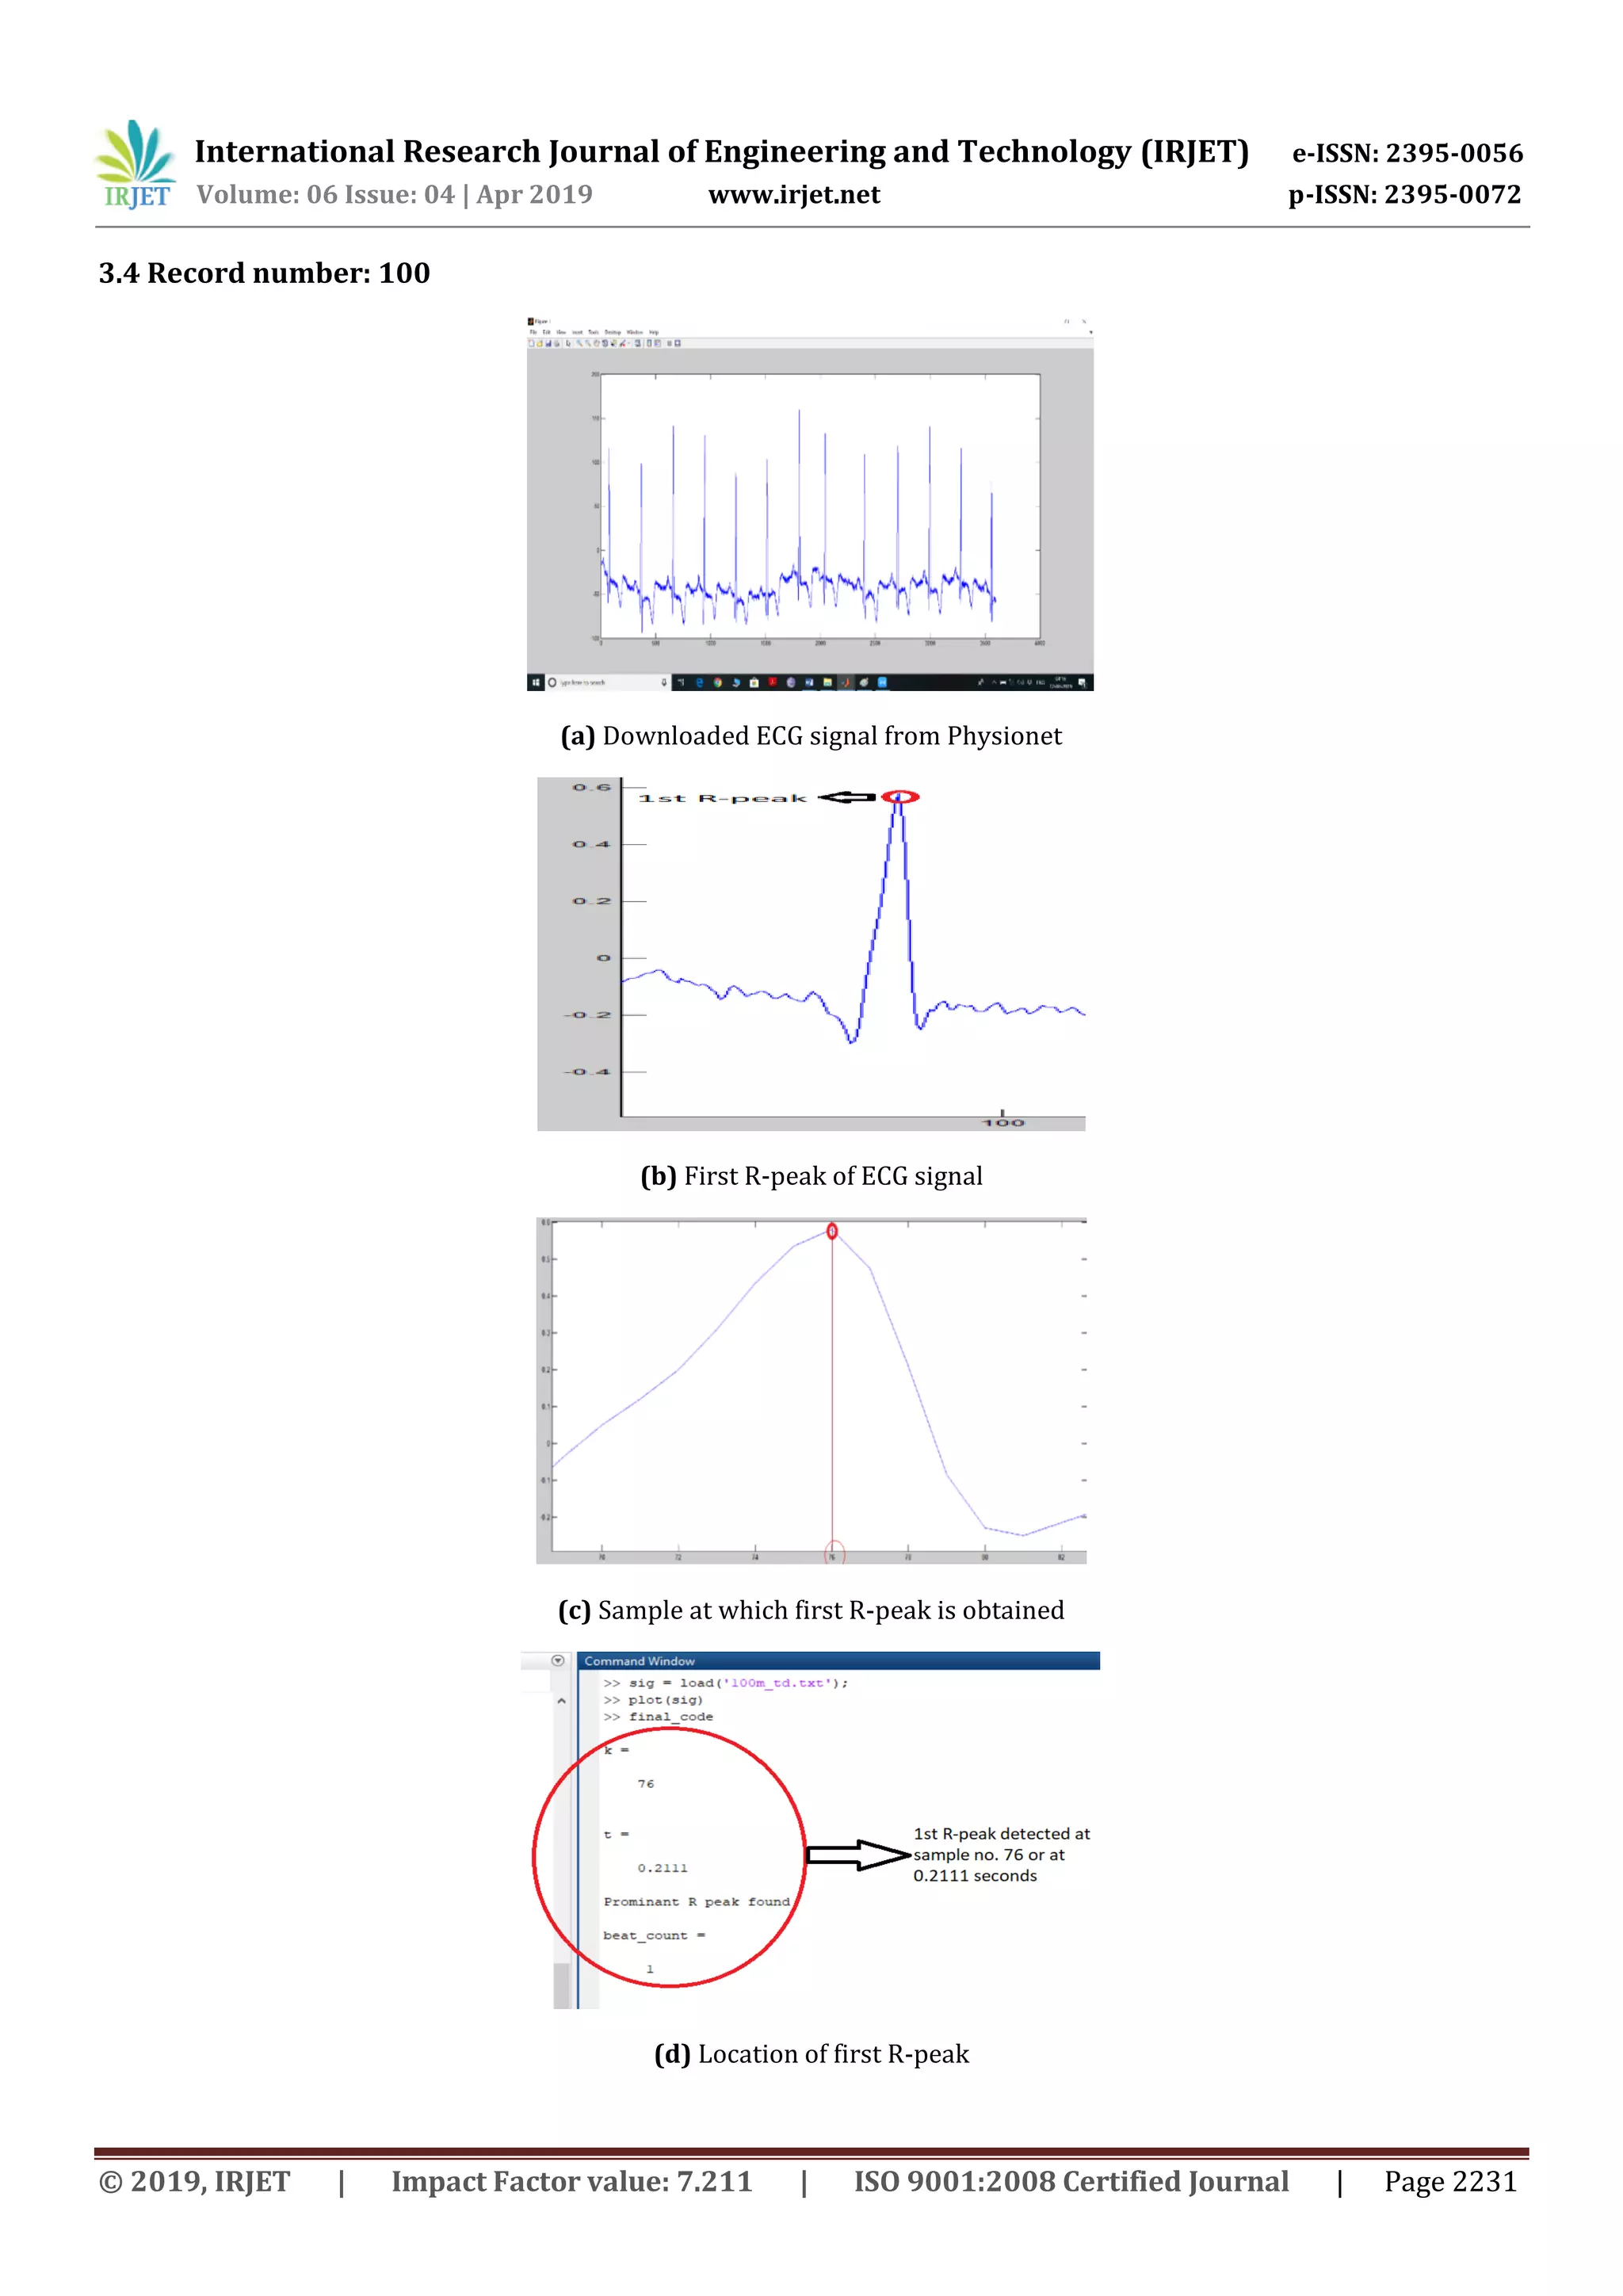
The simulation results of some records from MITDB are shown in figures given below. Using certain MATLAB code, the
results are obtained for these records.
If (bpm<60)
display (“
Bradycardia”);
if (bpm>100)
display (“Tachycardia”);
if(60<bpm<100)
display(“Normal”);](https://image.slidesharecdn.com/irjet-v6i4479-190703063533/75/IRJET-R-Peak-Detection-of-ECG-Signal-using-Thresholding-Method-4-2048.jpg)

![International Research Journal of Engineering and Technology (IRJET) e-ISSN: 2395-0056
Volume: 06 Issue: 04 | Apr 2019 www.irjet.net p-ISSN: 2395-0072
© 2019, IRJET | Impact Factor value: 7.211 | ISO 9001:2008 Certified Journal | Page 2234
Conclusions:
From the simulation results of ECG signals using thresholding, the complexity of the technique and generated data,
simulation time are greatly reduced as compared to the other methods. But the limitation of this technique is that it cannot
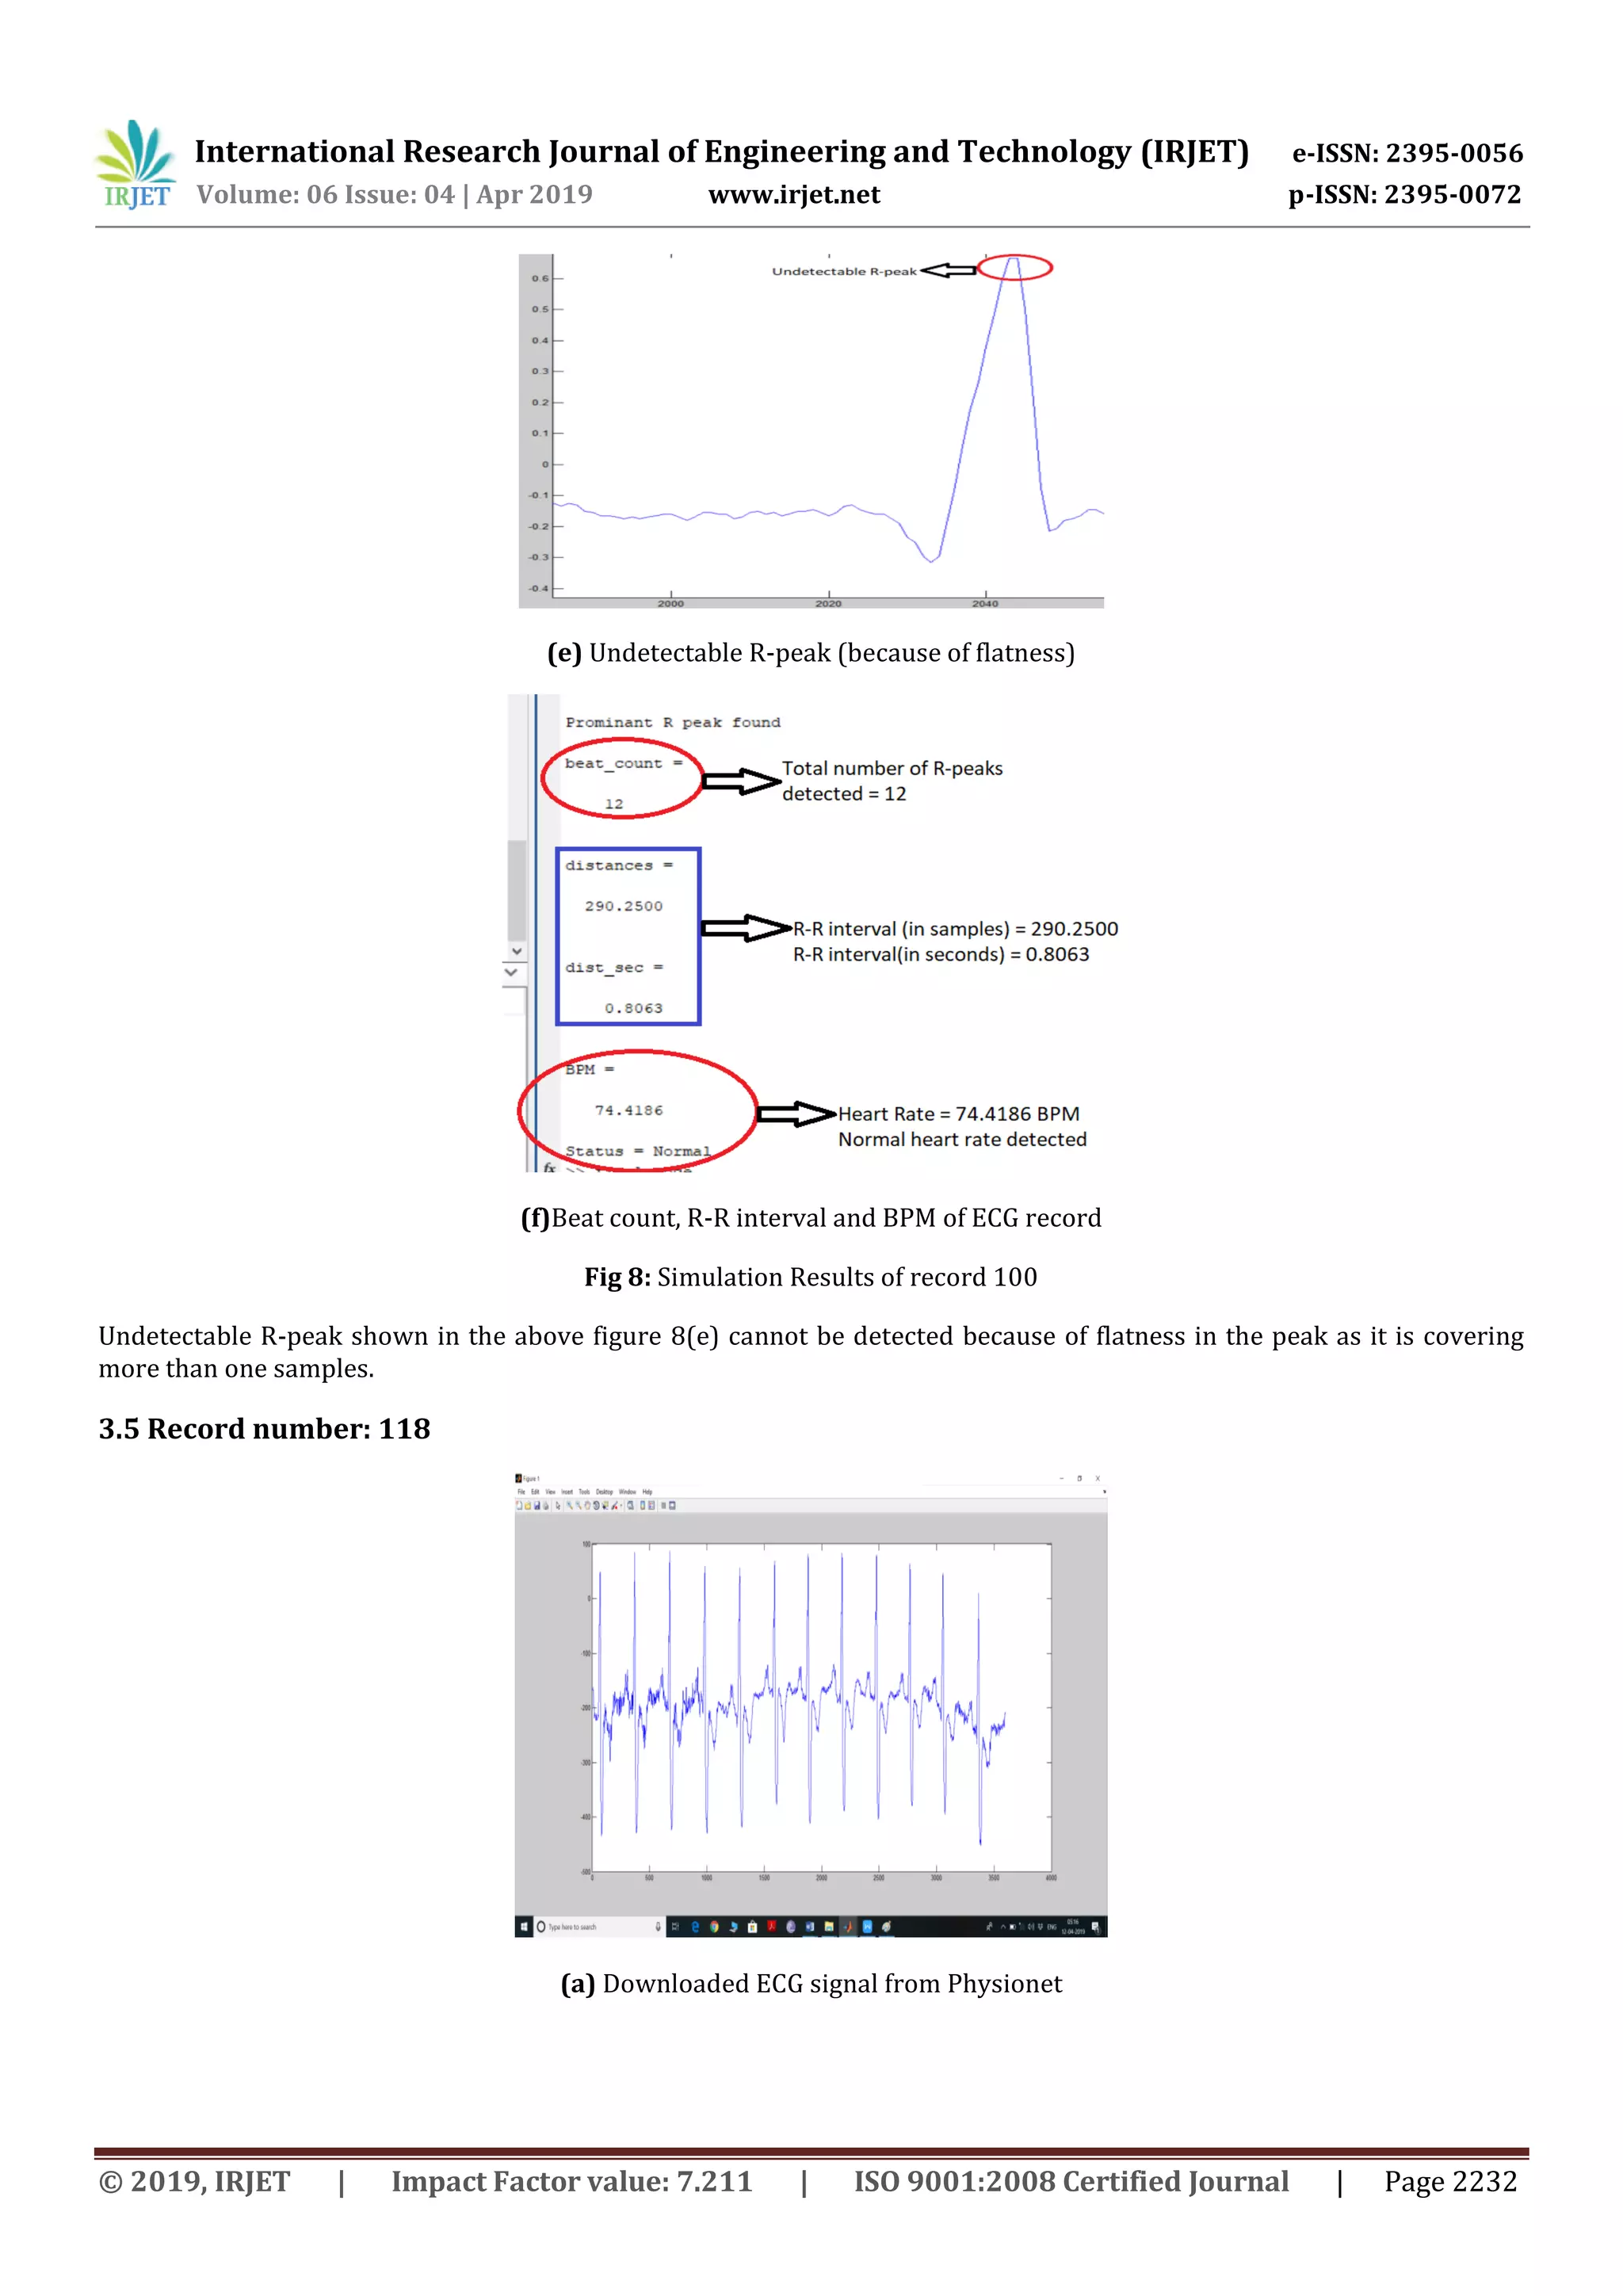
be used for diagnostic purposes, because if there is a flattening of R-peak in the ECG signal, thepeak will not be detected
and can get missed. This limits the accuracy of proposed method, butit can be easily employed for research purposes
where several results can be approximately generated in a short span of time.
REFERENCES:
[1] Ebrahim Nemati, M. Jamal Deen, and Tapas Mondal, “A Wireless Wearable ECG Sensor for Long-Term Applications”,
IEEE Communications Magazine, 2012, pp 36-43.
[2] Rachid Raddadi , ElhassaneAbdelmounim, Mustapha EI Ranine , Abdelaziz Belaguid LP, “Discrete Wavelet Transform
Based Algorithm For Recognition Of QRS Complexes”, 2014 International Conference on Multimedia Computing and
Systems (ICMCS) IEEE, 2014.
[3] Aditi Sengupta, “Heart Rate Calculation by Detection of R Peak”, International Journal of Recent Trends in Engineering
& Research (IJRTER) Volume 04, Issue 06; June – 2018.
[4] Anggit Ferdita Nugraha, BrahmantyaAjiPramudita, Noor AkhmadSetiawan, Hanung Adi Nugroho, “R-peaks detection
method for classifying arrhythmia disorder”, J Med Sci, Volume 49, No. 4, 2017 October: 1-9.
[5] Harjeet KAUR, Rajni RAJNI, “Electrocardiogram signal analysis for R-peak detection and denoising with hybrid
linearization and principal component analysis”, Turk J Elec Eng& Comp Sci (2017) 25.
[6] Tasnova Tanzil Khan, Nadia Sultana, RezwanaBinte Reza and Raqibul Mostafa “ECG Feature Extraction in Temporal
Domain and Detection of Various Heart Conditions”, 2nd Int'l Conf. on Electrical Engineering and Information &
Communication Technology (ICEEICT), IEEE, 2015.
[7] MG Tsipouras, DI Fotiadis, D Sideris, “Arrhythmia Classification using the RR-Interval Duration Signal”,IEEE,2002, pp
485-488.
[8] Zhongmin Lin, Bo Wang*, Hao Chen, Ying Zhang, Xin-An Wang, “DESIGN AND IMPLEMENTATION OF A HIGH QUALITY
R-PEAK DETECTION ALGORITHM”, 2017 China Semiconductor Technology International Conference (CSTIC), IEEE, 2017
[9] Amandeep Kaur, Alpana Agarwal, Ravinder Agarwal , Sanjay Kumar “A Novel Approach to ECG R-Peak Detection” ,
Arabian Journal for Science and Engineering , 2018.
[10] Muhidin A. Mohamed, Mogadishu, Somalia and Mohamed A. Deriche ,“An Approach for ECG Feature Extraction using
Daubechies 4 (DB4) Wavelet”, International Journal of Computer Applications Volume 96-No. 12, June 2014.
[11] DejanStantic and Jun Jo,“Detecting Abnormal ECG Signals Utilising Wavelet Transform and Standard Deviation”,
International Journal of Biomedical and Biological Engineering Vol:6, No:11,2012.
[12] MIT-BIH database, https://physionet.org/cgi-bin/atm/ATM
[13] Tanoy Debnath, Md. Mehedi Hasan, Tanwi Biswas, “Analysis of ECG Signal and Classificationof Heart Abnormalities
Using Artificial Neural Network”, 9th International Conference on Electrical and Computer Engineering, IEEE, 2016.](https://image.slidesharecdn.com/irjet-v6i4479-190703063533/75/IRJET-R-Peak-Detection-of-ECG-Signal-using-Thresholding-Method-12-2048.jpg)

This document presents a method for detecting R-peaks in an electrocardiogram (ECG) signal using thresholding to measure heart rate. The method analyzes ECG data from the MIT-BIH Arrhythmia Database using MATLAB. It detects R-peaks by applying amplitude thresholds to identify peaks above neighboring samples and a minimum amplitude. Detected R-peaks are used to calculate the average RR interval and classify heart rate as normal, bradycardia (slow), or tachycardia (fast). The method is tested on several ECG records and can approximate results quickly but has limitations and is not intended for diagnosis due to potential missed detections of flattened R-peaks.