Downloaded 265 times

![[1] Autocorrelation of energy signal
Autocorrelation function of signal energy](https://image.slidesharecdn.com/ecg-131129080920-phpapp01/75/ECG-25-2048.jpg)
![[2] Thresholding of energy signal](https://image.slidesharecdn.com/ecg-131129080920-phpapp01/75/ECG-26-2048.jpg)
![More about Digital Signal
Processors
Texas Instruments [TI] is a pioneer producer of DSPs.
The TMS320C5515 is the most widely used DSP in
Electro-Cardiograms owing to its good performance and
low power consumption.
The TM 320C5515 Digital signal processor (DS ) board
S
P](https://image.slidesharecdn.com/ecg-131129080920-phpapp01/75/ECG-28-2048.jpg)


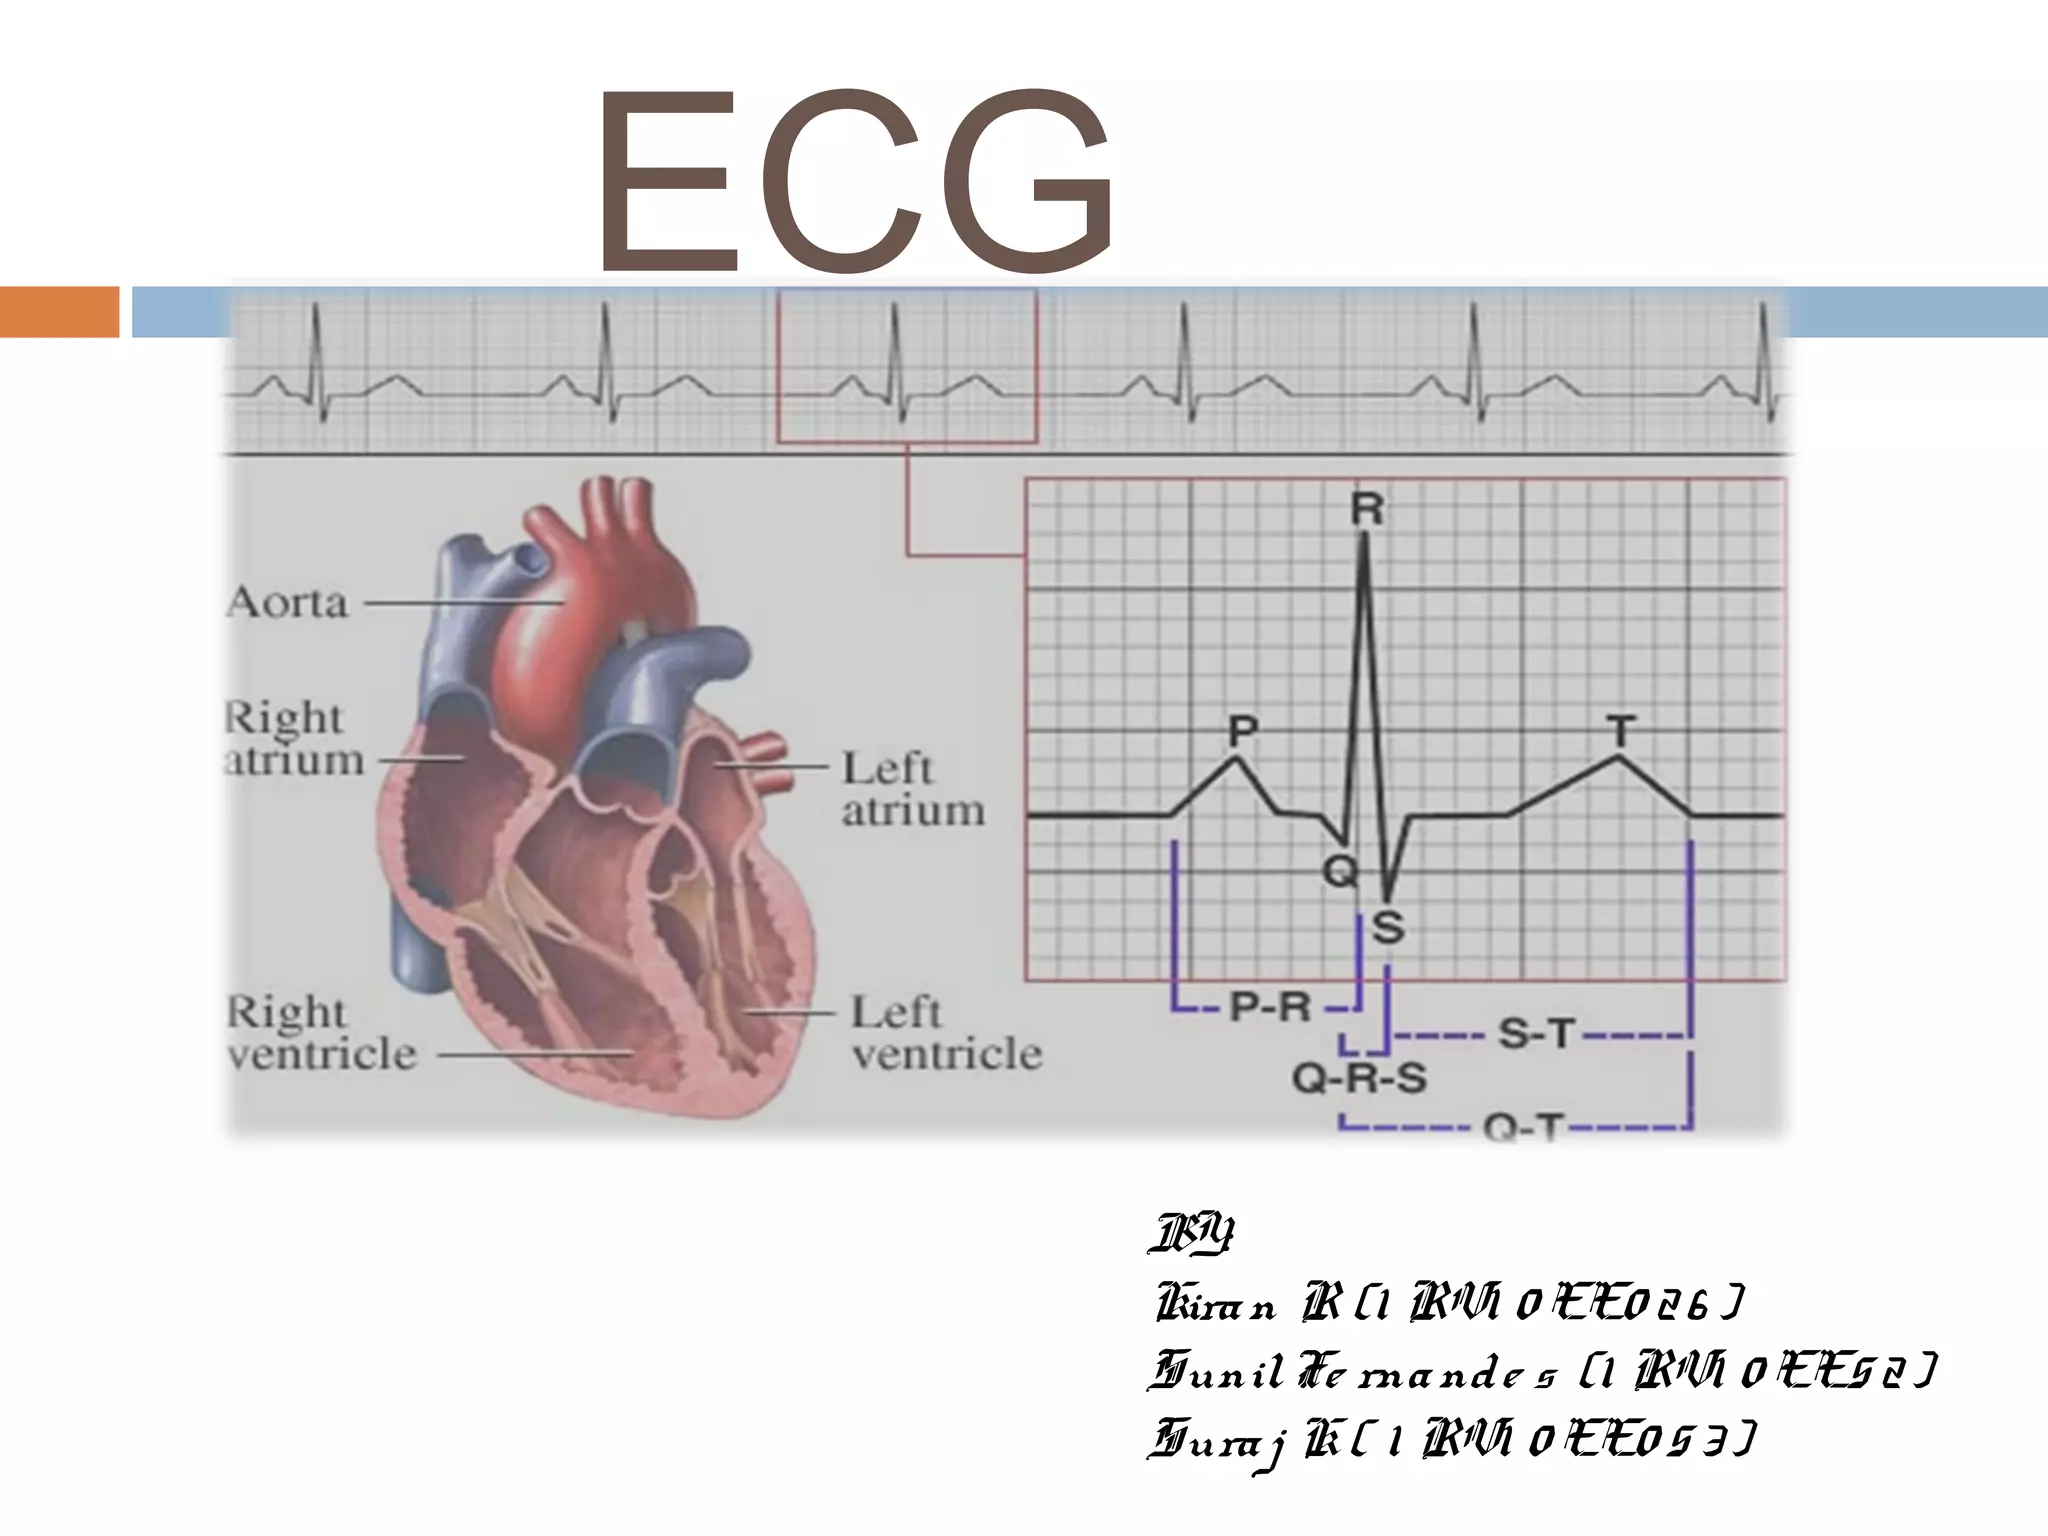
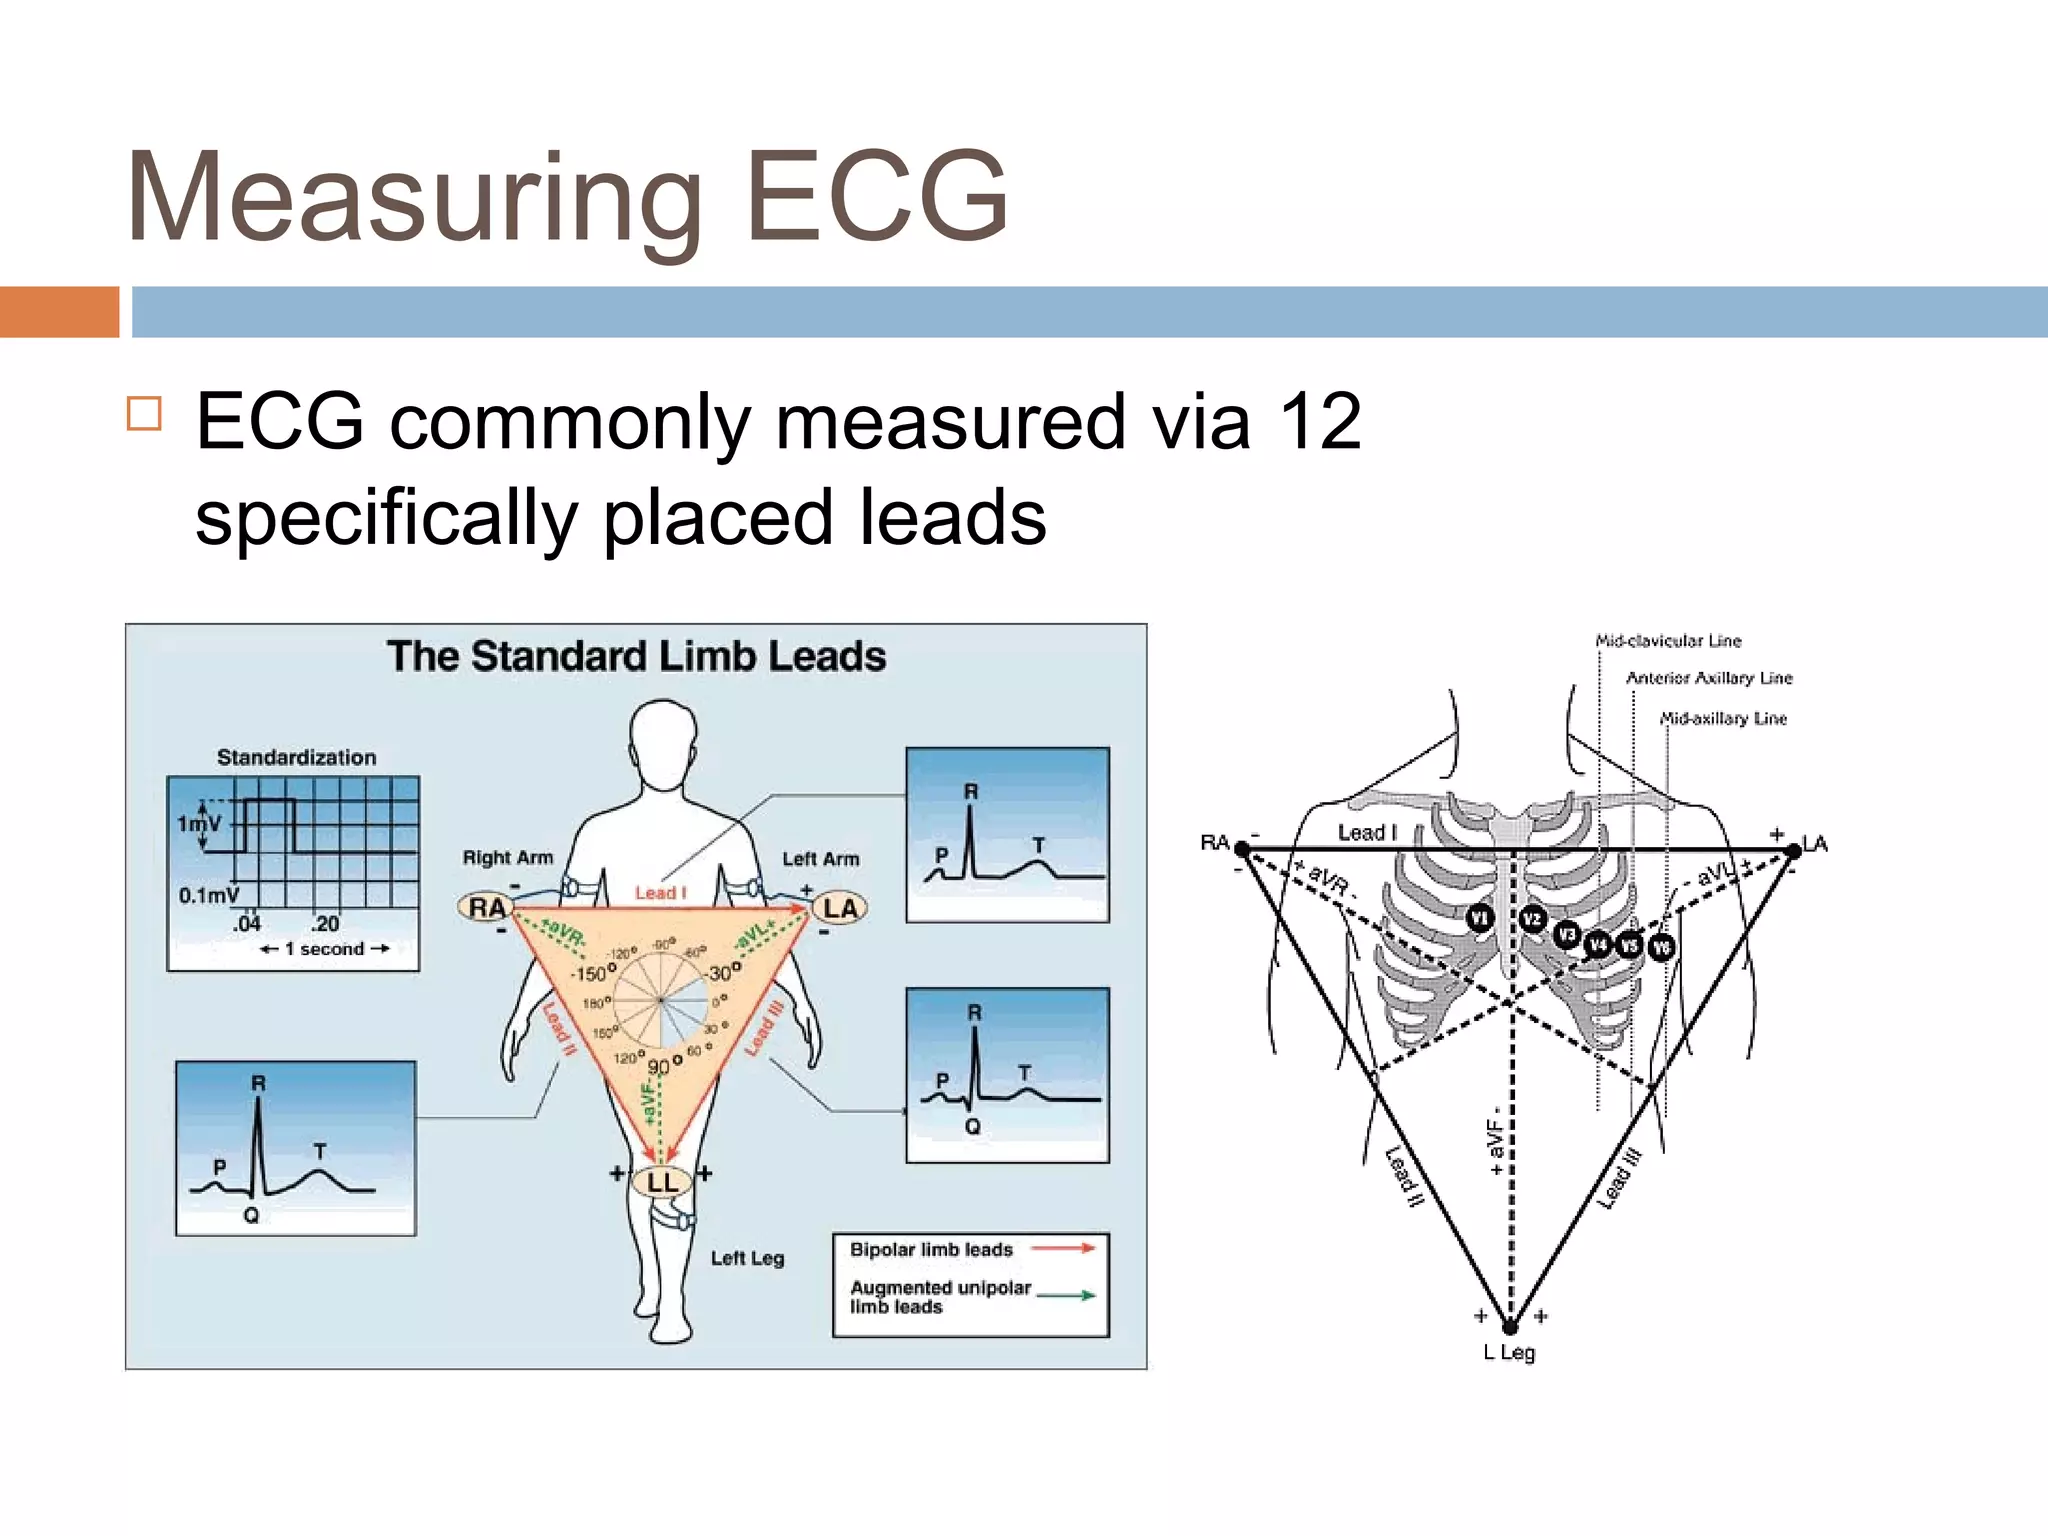
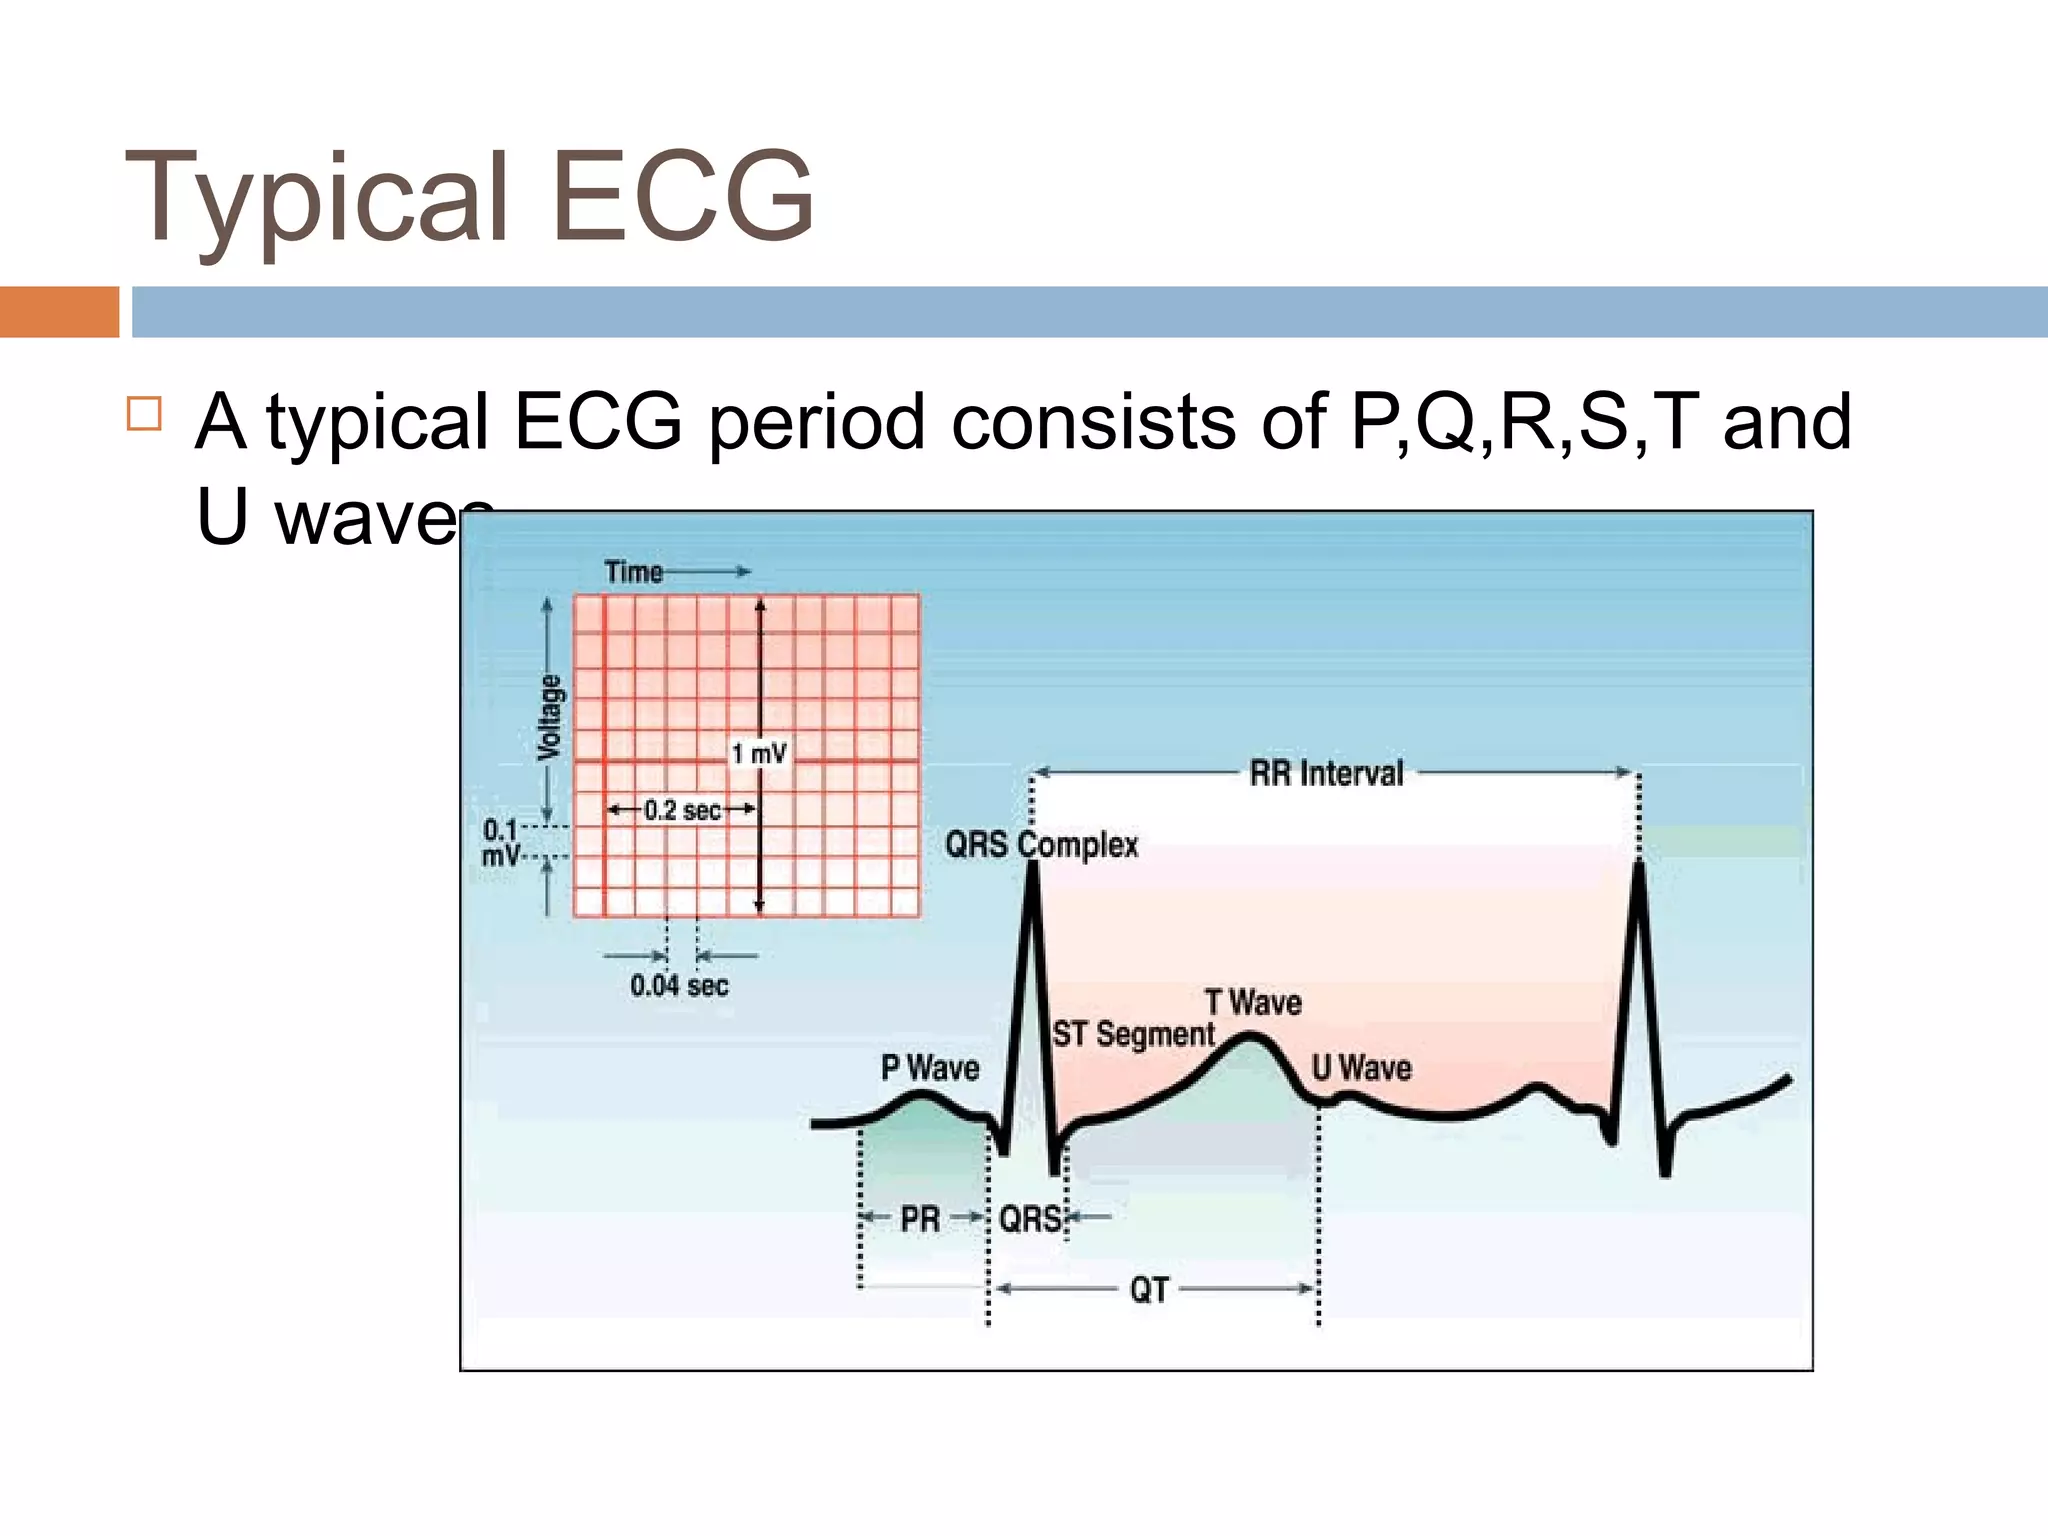
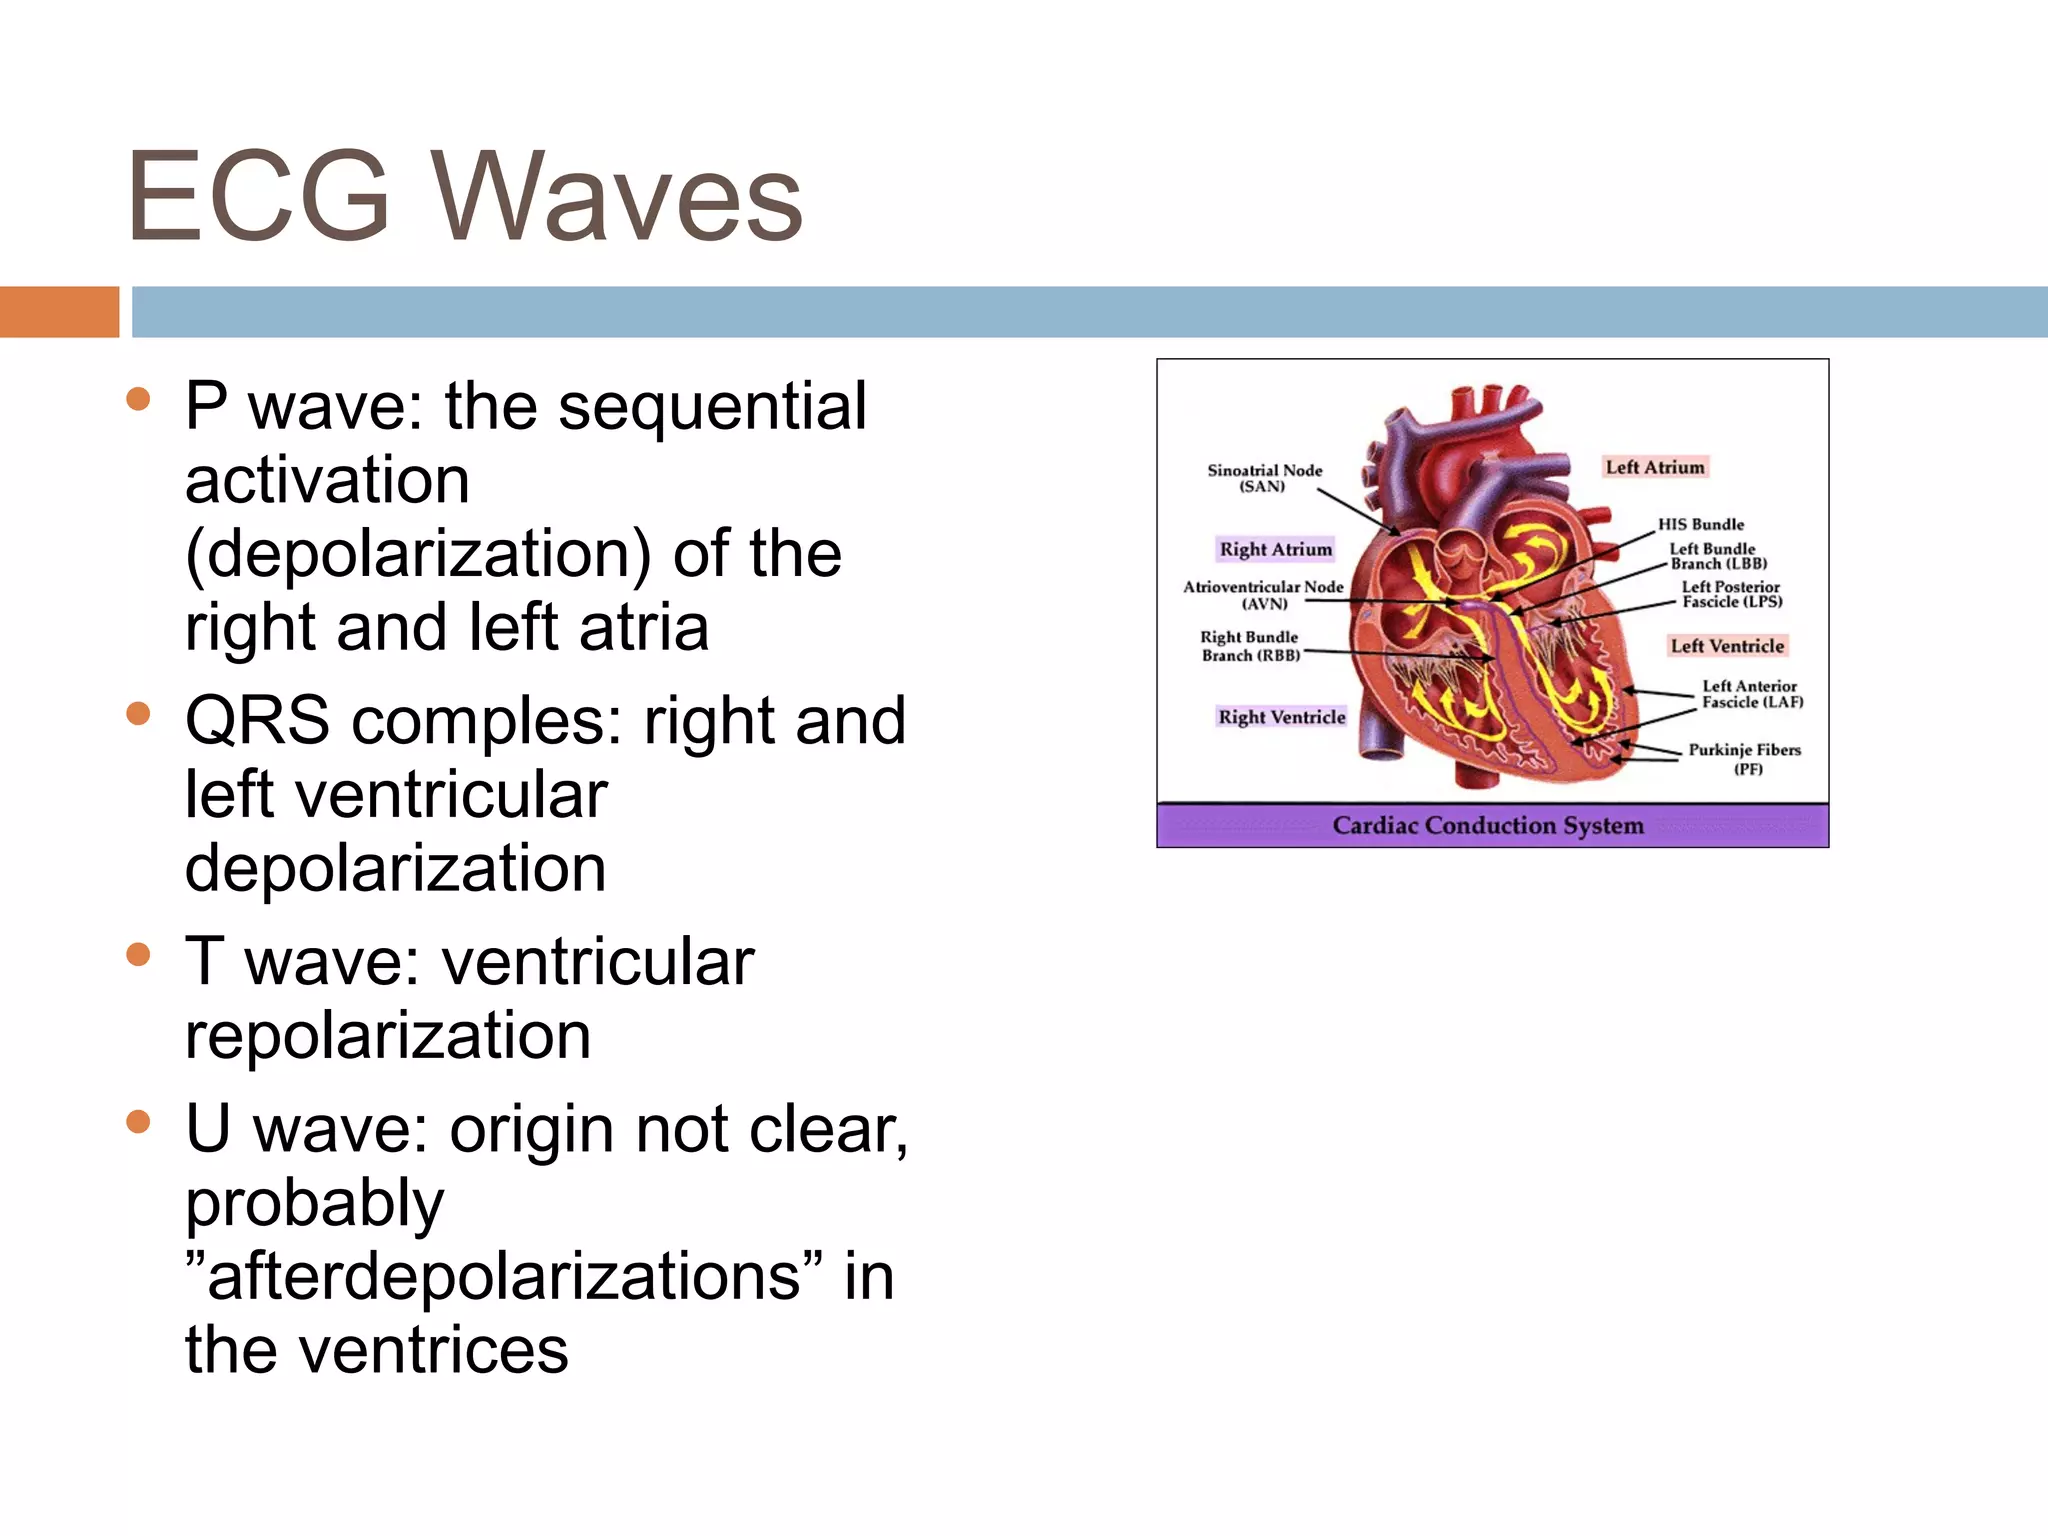
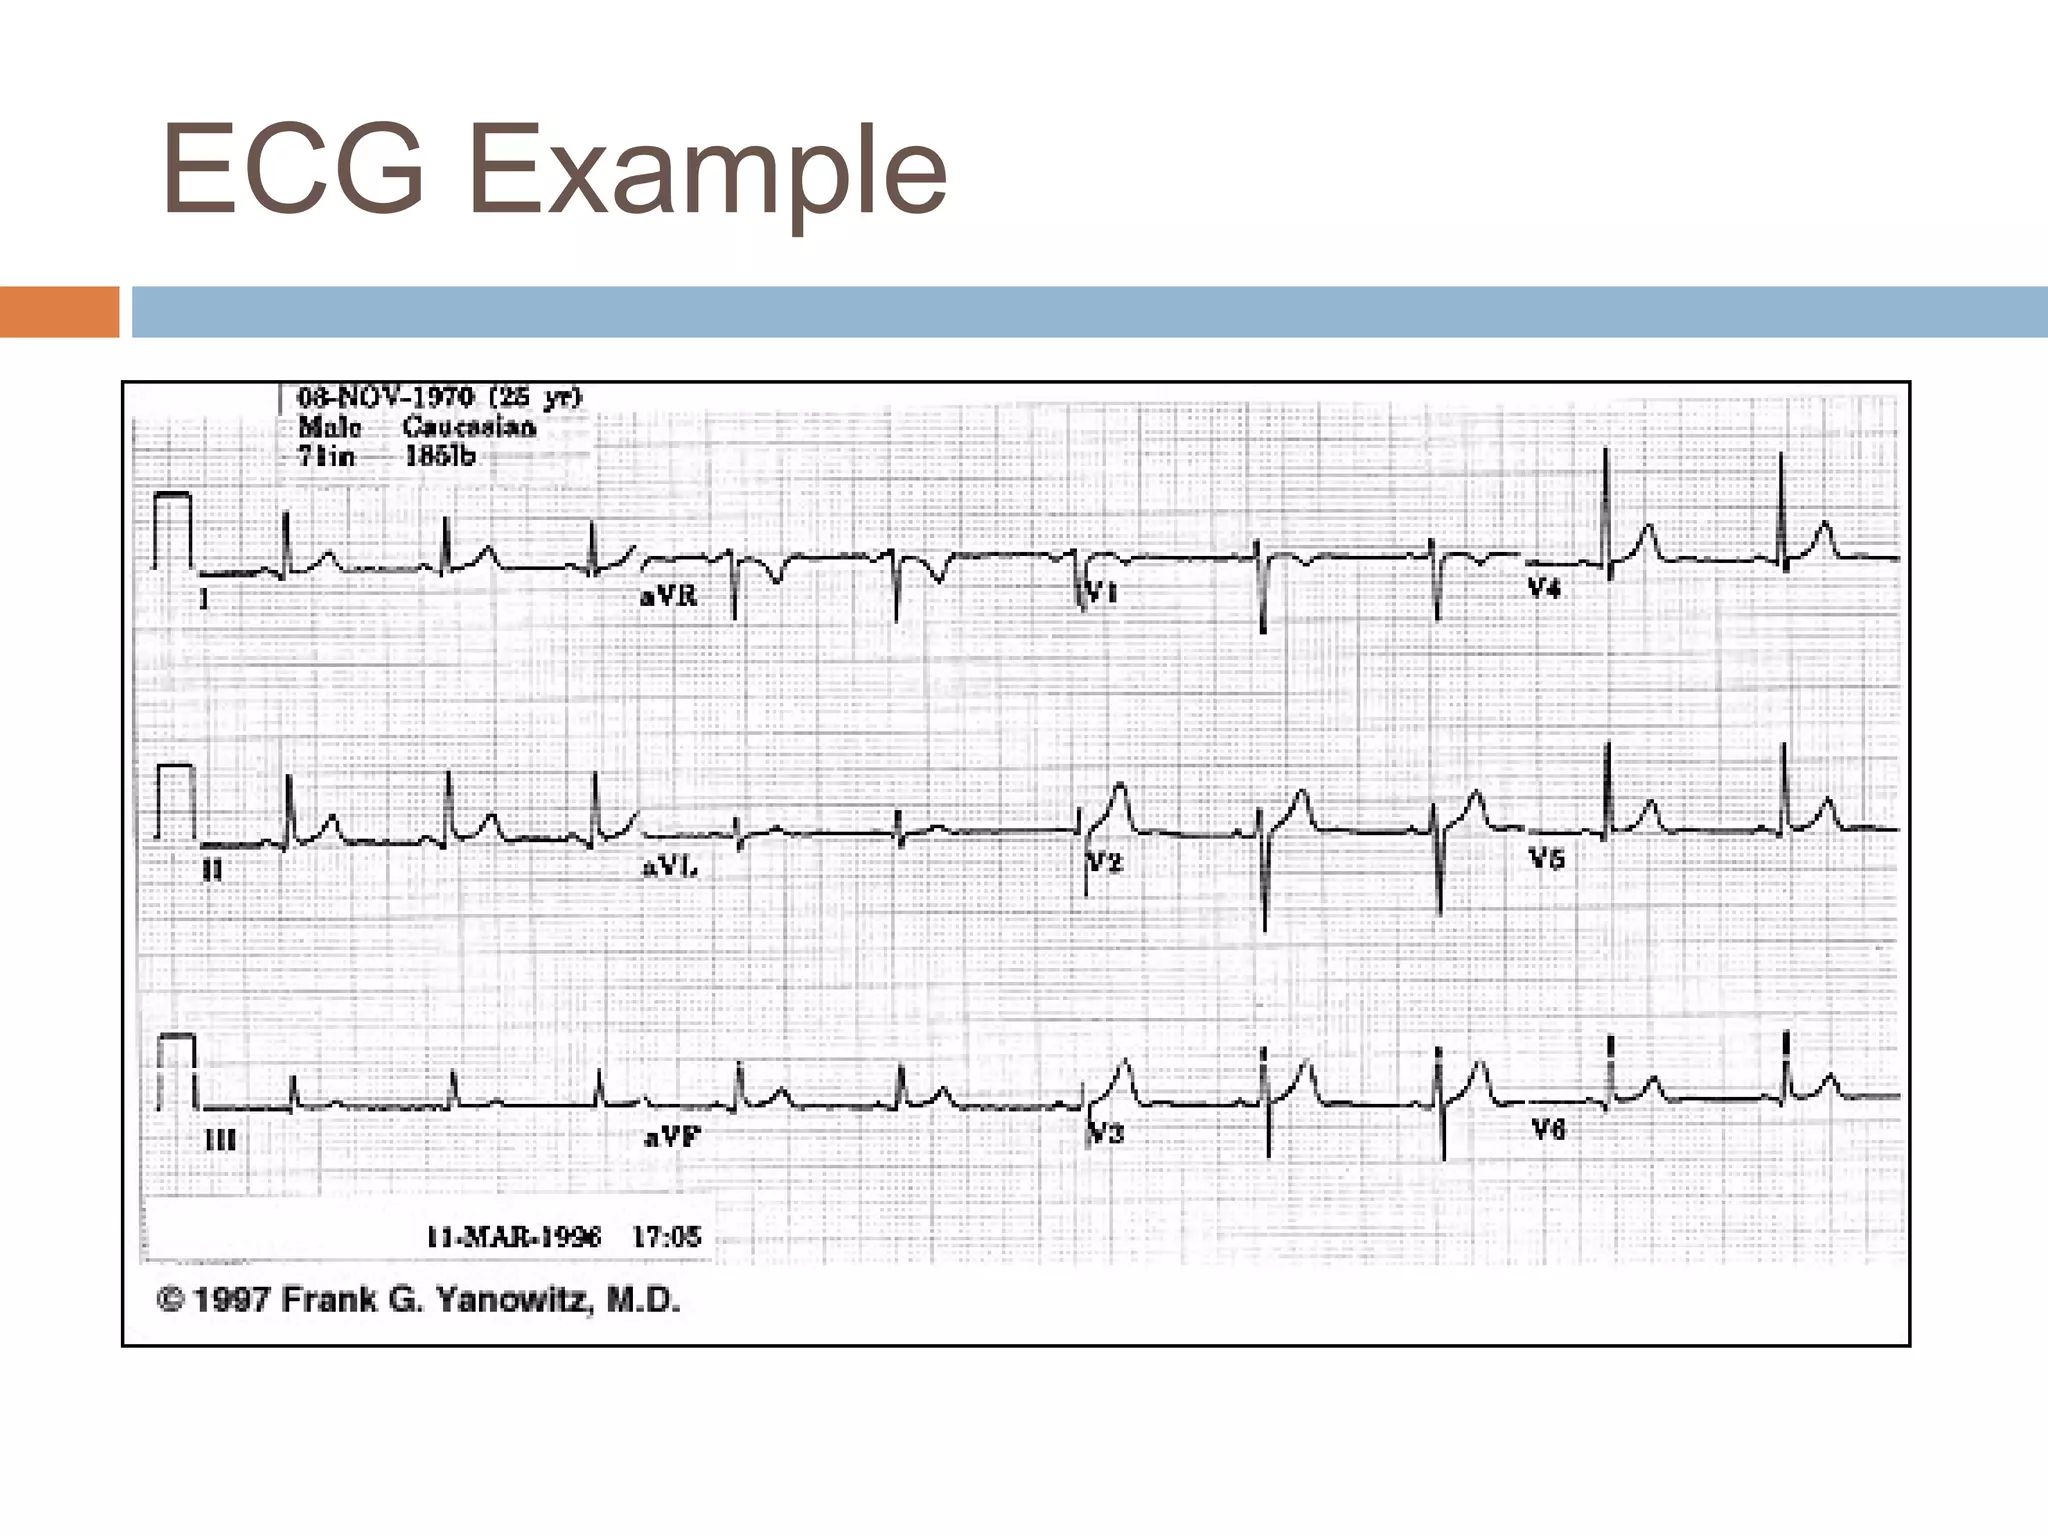
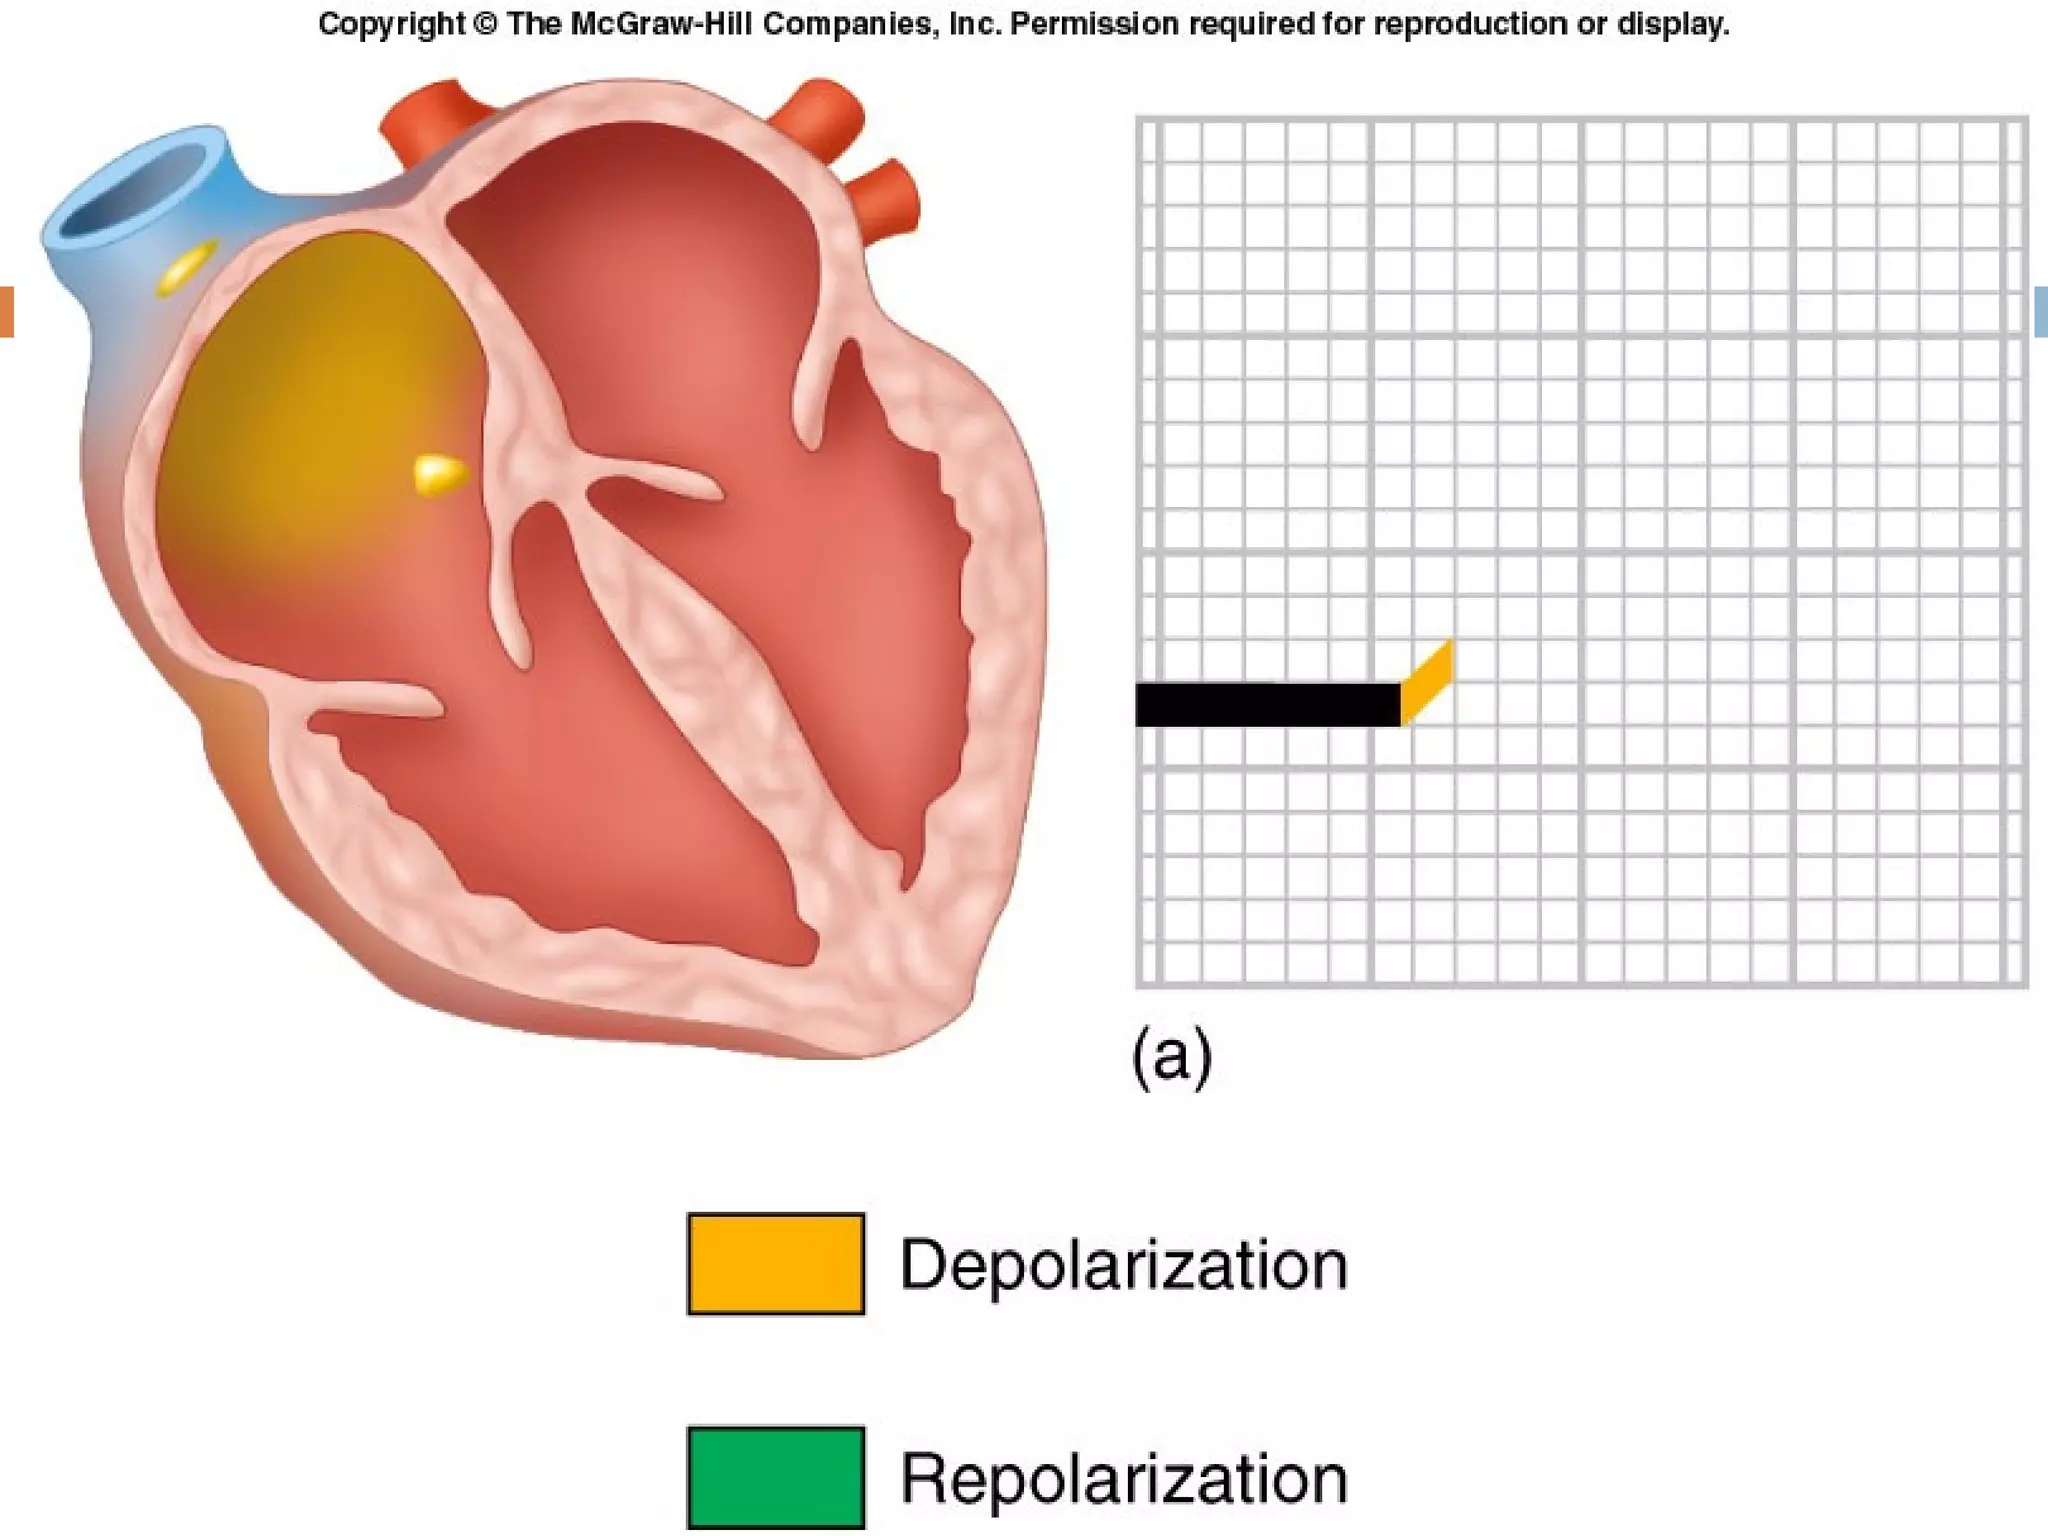
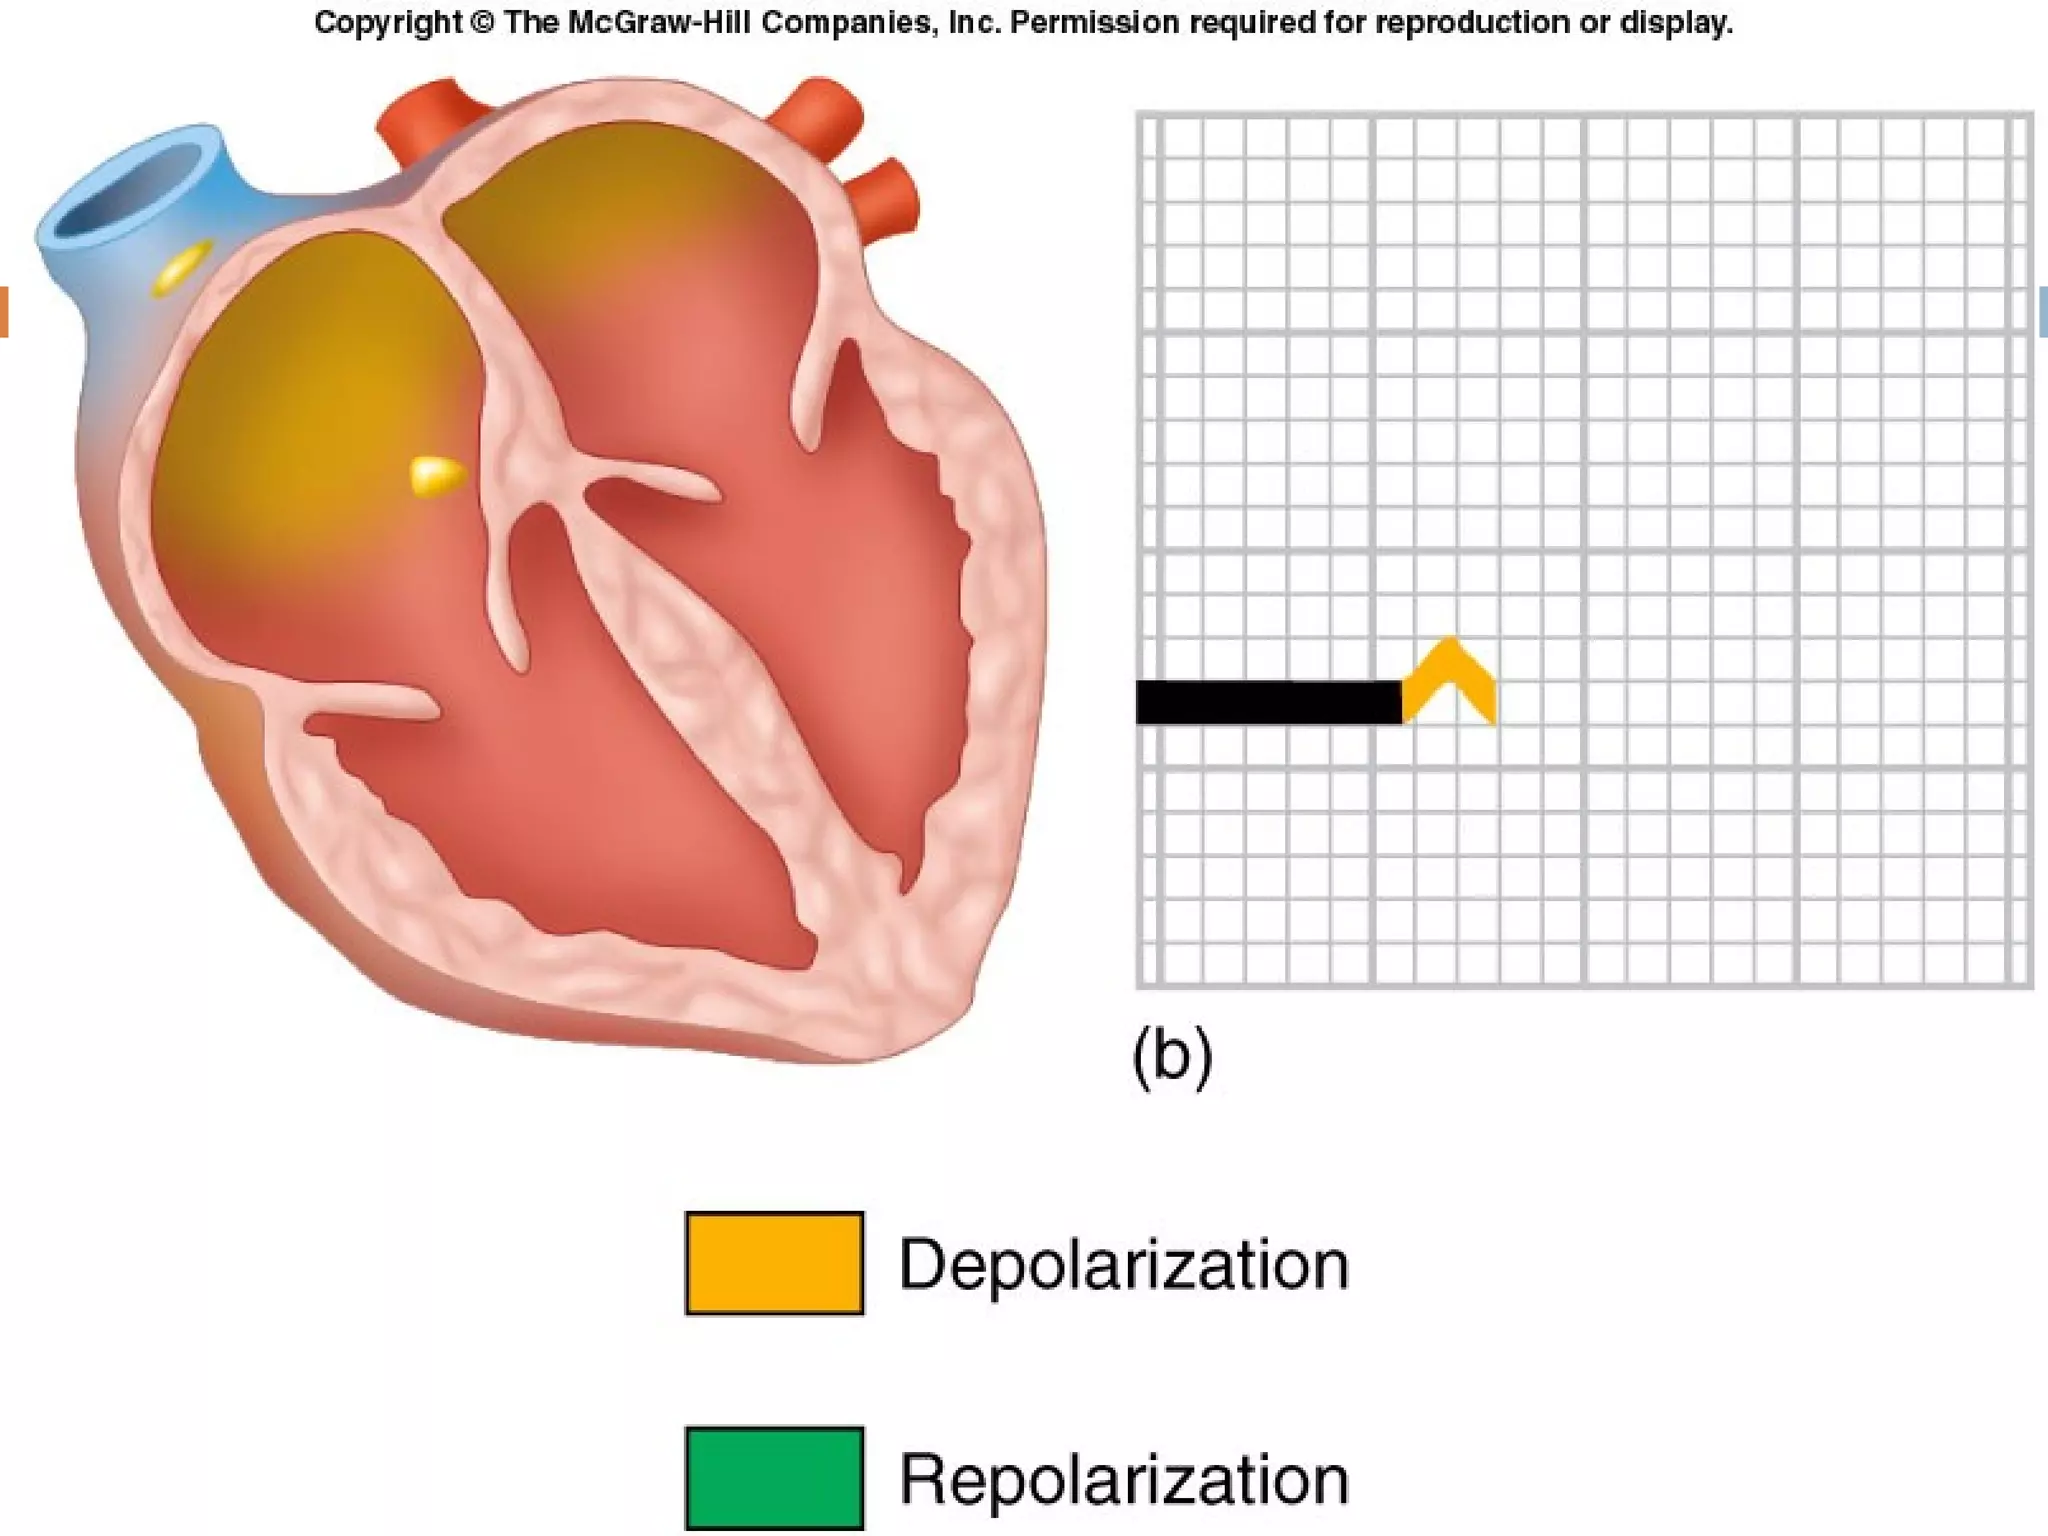
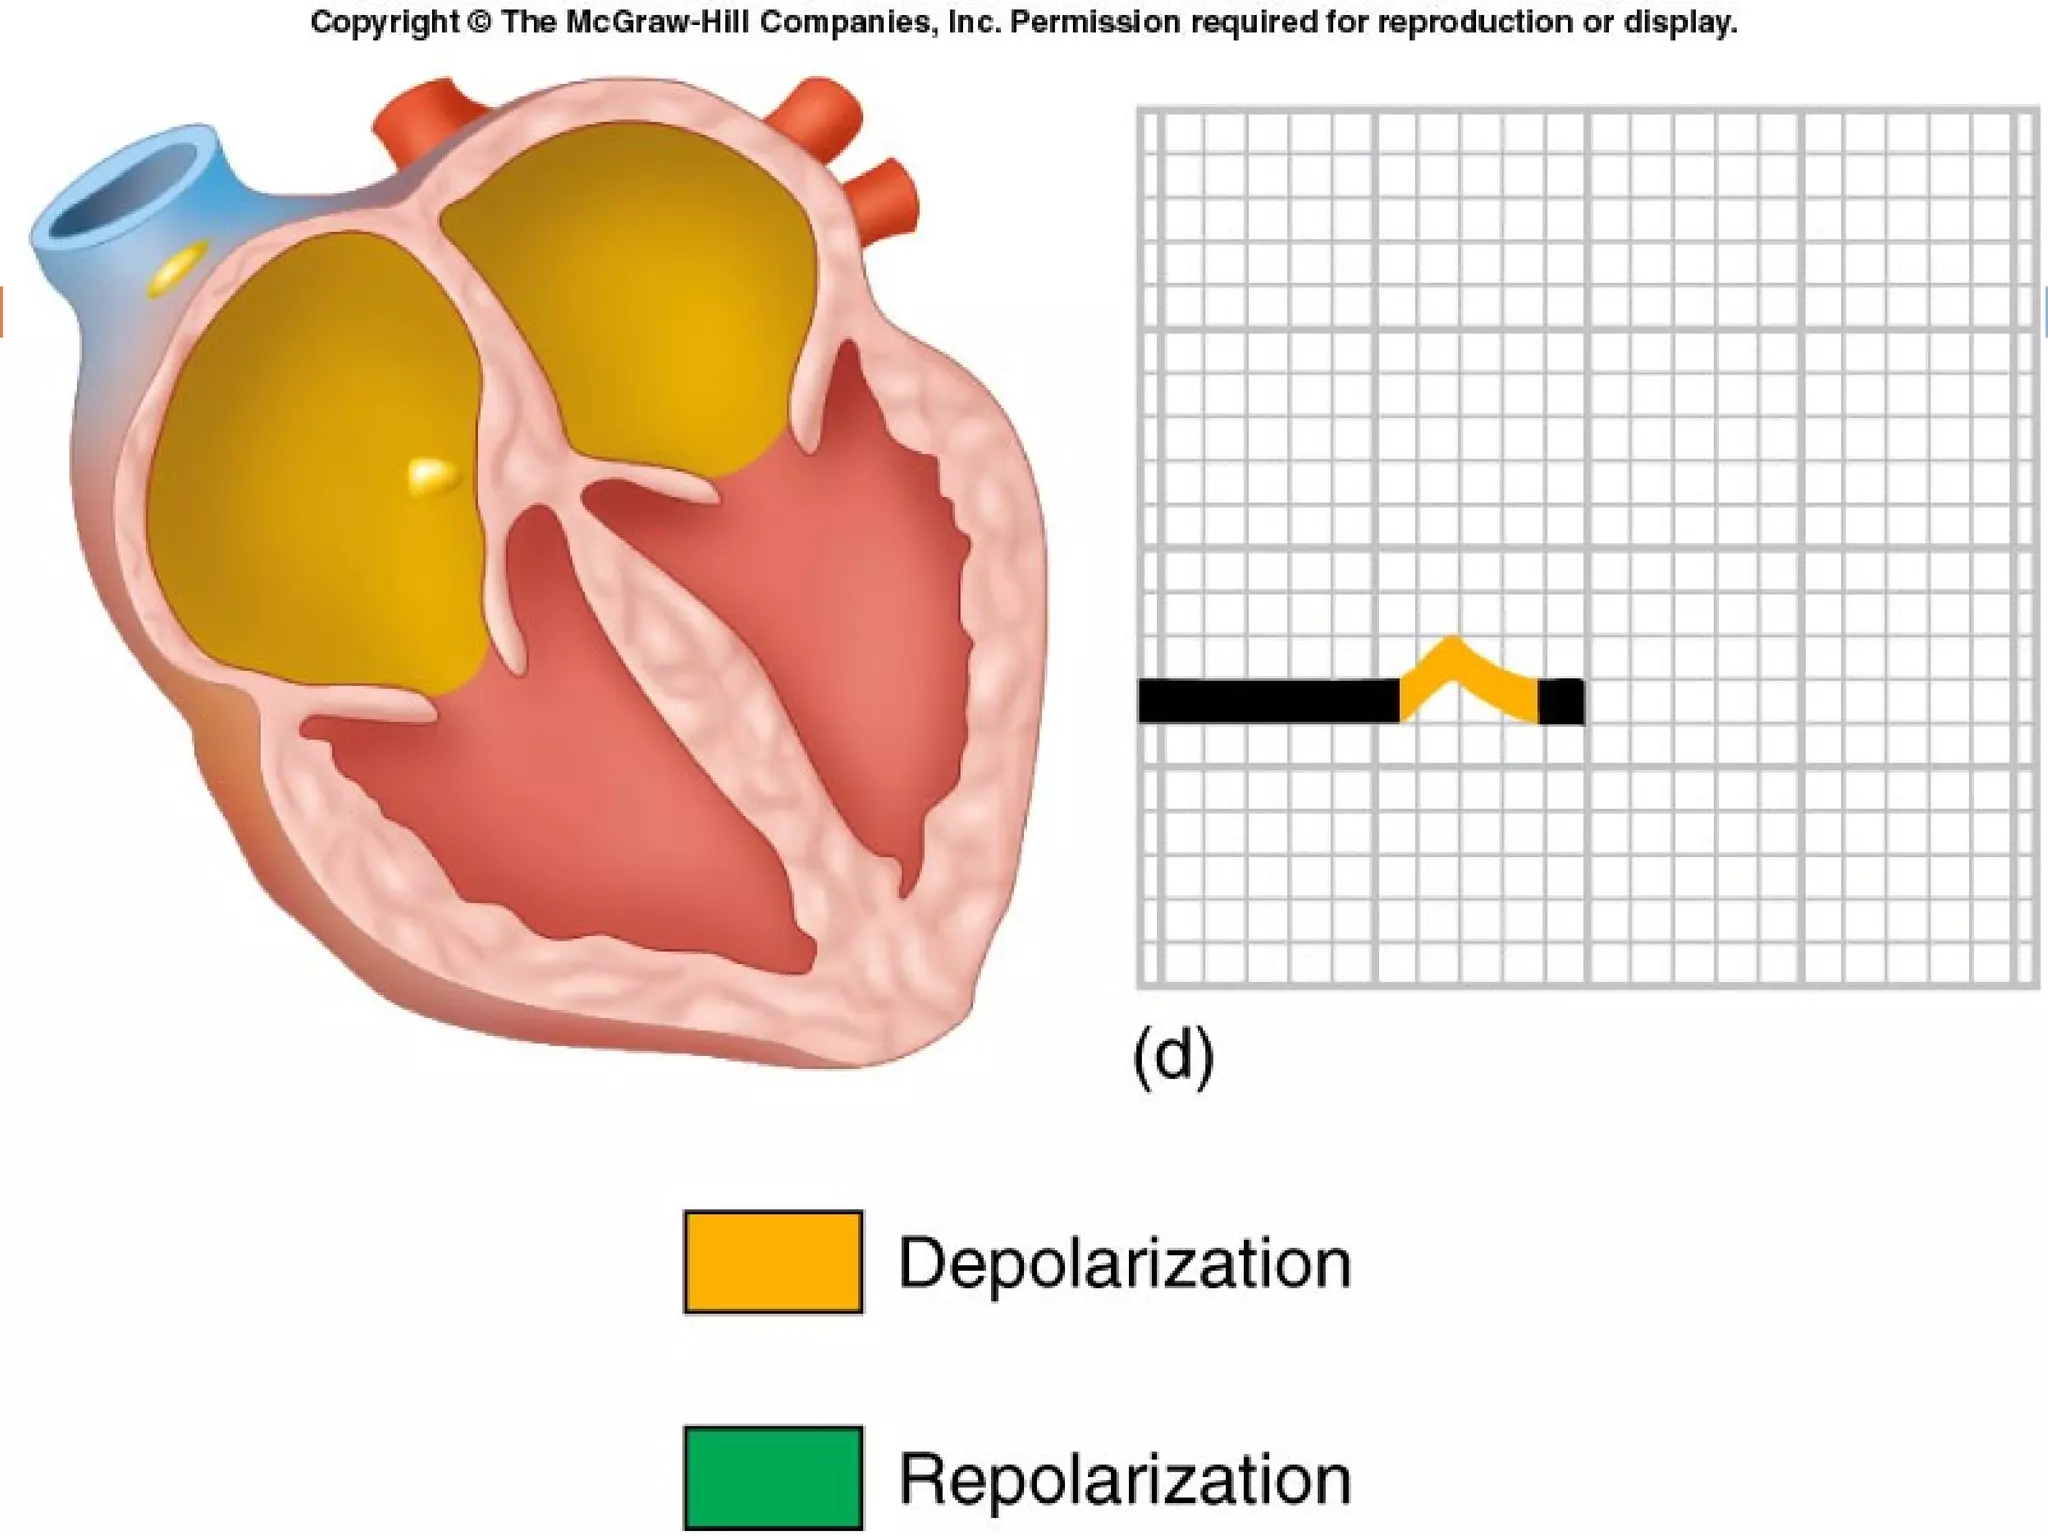
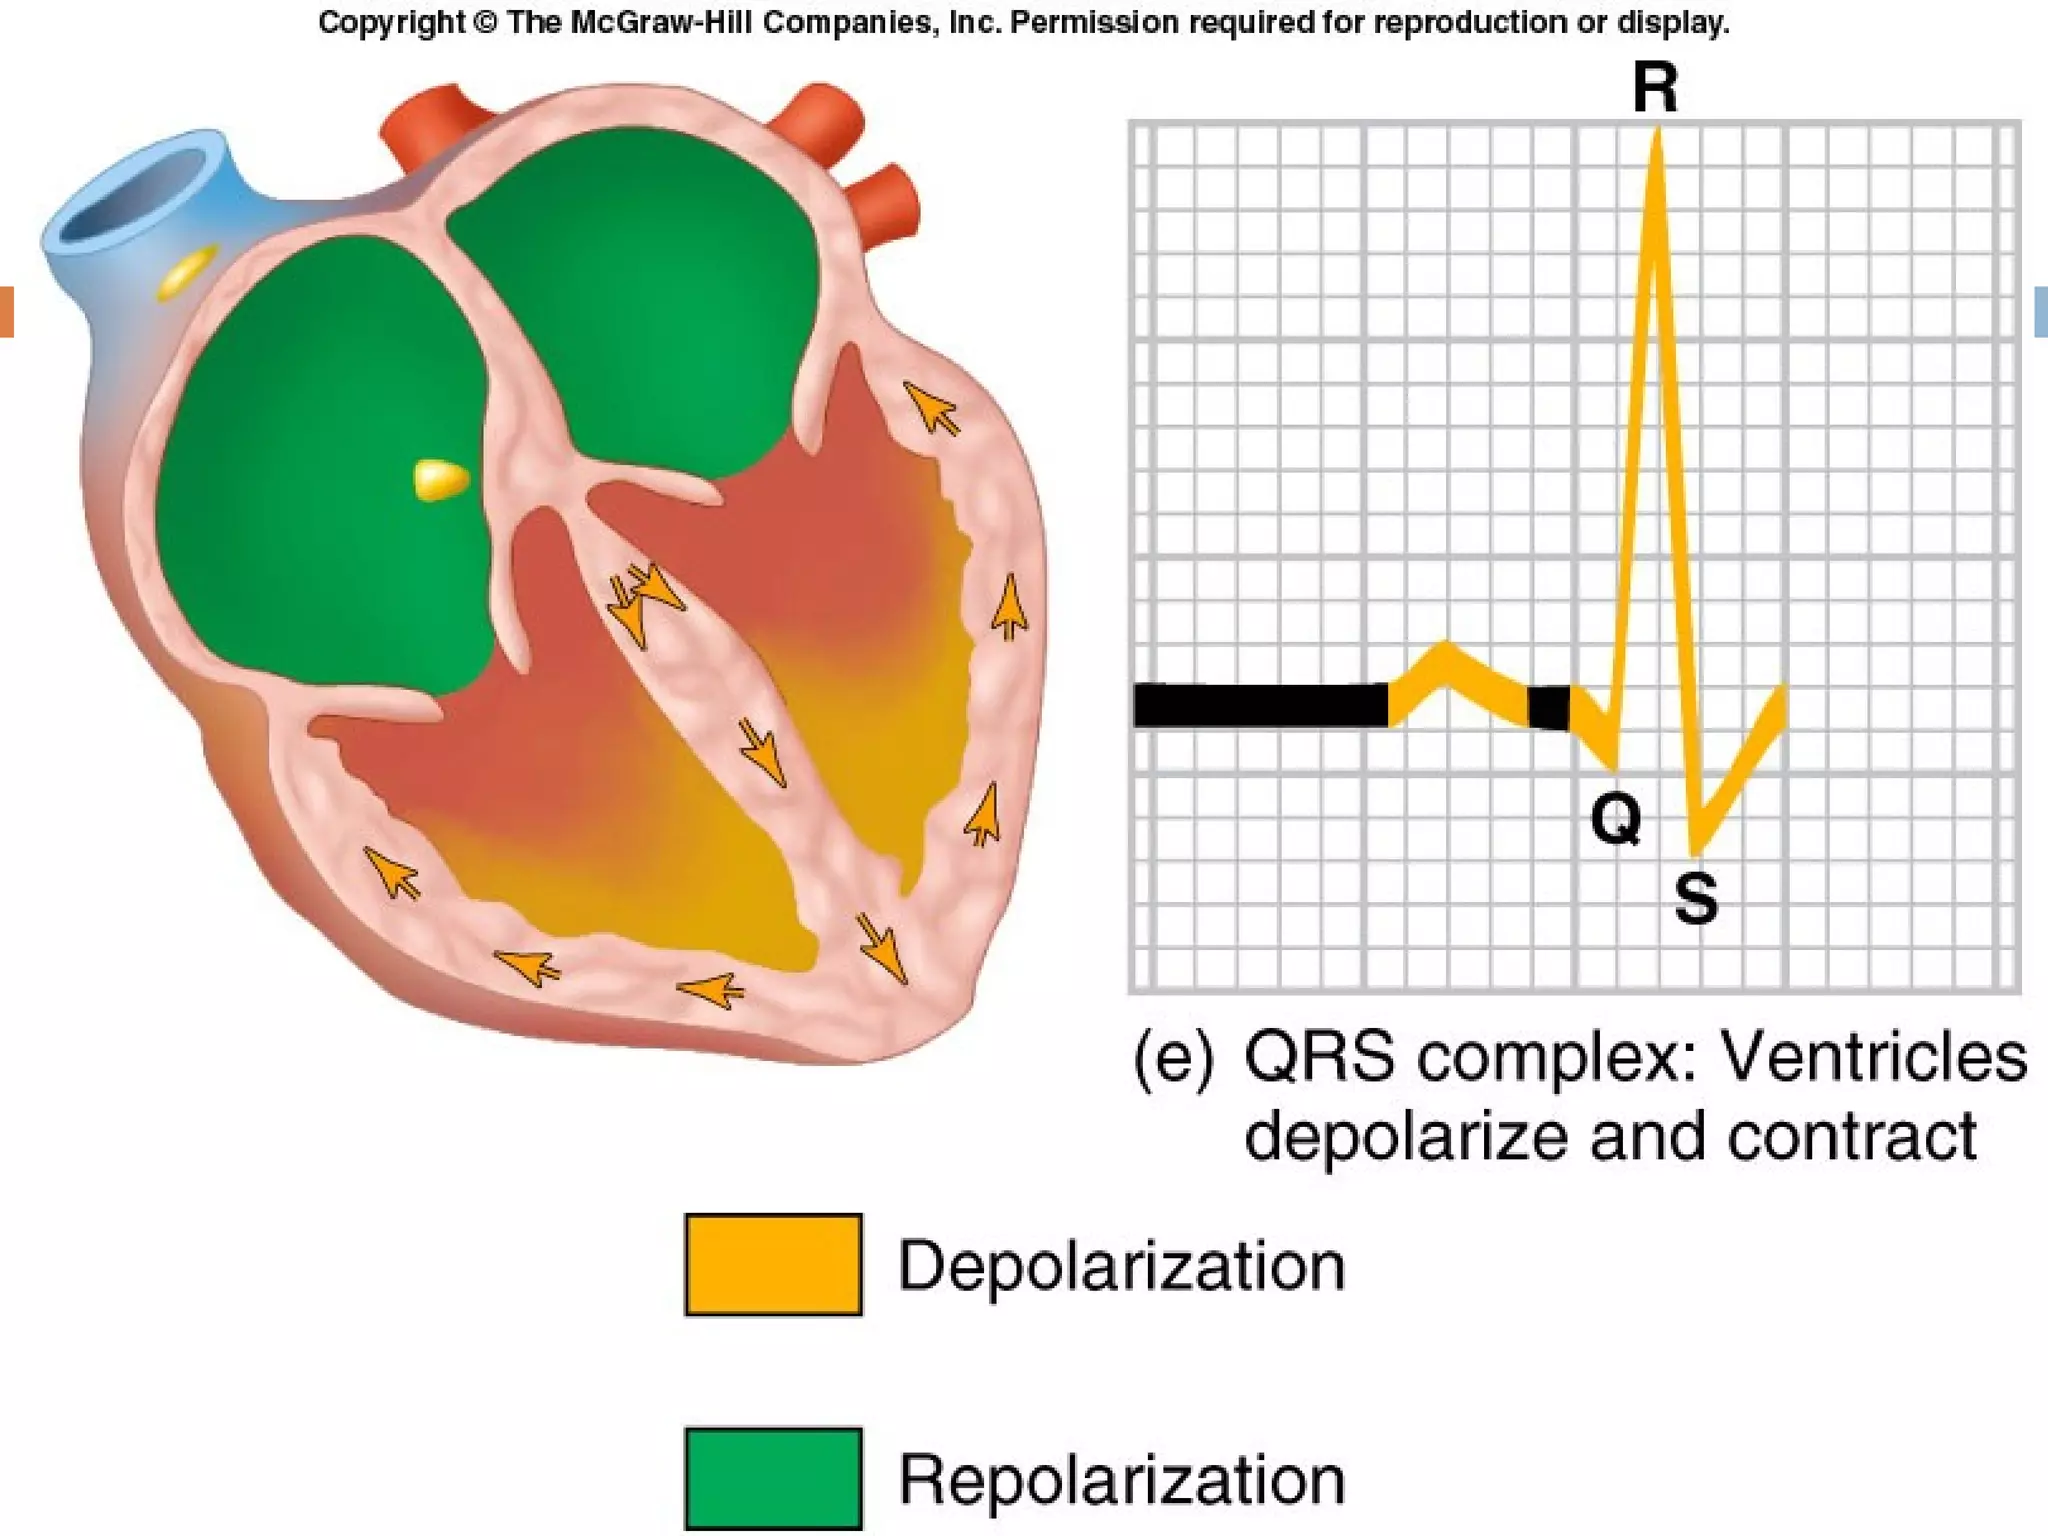
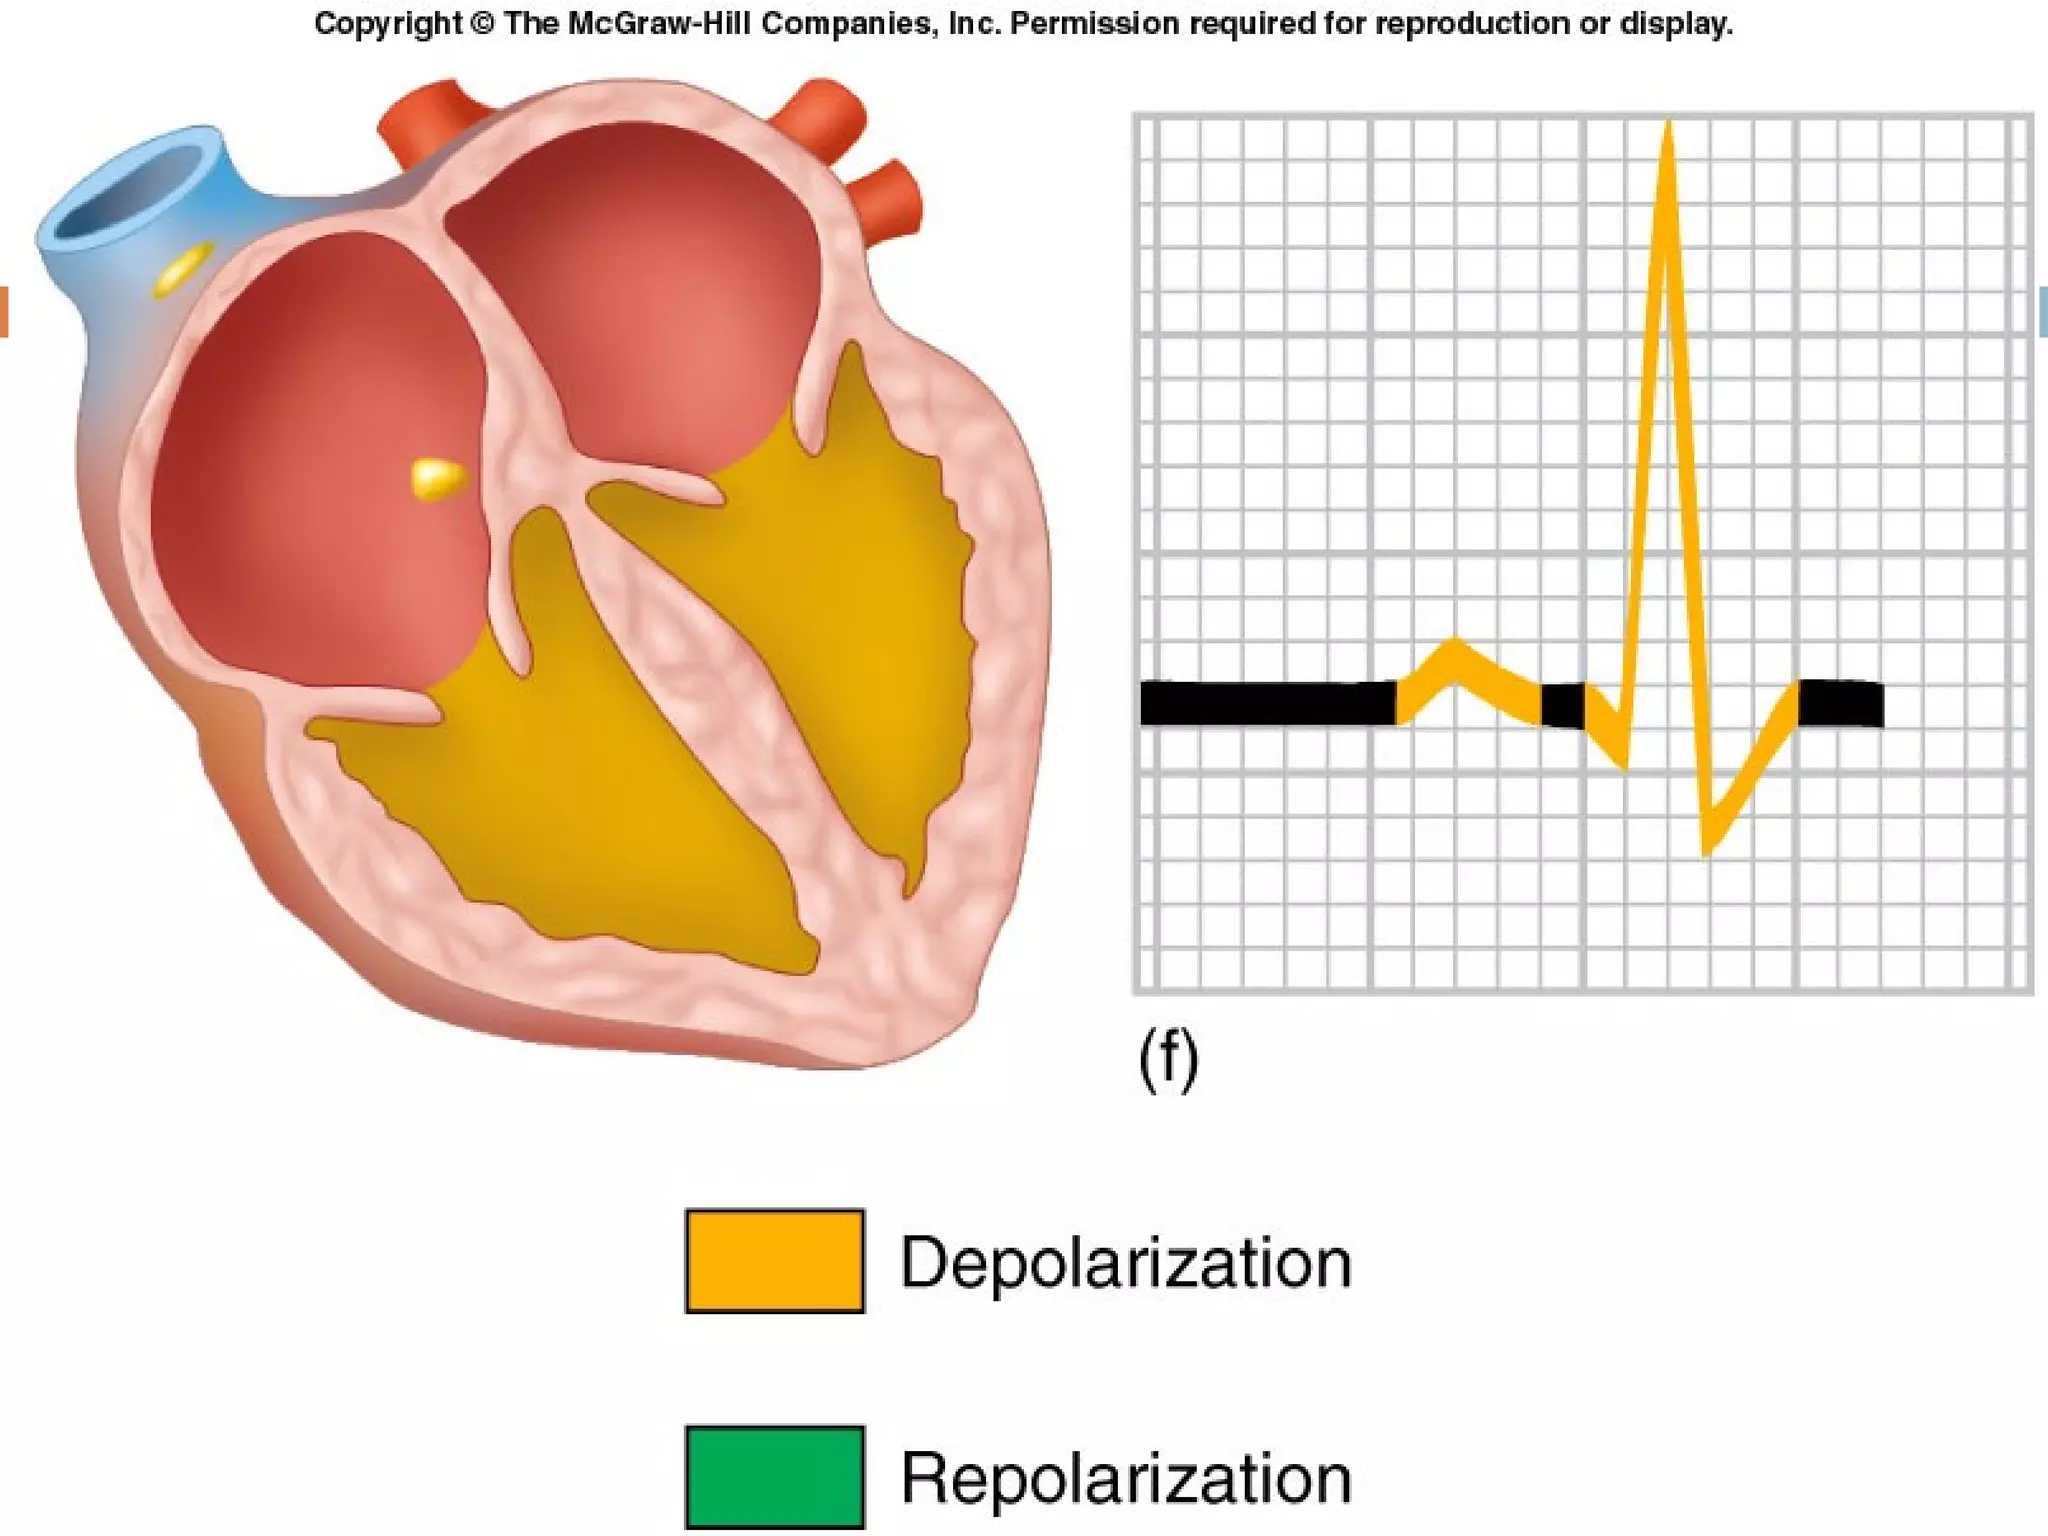
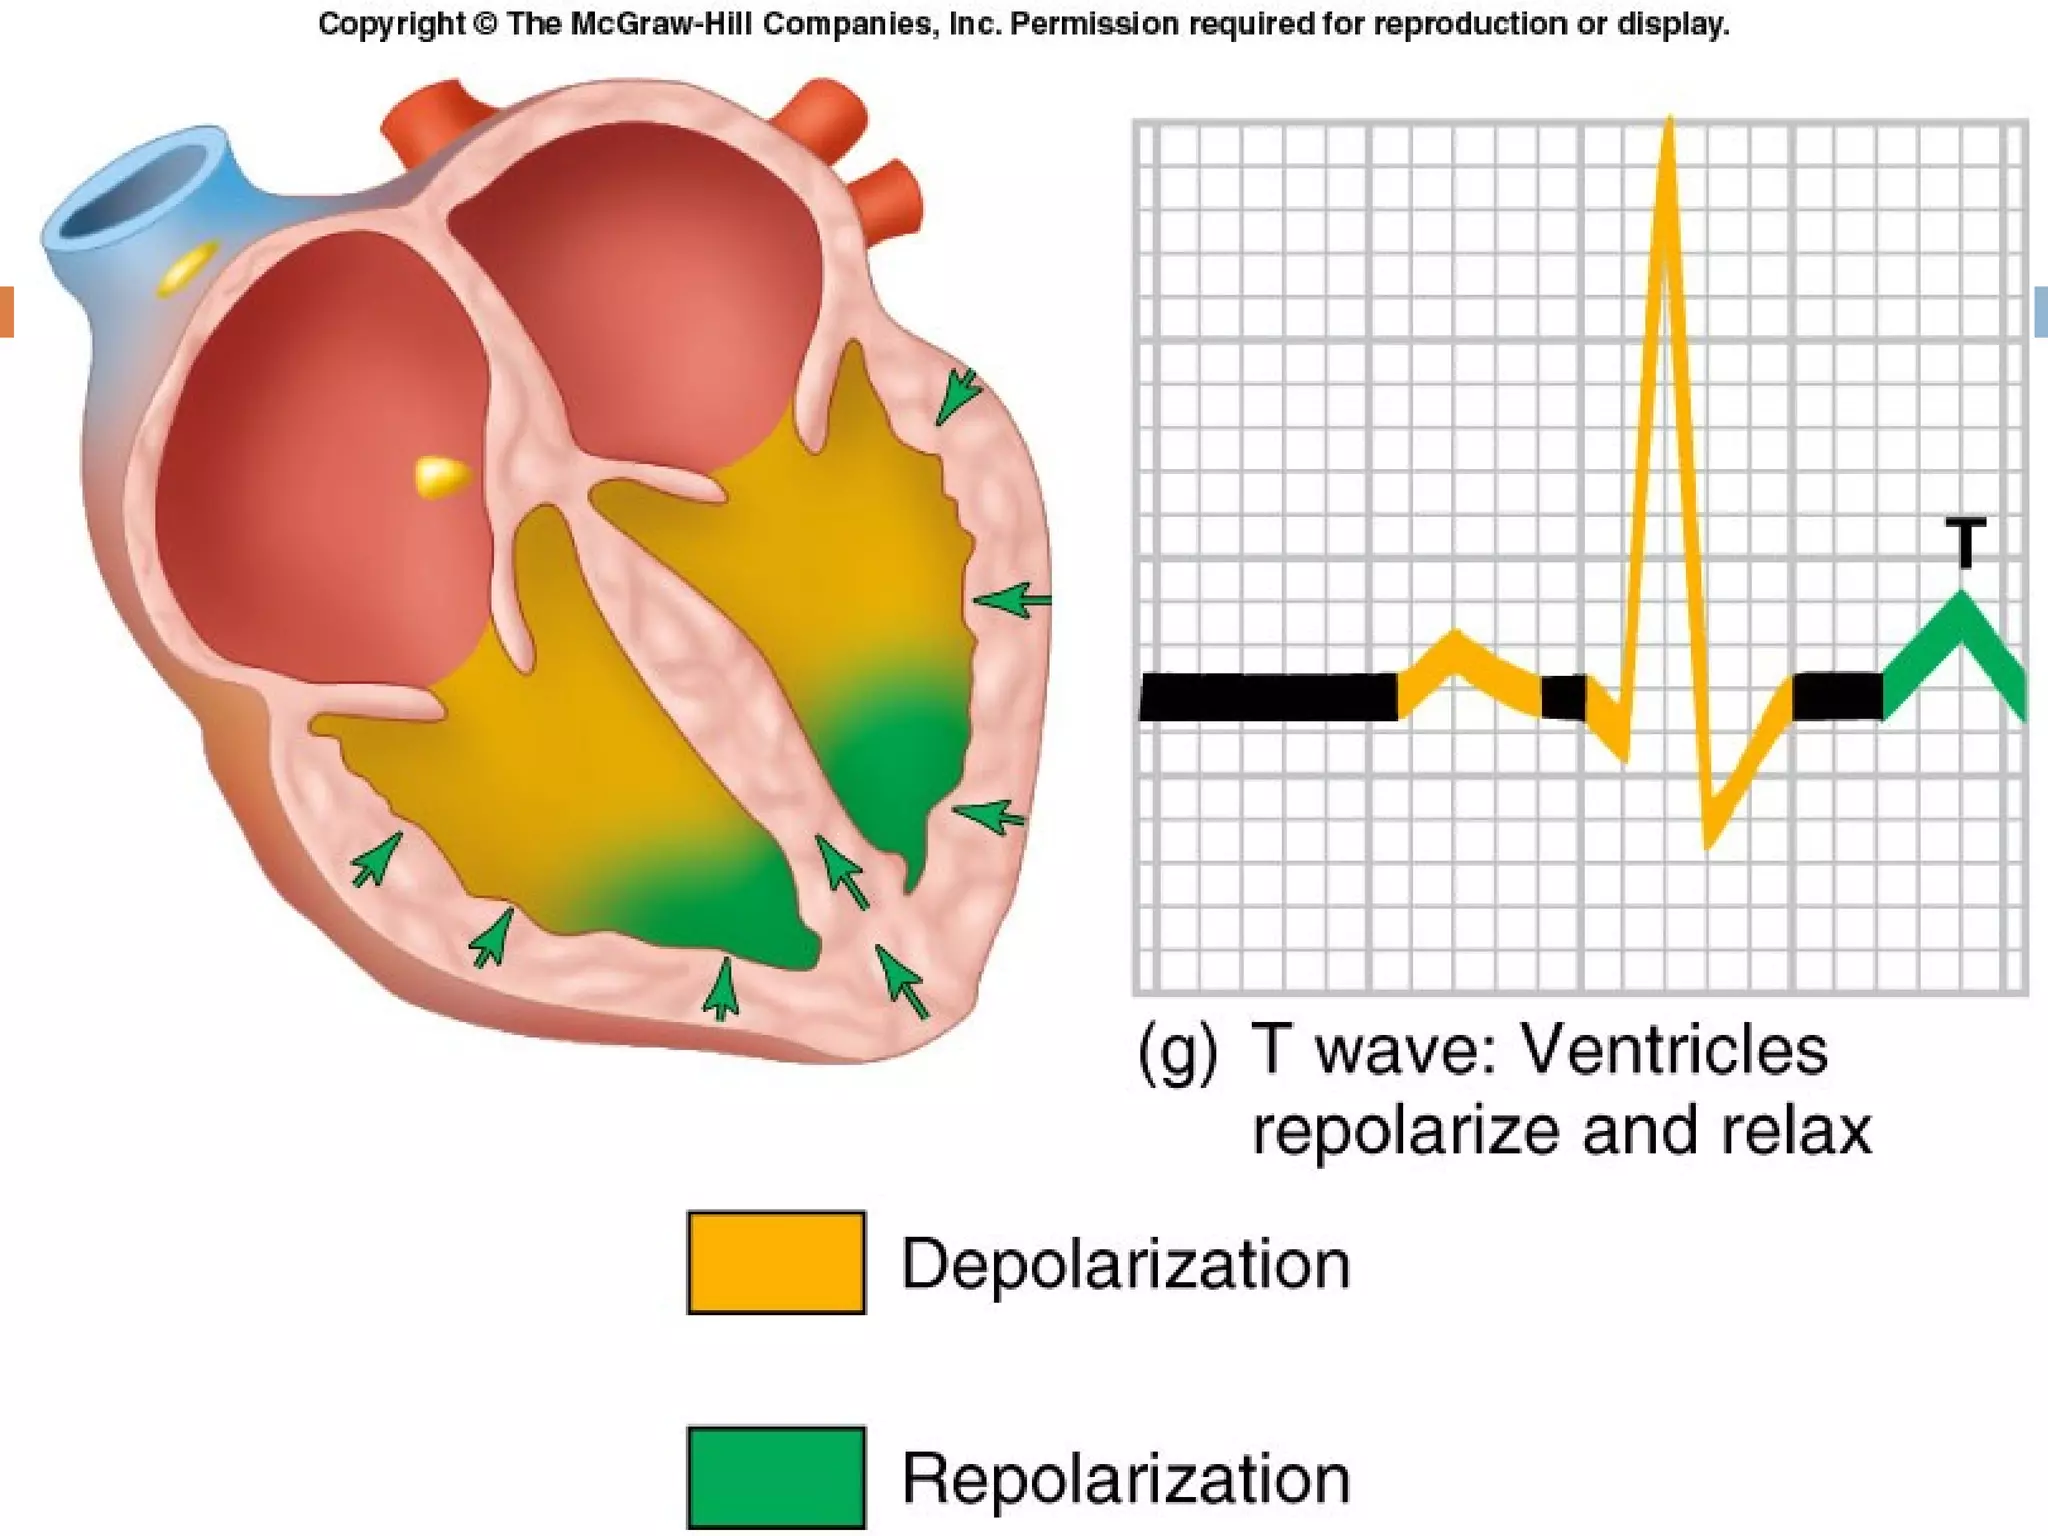
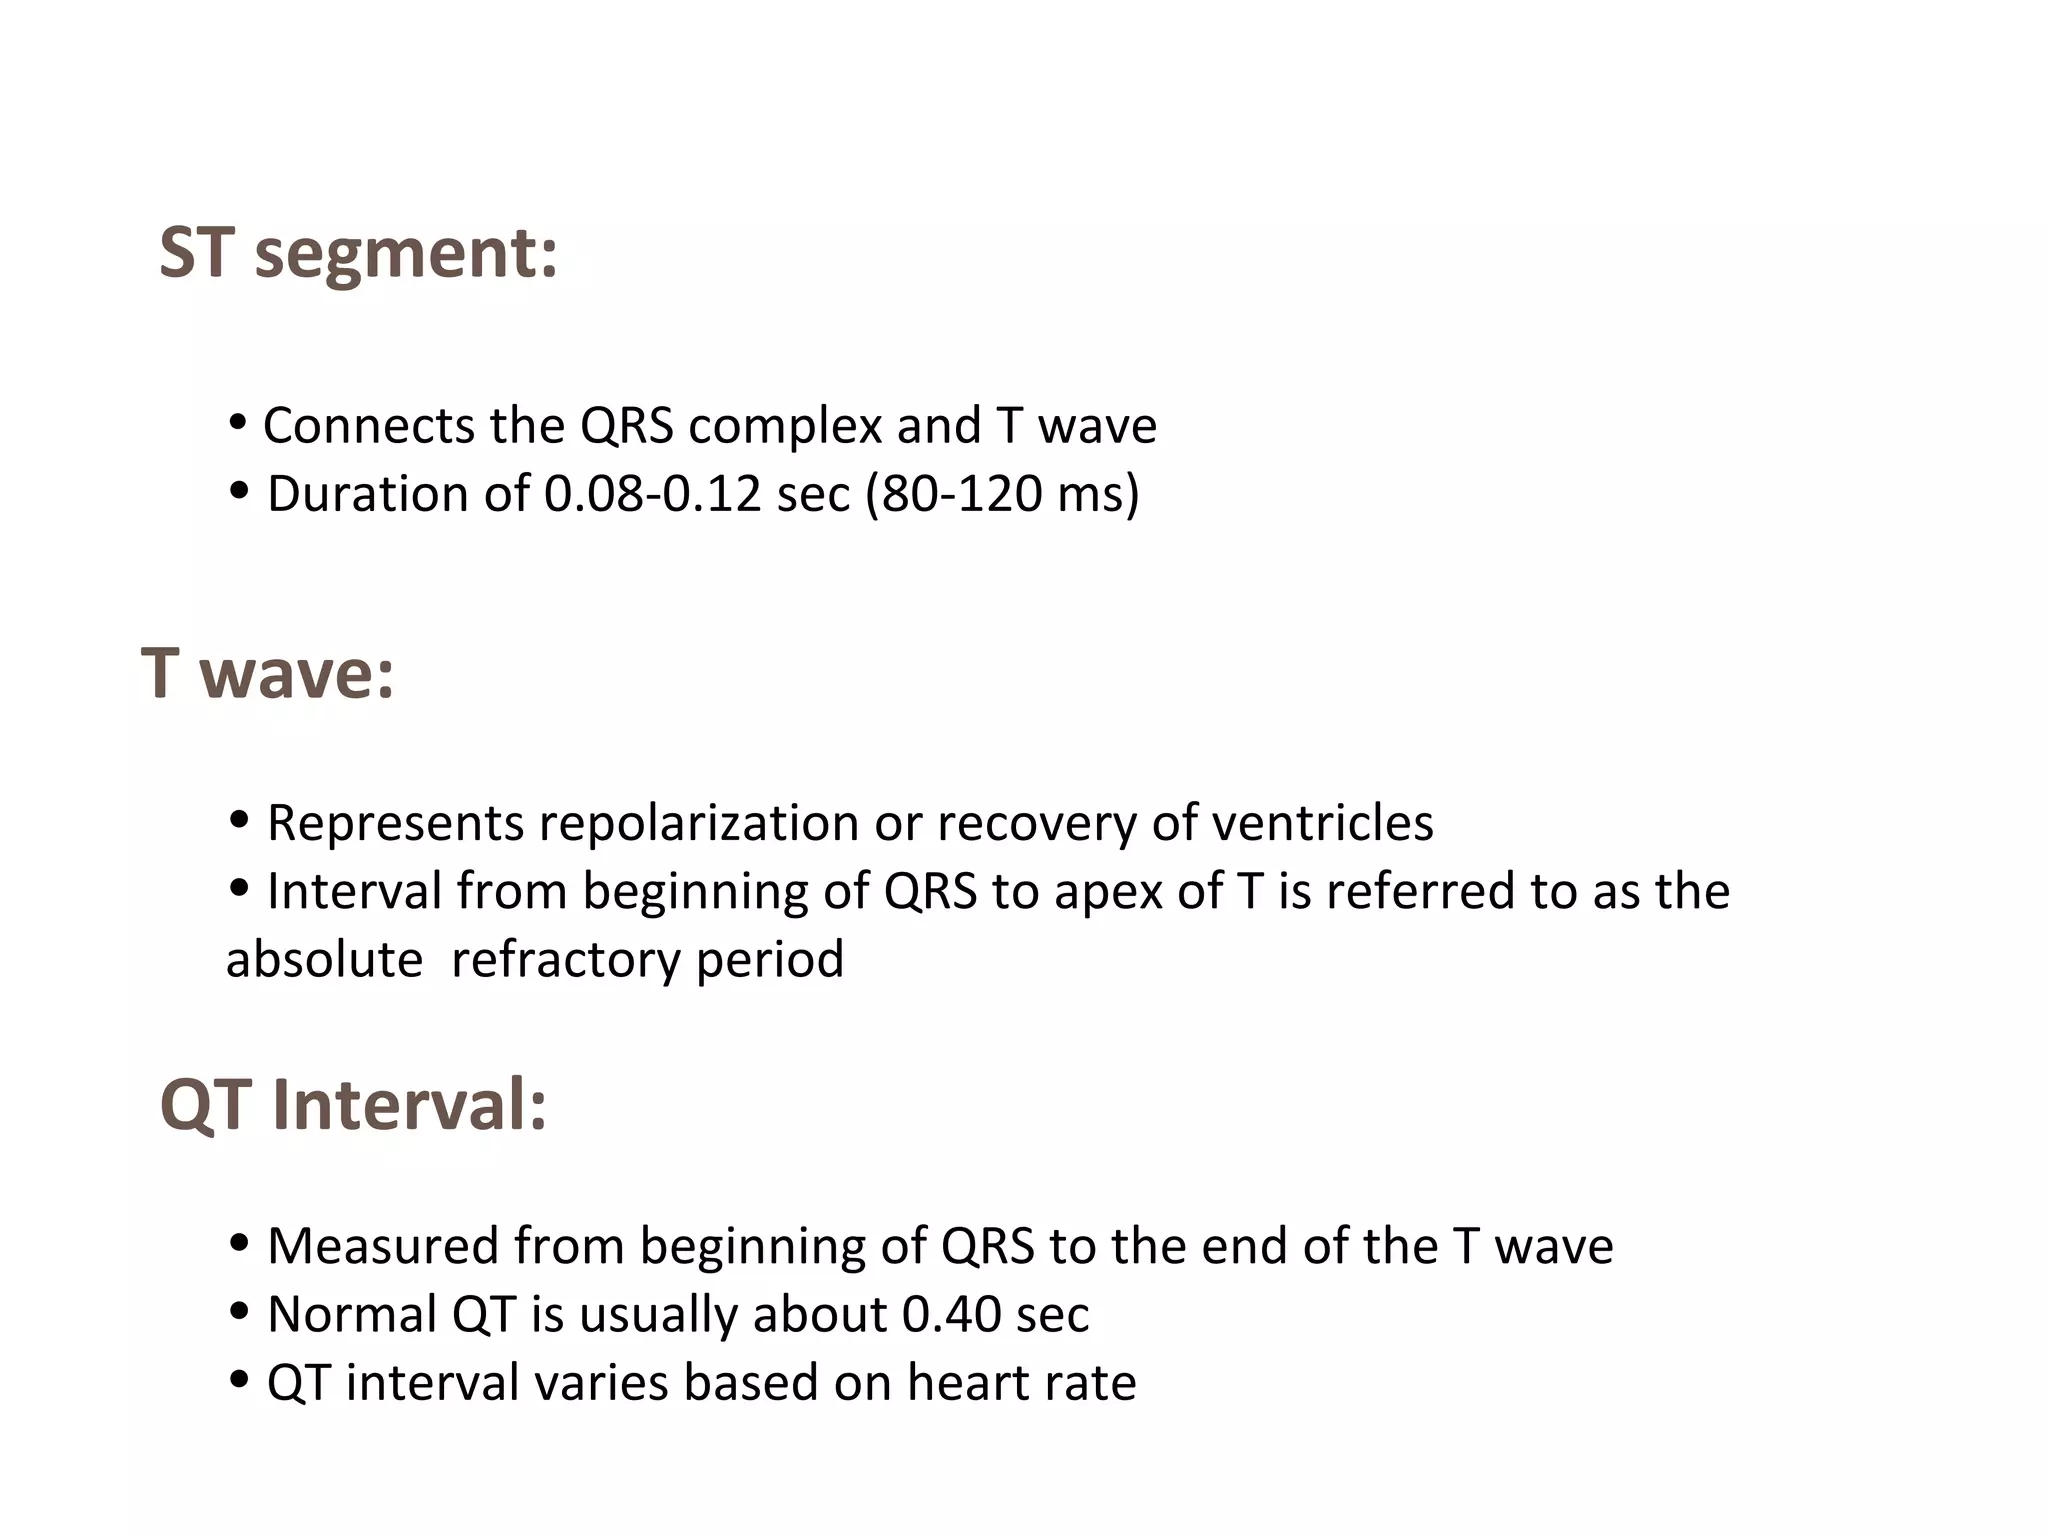
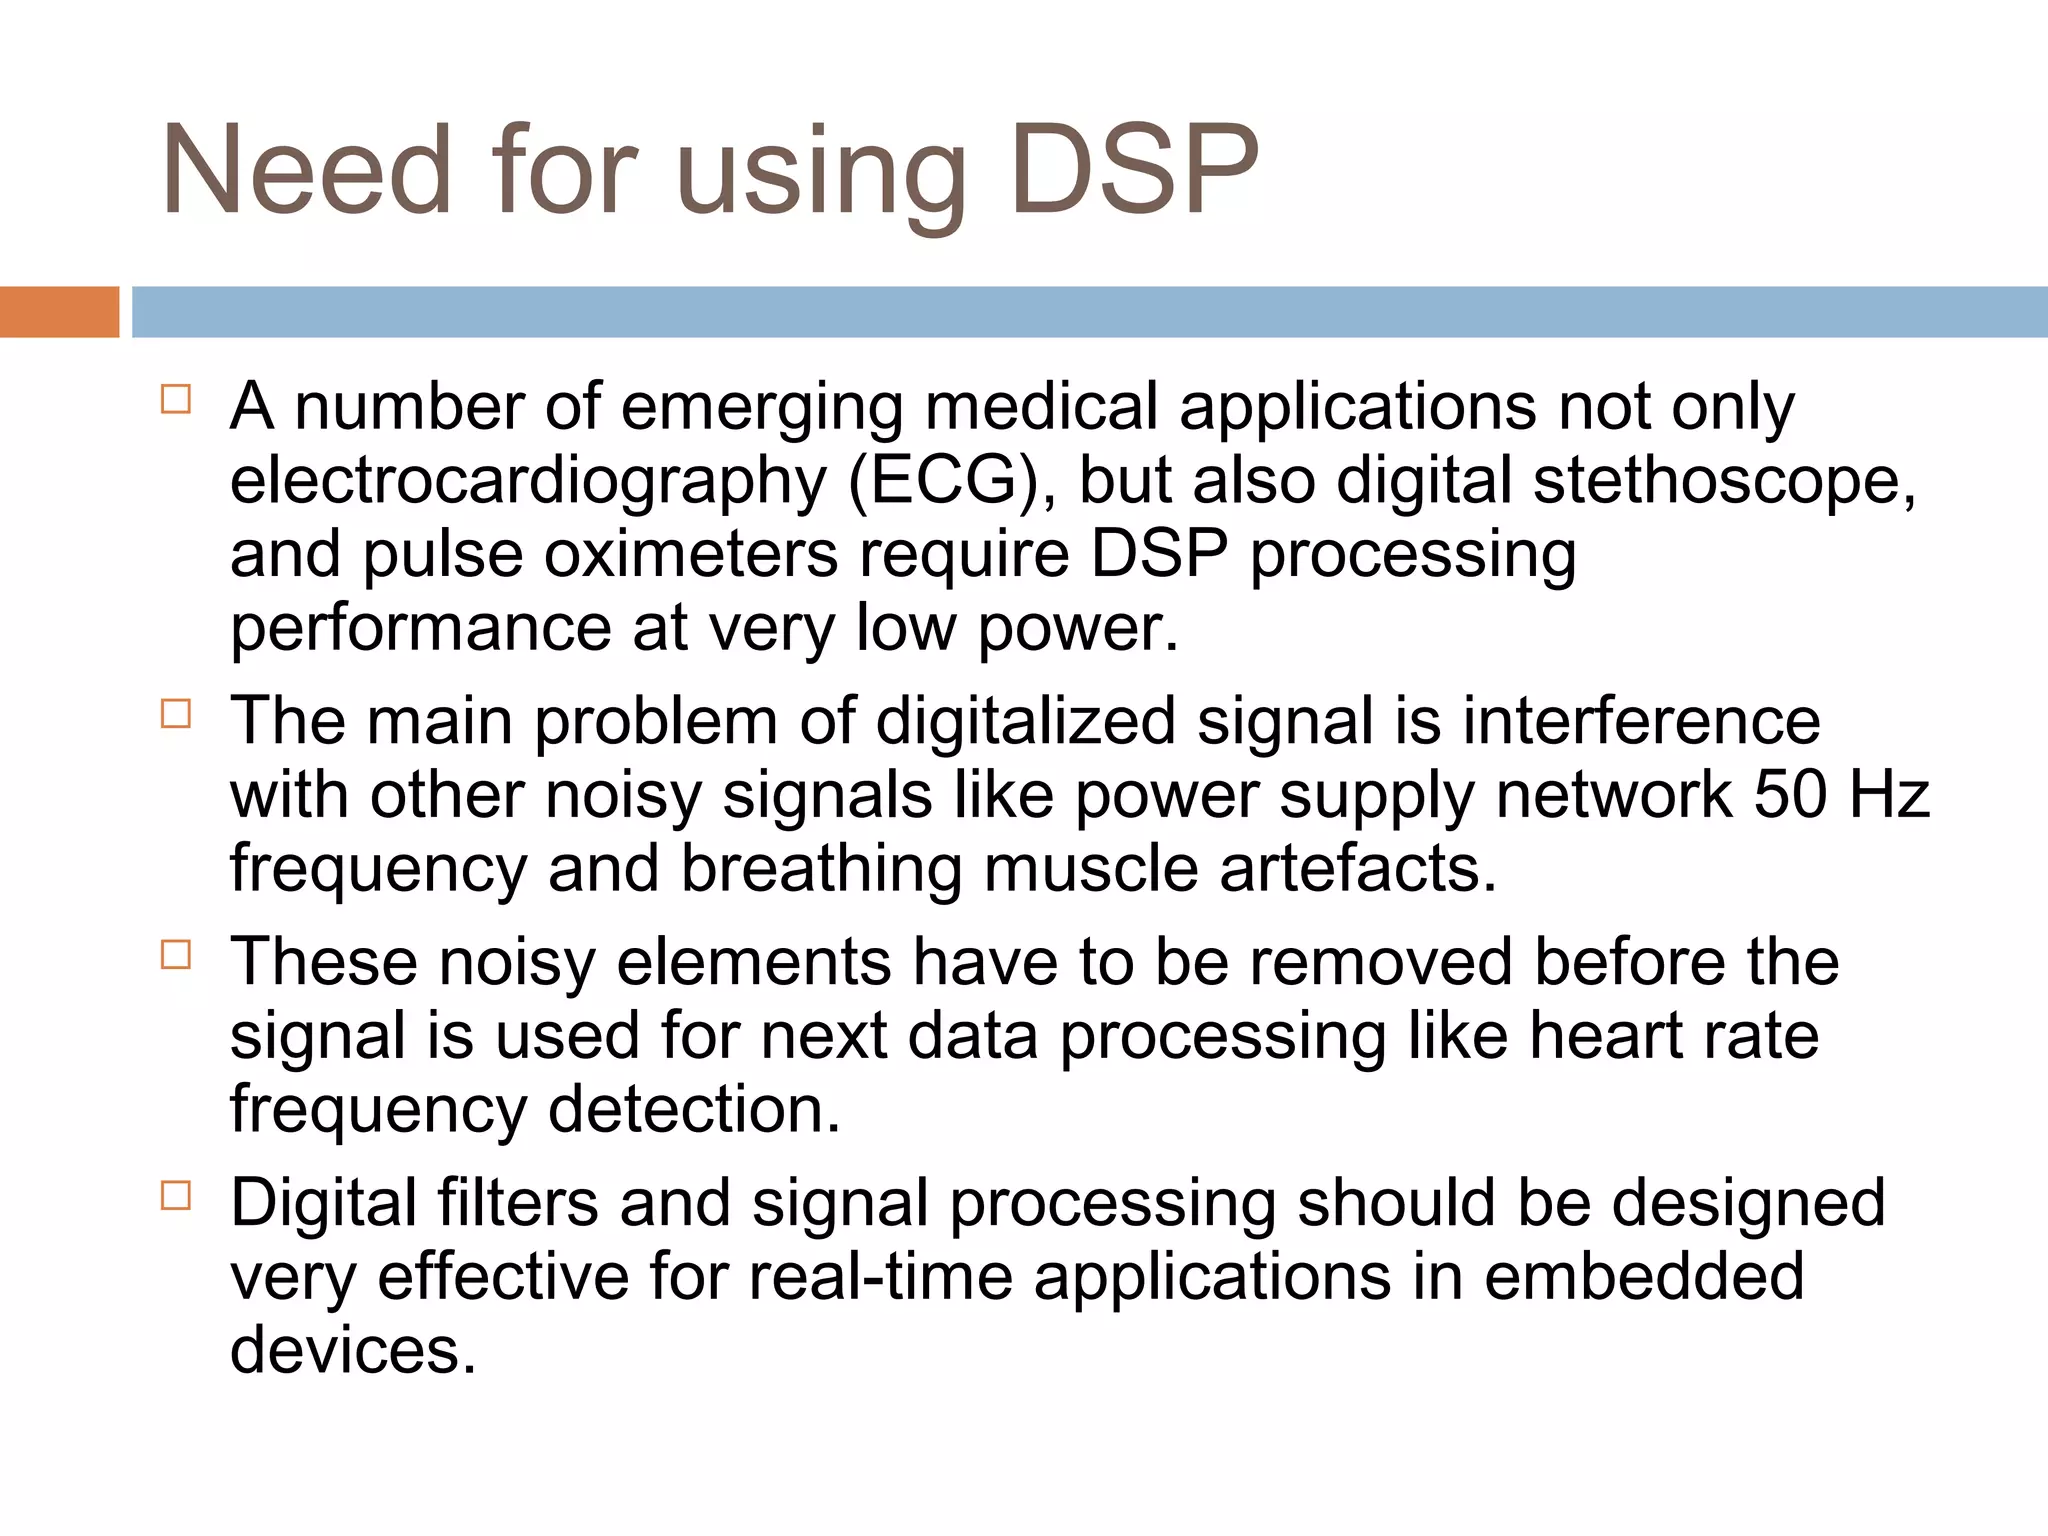
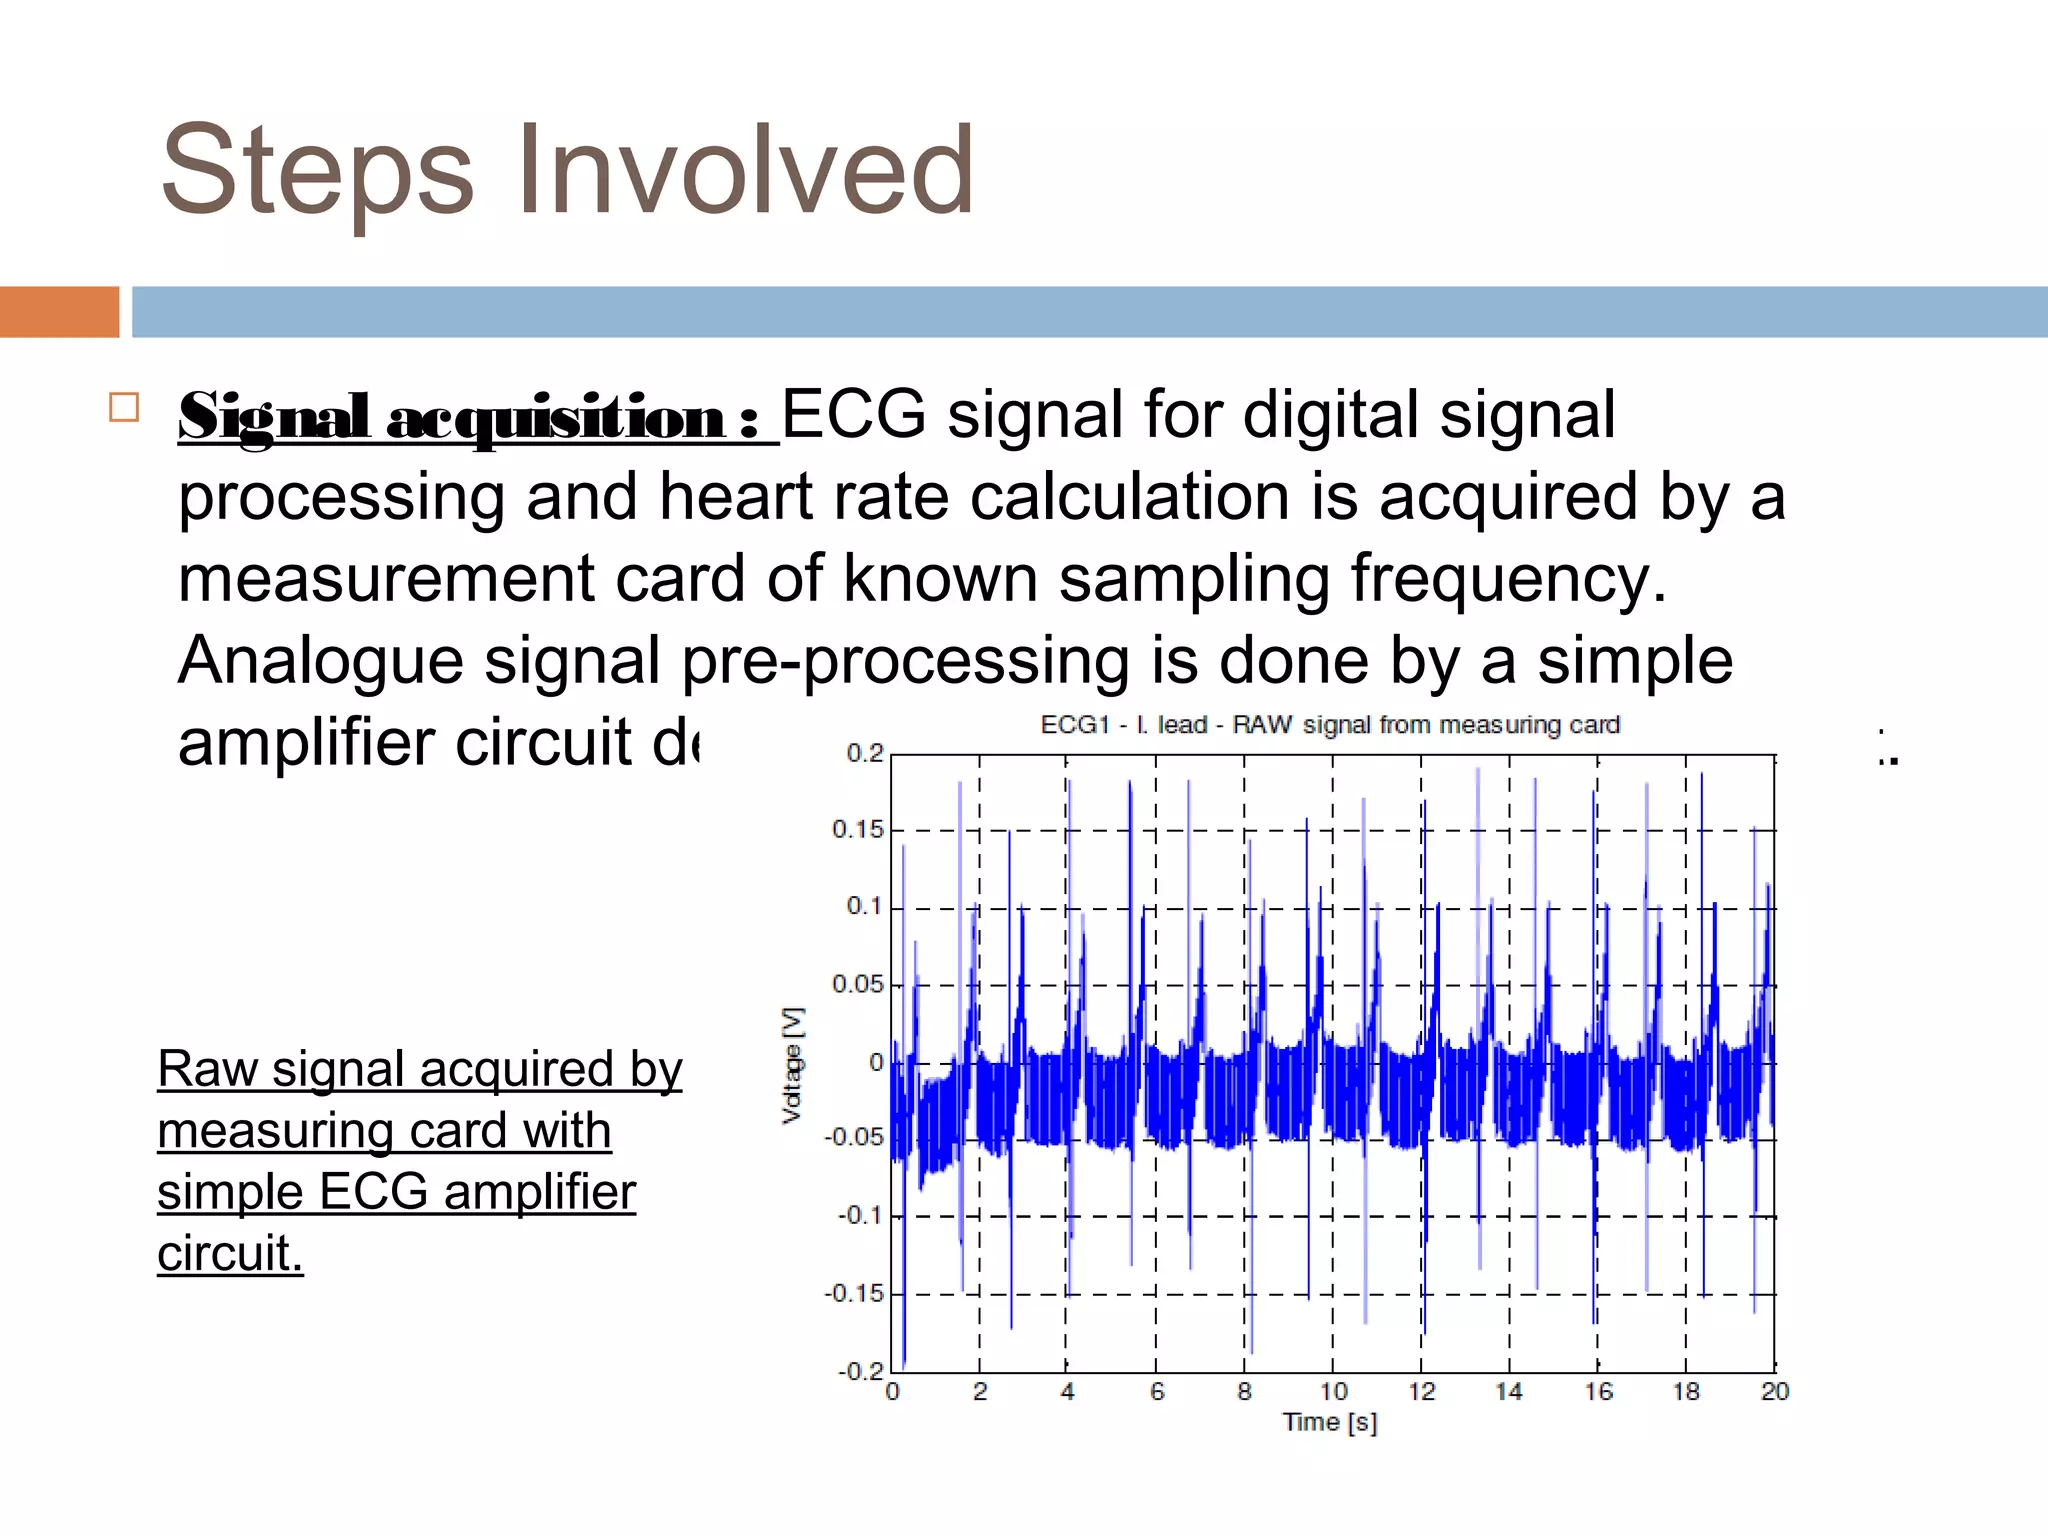
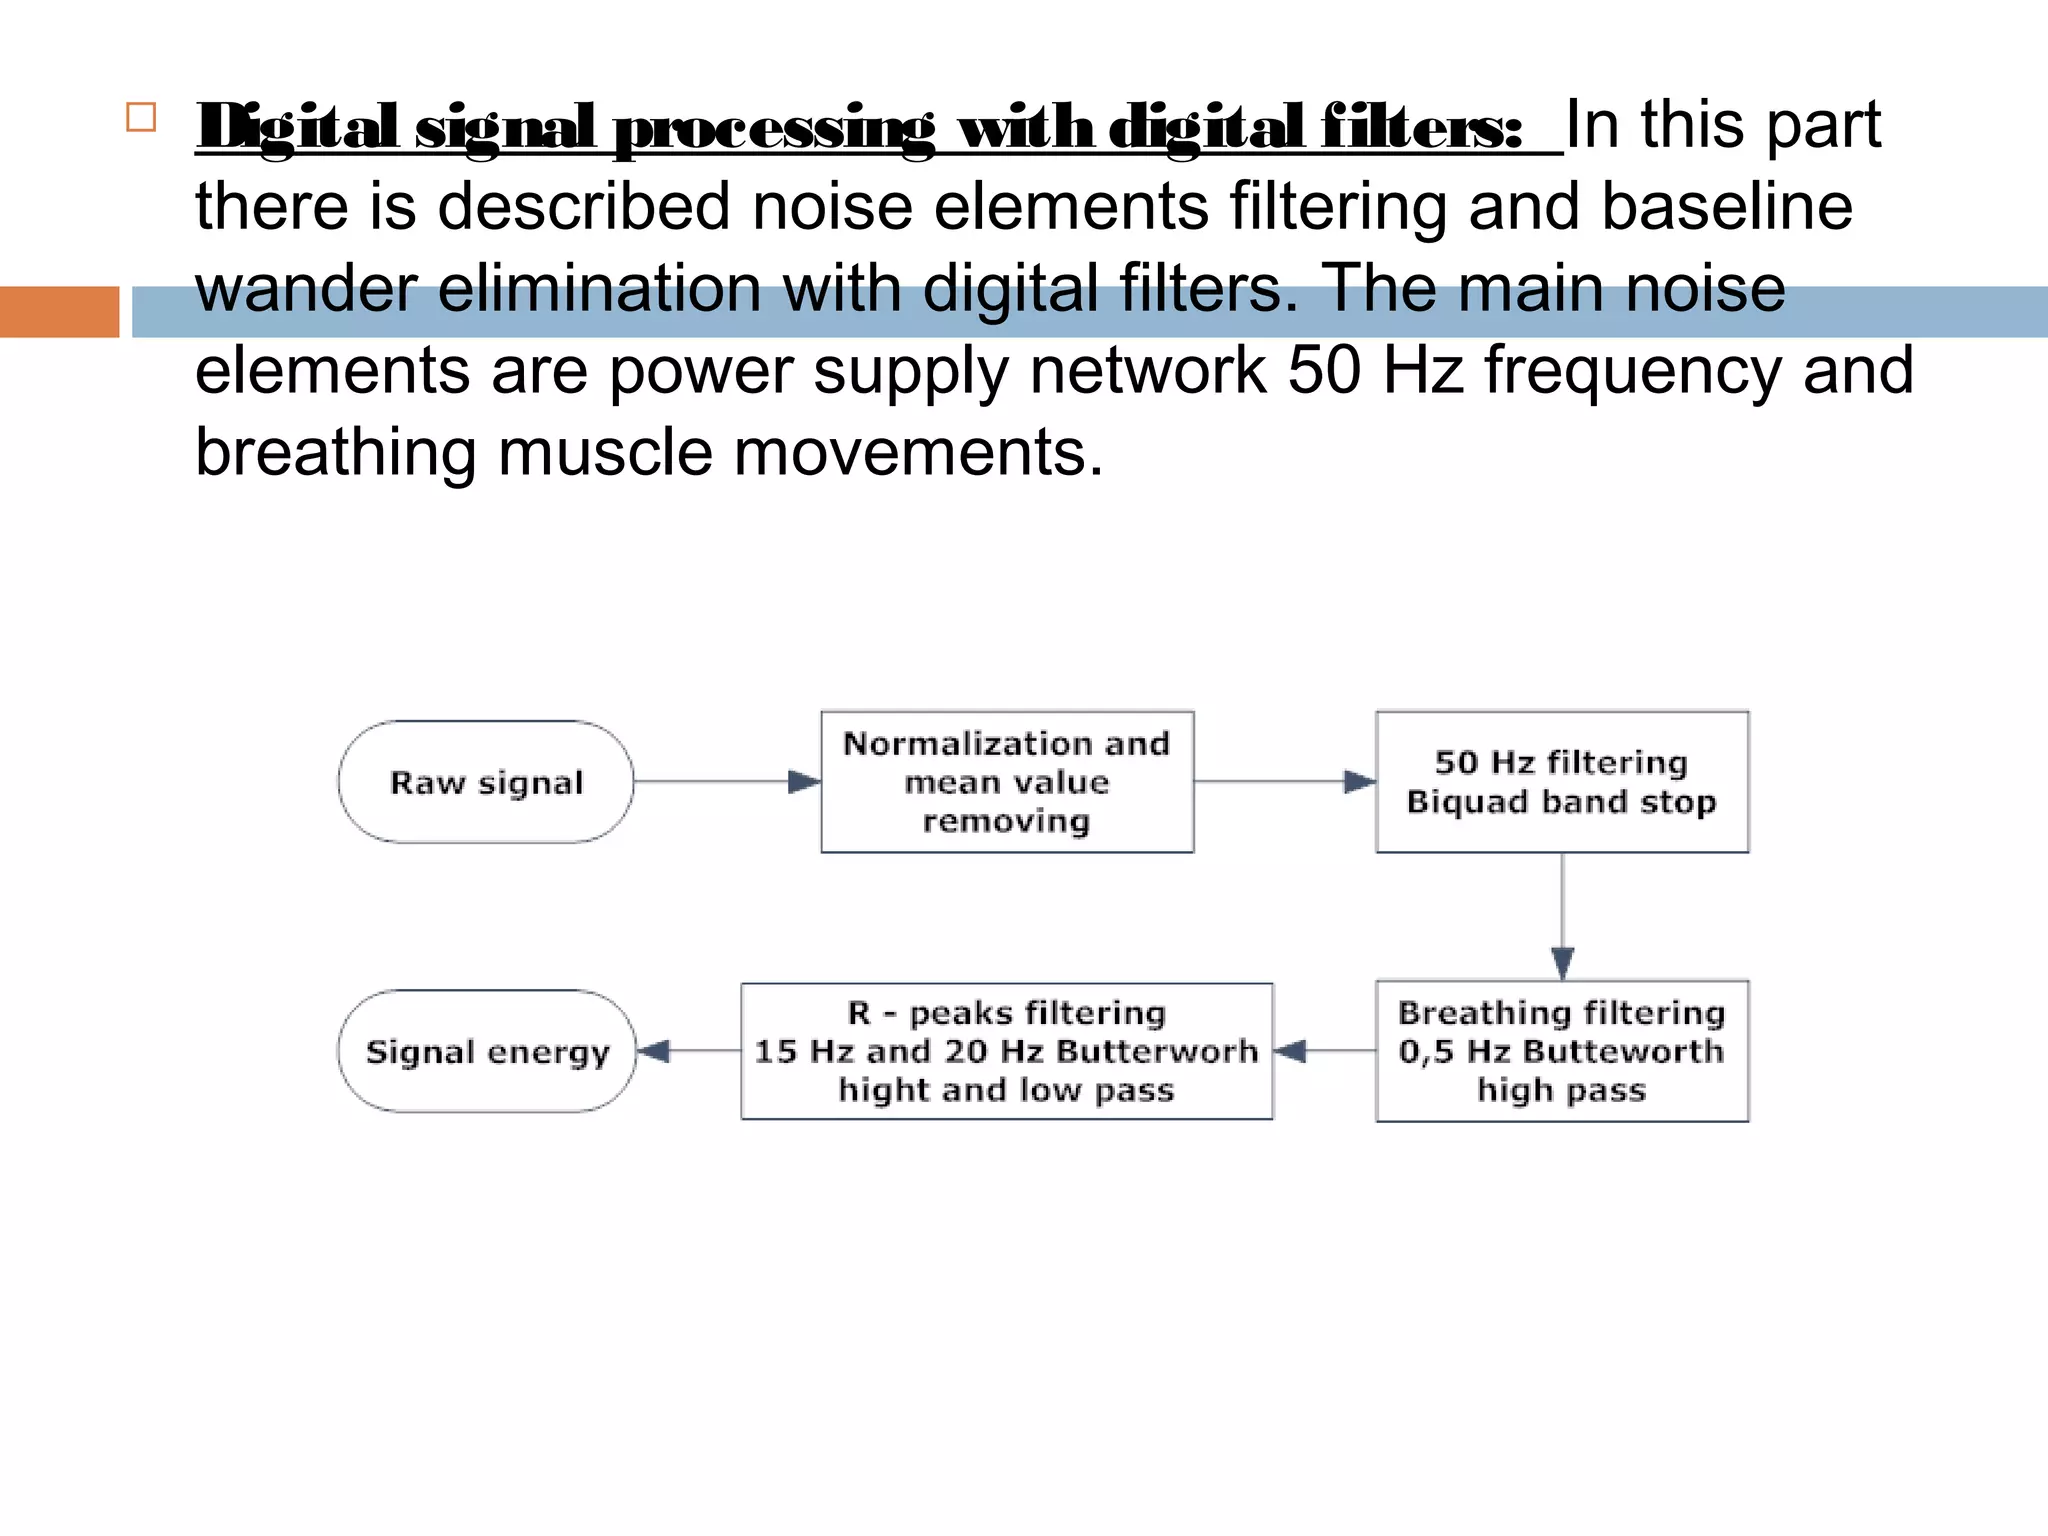
The document discusses the electrocardiogram (ECG), which measures and records the electrical activity of the heart. An ECG represents the atrial and ventricular depolarization and repolarization that occurs with each heartbeat. ECGs are obtained via electrodes placed on the skin and measure the potential differences. The ECG signal is analyzed in both the time and frequency domains to study cardiac features. A typical ECG consists of P, Q, R, S, and T waves that represent different electrical events in the heart. Digital signal processing is used to filter noise and detect the heart rate from the ECG signal.