Downloaded 215 times


![Different Types of Analyzers
1] Fourier Transform Analyzer
2] Swept-Tuned Analyzer](https://image.slidesharecdn.com/spectrumanalyzer-150921234357-lva1-app6891/85/Spectrum-analyzer-8-320.jpg)


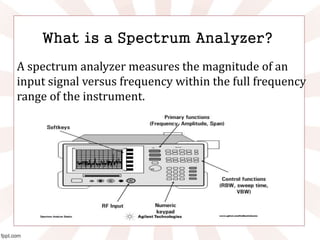
Spectrum analyzers measure the magnitude and frequency of input signals. There are two main types: Fourier transform analyzers which use digital signal processing to analyze the entire frequency range simultaneously, and swept-tuned analyzers which use analog filters to sweep through the frequency range. Key specifications for spectrum analyzers include frequency range, amplitude range and sensitivity to measure small signals, resolution bandwidth to distinguish closely spaced frequencies, and dynamic range to measure large and small signals simultaneously.