Download to read offline

![International Research Journal of Engineering and Technology (IRJET) e-ISSN: 2395 -0056
Volume: 04 Issue: 1 | Jan -2017 www.irjet.net p-ISSN: 2395-0072
© 2017, IRJET | Impact Factor value: 5.181 | ISO 9001:2008 Certified Journal | Page 99
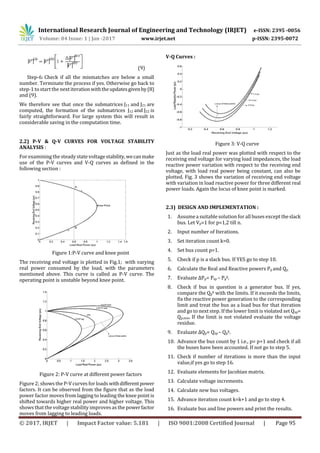
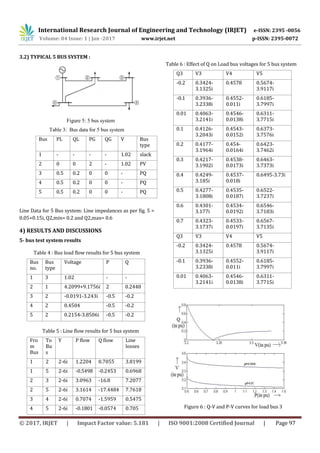
Figure 7 : V-Q curves and P-V curves for load bus 9
For a 5 bus and IEEE 14 bus system system, after performing
the load flow analysis using Newton Raphson method, the
following points can be inferred from the P-V curves and V-Q
curves :
If reactive power is injected into a load bus using
reactive power compensation methods, the power
factor of the load bus increases.
The P-V curve drawn at aconstantpowerfactorshiftsto
a higher power factor value on injection of the reactive
power at the bus.
Voltage stability is improved if reactive power is
injected into the load bus as due to increase in power
factor, higher values of voltages canbeobtainedatsame
active power at the bus.
In the curve obtained, the voltage become constant at
higher values of active power and thus the voltage
stability decreases but the system does not tend
towards the condition of voltage collapse and hence
differs from the real time systems as the system under
consideration is a standard system taking theoretical
values of different parameters at buses.
Load shedding isanother method for improvingvoltage
stability as the active power at the load bus decreases
thus improving the voltage.
In the V-Q curves obtained, system is unstabletotheleft
of the knee point of the curve as the voltage decreases
with increase in reactive power, but to the right of the
knee point, the voltage increases with increase in
reactive power and hence the system is stable for these
values.
5) CONCLUSIONS AND FUTURE WORK
By utilizing the curves obtained at differentpowerfactors
in P-V curves and at different values of active power in V-
Q curve at each of the substation being monitored and
obtaining the values of different parameters in real time,
we can define a definite instability margin.
If the real time system enters into this instability margin,
then we can take pre-emptive action against the problem
by alarming the operator to inject the reactive power at
the bus.
In case amount of reactive power compensation is less
than required, then after applying all the compensation
we can go for load shedding in such a way that voltage
stability can be improved.
If the values of different parameters can be obtained
continuously using new technologically advanced tools
like SCADA, then we can also handle Dynamic Voltage
Stability.
REFERENCES
[1]. C.W. Taylor. Power System VoltageStability.McGrawHill,
New York, 1994.
[2]. V. Borozan, M.E. Baran and D. Novosel, “Integrated
Volt/Var Control in Distribution Systems”, in Proc. of IEEE
Power Engineering Society Winter Meeting, 2001.
[3]. ChakrabartiA, Kothari D P and Mukhopadhyay ,
Performance, Operation and control of EHV Power
Transmission Systems, I st ed, New Delhi Wheeler ch no 6 pp
132 -141. 2000.
[4]. Wadhawa C.L. Electrical Power System V ed New Age
International (P) Limited Publishers, New Delhi.ch no 10 pp
no 226-228 2009.
[5]. Mark N Nwohu “Voltage Stability Improvement using
Static Var Compensator in Power Systems” LeonardoJournal
of Sciences ISSN pp1583-0233., January – June 2009.
[6]. “IEEE Recommended Practice for Excitation System
Models for Power System Stability Studies‟‟, IEEE Power
Engineering Society, New York, April 2006.
[7]. K. Vu: “Use of local measurements to estimate voltage
stability margin‟‟, in IEEE Transaction onPowerSystem,Vol.
14, No. 3, August 1999, p. 1029-123
[8]. Berger,A.R.;Vittal,Vijay;PowerSystemAnalysis;Pearson
Education; 2005.
[9]. Ray, S.; Electrical Power Systems; Prentice-Hall-India ;
2007
[10]. Gupta, B.R.; PowerSystemAnalysisandDesign;S.Chand
and Company Limited; 2003.](https://image.slidesharecdn.com/irjet-v4i115-171031071734/85/Power-Flow-Voltage-Stability-Analysis-using-MATLAB-7-320.jpg)

This document presents a MATLAB program for power flow analysis and voltage stability analysis of power systems. It begins with an introduction to power flow analysis and its importance. It then discusses voltage stability concepts like voltage collapse and improvement methods. The methodology section describes the Newton-Raphson power flow method and P-V and Q-V curves used for voltage stability analysis. It also provides the algorithm and case study details for the IEEE 14 bus system implemented in MATLAB. The program allows for power flow solutions, calculation of P-V and Q-V curves, and voltage stability assessment of power systems.