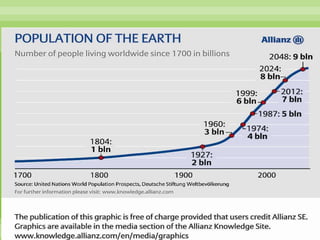
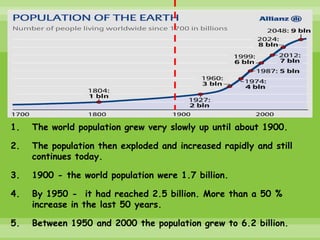
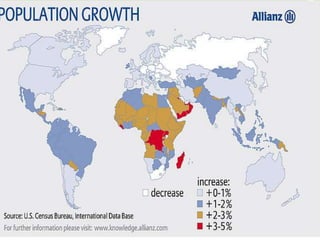
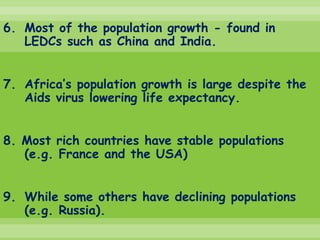
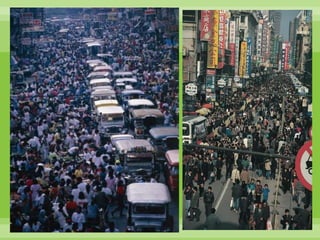
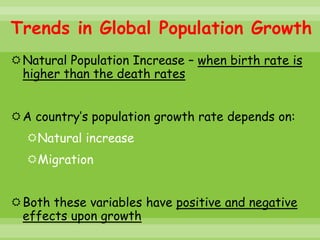
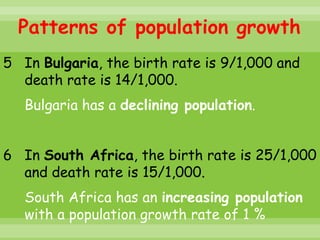
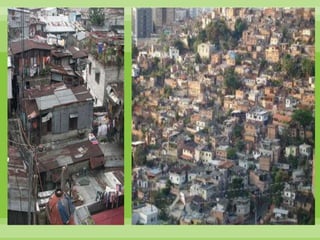
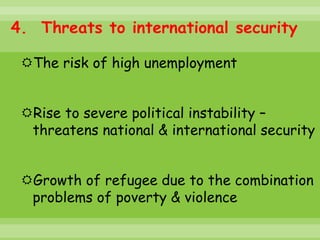
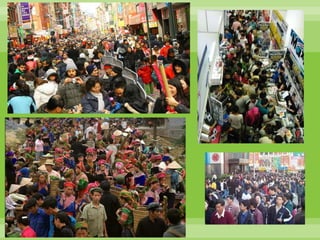
POPULATION


   World
 Populatio
         n
  Growth
1.   The world population grew very slowly up until about 1900.

2.   The population then exploded and increased rapidly and still
     continues today.

3.   1900 - the world population were 1.7 billion.

4.   By 1950 - it had reached 2.5 billion. More than a 50 %
     increase in the last 50 years.

5.   Between 1950 and 2000 the population grew to 6.2 billion.
World Population
4. By late 2011, it had reached 7 billion.


5. The near future Global population shows
   no sign of slowing down.


6. The world population has continued to
   grow because the birth rate has
   remained higher than the death rate
6. Most of the population growth - found in
   LEDCs such as China and India.


7. Africa’s population growth is large despite the
   Aids virus lowering life expectancy.


8. Most rich countries have stable populations
   (e.g. France and the USA)


9. While some others have declining populations
   (e.g. Russia).
Countries which are projected to
 have largest population growth:
The top countries in order of the expected increase
in population between 2010 and 2050 are:
  (1) India 467 million projected   (6) DR Congo 83 million
      population increase


  (2) Nigeria 231 million           (7) Ethiopia 62 million

  (3) Pakistan 101 million          (8) Philippines 62 million

  (4) Tanzania 93 million           (9) Uganda 61 million

  (5) United States 93 million      (10) Kenya 56 million
Trends in Global Population Growth
Natural Population Increase – when birth rate is
 higher than the death rates


A country’s population growth rate depends on:
  Natural increase
  Migration


Both these variables have positive and negative
 effects upon growth
Patterns of population growth
1.   Rates of population growth vary across the world.

2. Although the world's total population is rising
   rapidly, not all countries are experiencing this
   growth.

3. In the UK, for example, population growth is
   slowing, while in Germany the population has
   started to decline.
Patterns of population growth
3. MEDCs have low population growth
   rates, with low death rates and low birth
   rates.


4. LEDCs have high population growth rates.
   Both birth rates and death rates in LEDCs
   tend to be high. However, improving
   healthcare leads to death rates falling -
   while birth rates remain high.
The table shows data in selected LEDC and MEDC
countries. The figures are per 1,000 of the population per
year
Patterns of population growth
5 In Bulgaria, the birth rate is 9/1,000 and
  death rate is 14/1,000.
   Bulgaria has a declining population.


6 In South Africa, the birth rate is 25/1,000
  and death rate is 15/1,000.
   South Africa has an increasing population
   with a population growth rate of 1 %
Reasons for population growth:
The creation of modern economics system as a
 result of the agricultural & industrial revolution


The vast knowledge of medical has increased the
 rate of babies born and decreased death rate


Modern technology and communications have
 enable us to tackle and overcome the worst
 effects of floods, famine and other natural
 hazards
Problems of population growth:
1. Creates great demands on governments to
   provide for people


2. Increased pressure on the environment


3. Increased risk of famine and malnutrition


4. Threats to international security
1.   Creates great demands on governments to
     provide for people

 Rapid population growth aggravates poverty in
  developing countries

 High ratio of dependent children for each working
  adult

 High % income spend on immediate survival needs
  (food, clothes, housing..etc) leaving little money
  for investment in the economy, education, govt
  services or infrastructures
2. Increased pressure on the environment
 The expansion of human activities – associated with the loss of
  habitat


 Extinction of plants and animal species world wide


 Loss of biological diversity leads to instability of ecological
  system esp those that are stressed by climate change


 Water pollution leads to intolerable health conditions for
  people


 On global basis, the emissions of greenhouse gases -CO2 are
  rising rather than falling
Endangered animals
3. Increased risk of famine and malnutrition
 Water shortages – water tables on every continent are falling


 Water is pumped out far greater than rainwater can replenish –
  e.g. India pumped water twice the rate of natural replenishment


 Due to industrialisation – loss of agricultural land


 Demand for more meat instead of grains


 Great demands of food will certainly drive the price of food up
4. Threats to international security

 The risk of high unemployment


 Rise to severe political instability –
  threatens national & international security


 Growth of refugee due to the combination
  problems of poverty & violence
Population lesson 1   world population growth

Population lesson 1 world population growth

  • 1.
    POPULATION World Populatio n Growth
  • 3.
    1. The world population grew very slowly up until about 1900. 2. The population then exploded and increased rapidly and still continues today. 3. 1900 - the world population were 1.7 billion. 4. By 1950 - it had reached 2.5 billion. More than a 50 % increase in the last 50 years. 5. Between 1950 and 2000 the population grew to 6.2 billion.
  • 4.
    World Population 4. Bylate 2011, it had reached 7 billion. 5. The near future Global population shows no sign of slowing down. 6. The world population has continued to grow because the birth rate has remained higher than the death rate
  • 6.
    6. Most ofthe population growth - found in LEDCs such as China and India. 7. Africa’s population growth is large despite the Aids virus lowering life expectancy. 8. Most rich countries have stable populations (e.g. France and the USA) 9. While some others have declining populations (e.g. Russia).
  • 8.
    Countries which areprojected to have largest population growth: The top countries in order of the expected increase in population between 2010 and 2050 are: (1) India 467 million projected (6) DR Congo 83 million population increase (2) Nigeria 231 million (7) Ethiopia 62 million (3) Pakistan 101 million (8) Philippines 62 million (4) Tanzania 93 million (9) Uganda 61 million (5) United States 93 million (10) Kenya 56 million
  • 9.
    Trends in GlobalPopulation Growth Natural Population Increase – when birth rate is higher than the death rates A country’s population growth rate depends on: Natural increase Migration Both these variables have positive and negative effects upon growth
  • 11.
    Patterns of populationgrowth 1. Rates of population growth vary across the world. 2. Although the world's total population is rising rapidly, not all countries are experiencing this growth. 3. In the UK, for example, population growth is slowing, while in Germany the population has started to decline.
  • 12.
    Patterns of populationgrowth 3. MEDCs have low population growth rates, with low death rates and low birth rates. 4. LEDCs have high population growth rates. Both birth rates and death rates in LEDCs tend to be high. However, improving healthcare leads to death rates falling - while birth rates remain high.
  • 13.
    The table showsdata in selected LEDC and MEDC countries. The figures are per 1,000 of the population per year
  • 14.
    Patterns of populationgrowth 5 In Bulgaria, the birth rate is 9/1,000 and death rate is 14/1,000. Bulgaria has a declining population. 6 In South Africa, the birth rate is 25/1,000 and death rate is 15/1,000. South Africa has an increasing population with a population growth rate of 1 %
  • 15.
    Reasons for populationgrowth: The creation of modern economics system as a result of the agricultural & industrial revolution The vast knowledge of medical has increased the rate of babies born and decreased death rate Modern technology and communications have enable us to tackle and overcome the worst effects of floods, famine and other natural hazards
  • 16.
    Problems of populationgrowth: 1. Creates great demands on governments to provide for people 2. Increased pressure on the environment 3. Increased risk of famine and malnutrition 4. Threats to international security
  • 17.
    1. Creates great demands on governments to provide for people Rapid population growth aggravates poverty in developing countries High ratio of dependent children for each working adult High % income spend on immediate survival needs (food, clothes, housing..etc) leaving little money for investment in the economy, education, govt services or infrastructures
  • 19.
    2. Increased pressureon the environment  The expansion of human activities – associated with the loss of habitat  Extinction of plants and animal species world wide  Loss of biological diversity leads to instability of ecological system esp those that are stressed by climate change  Water pollution leads to intolerable health conditions for people  On global basis, the emissions of greenhouse gases -CO2 are rising rather than falling
  • 20.
  • 22.
    3. Increased riskof famine and malnutrition  Water shortages – water tables on every continent are falling  Water is pumped out far greater than rainwater can replenish – e.g. India pumped water twice the rate of natural replenishment  Due to industrialisation – loss of agricultural land  Demand for more meat instead of grains  Great demands of food will certainly drive the price of food up
  • 23.
    4. Threats tointernational security The risk of high unemployment Rise to severe political instability – threatens national & international security Growth of refugee due to the combination problems of poverty & violence