Downloaded 522 times


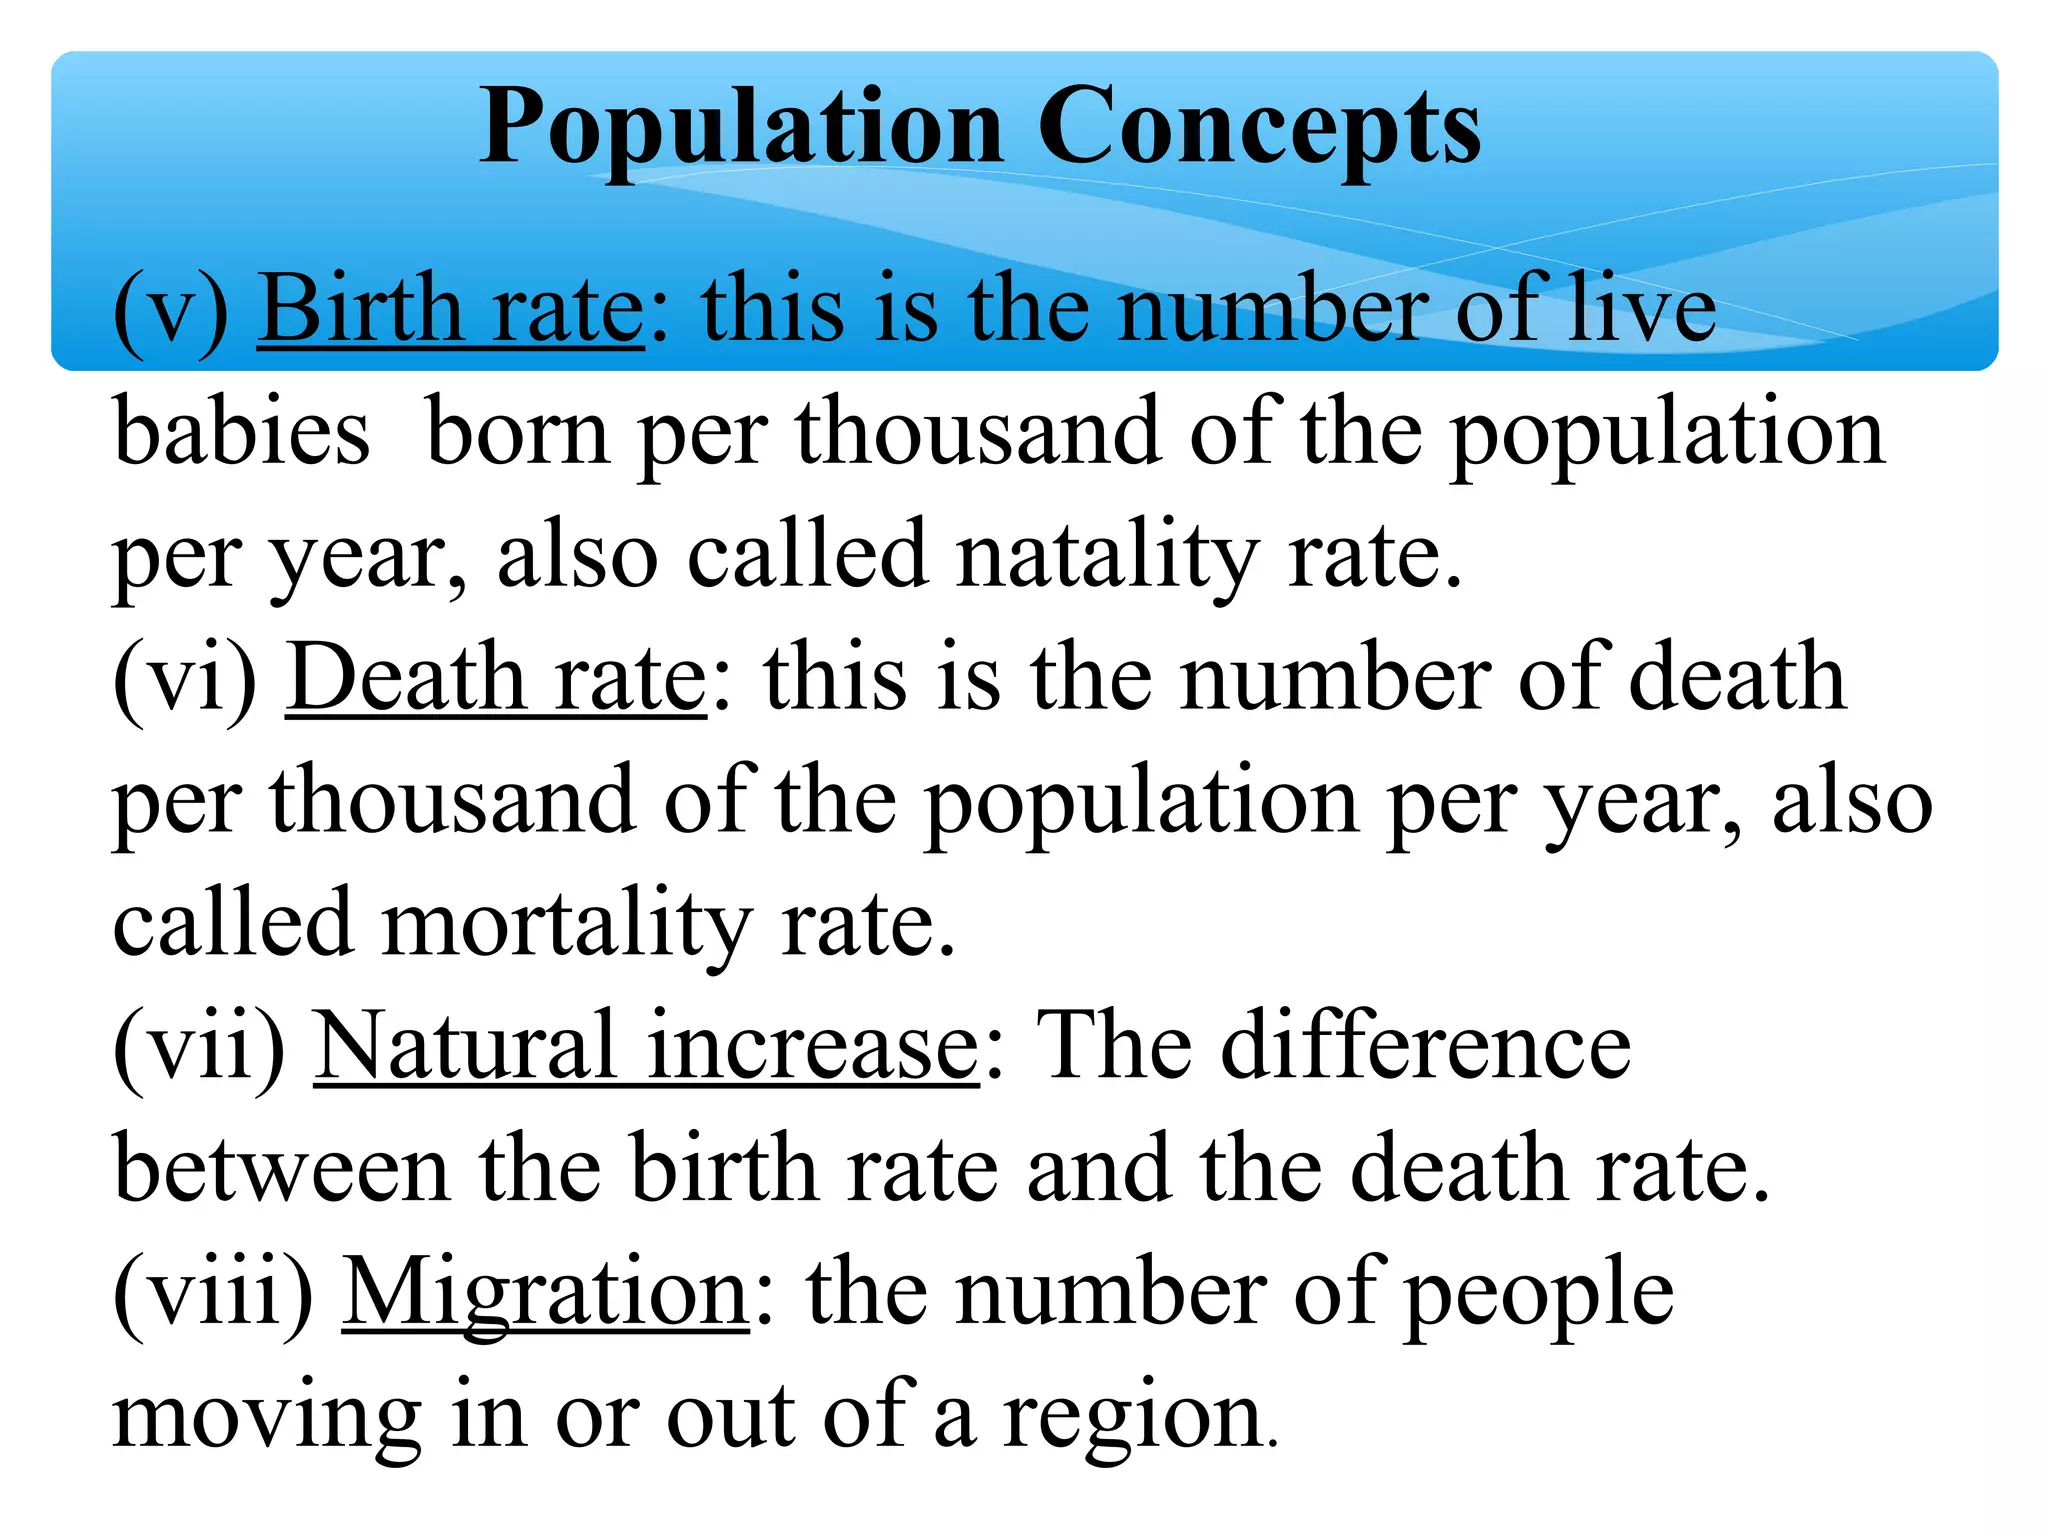

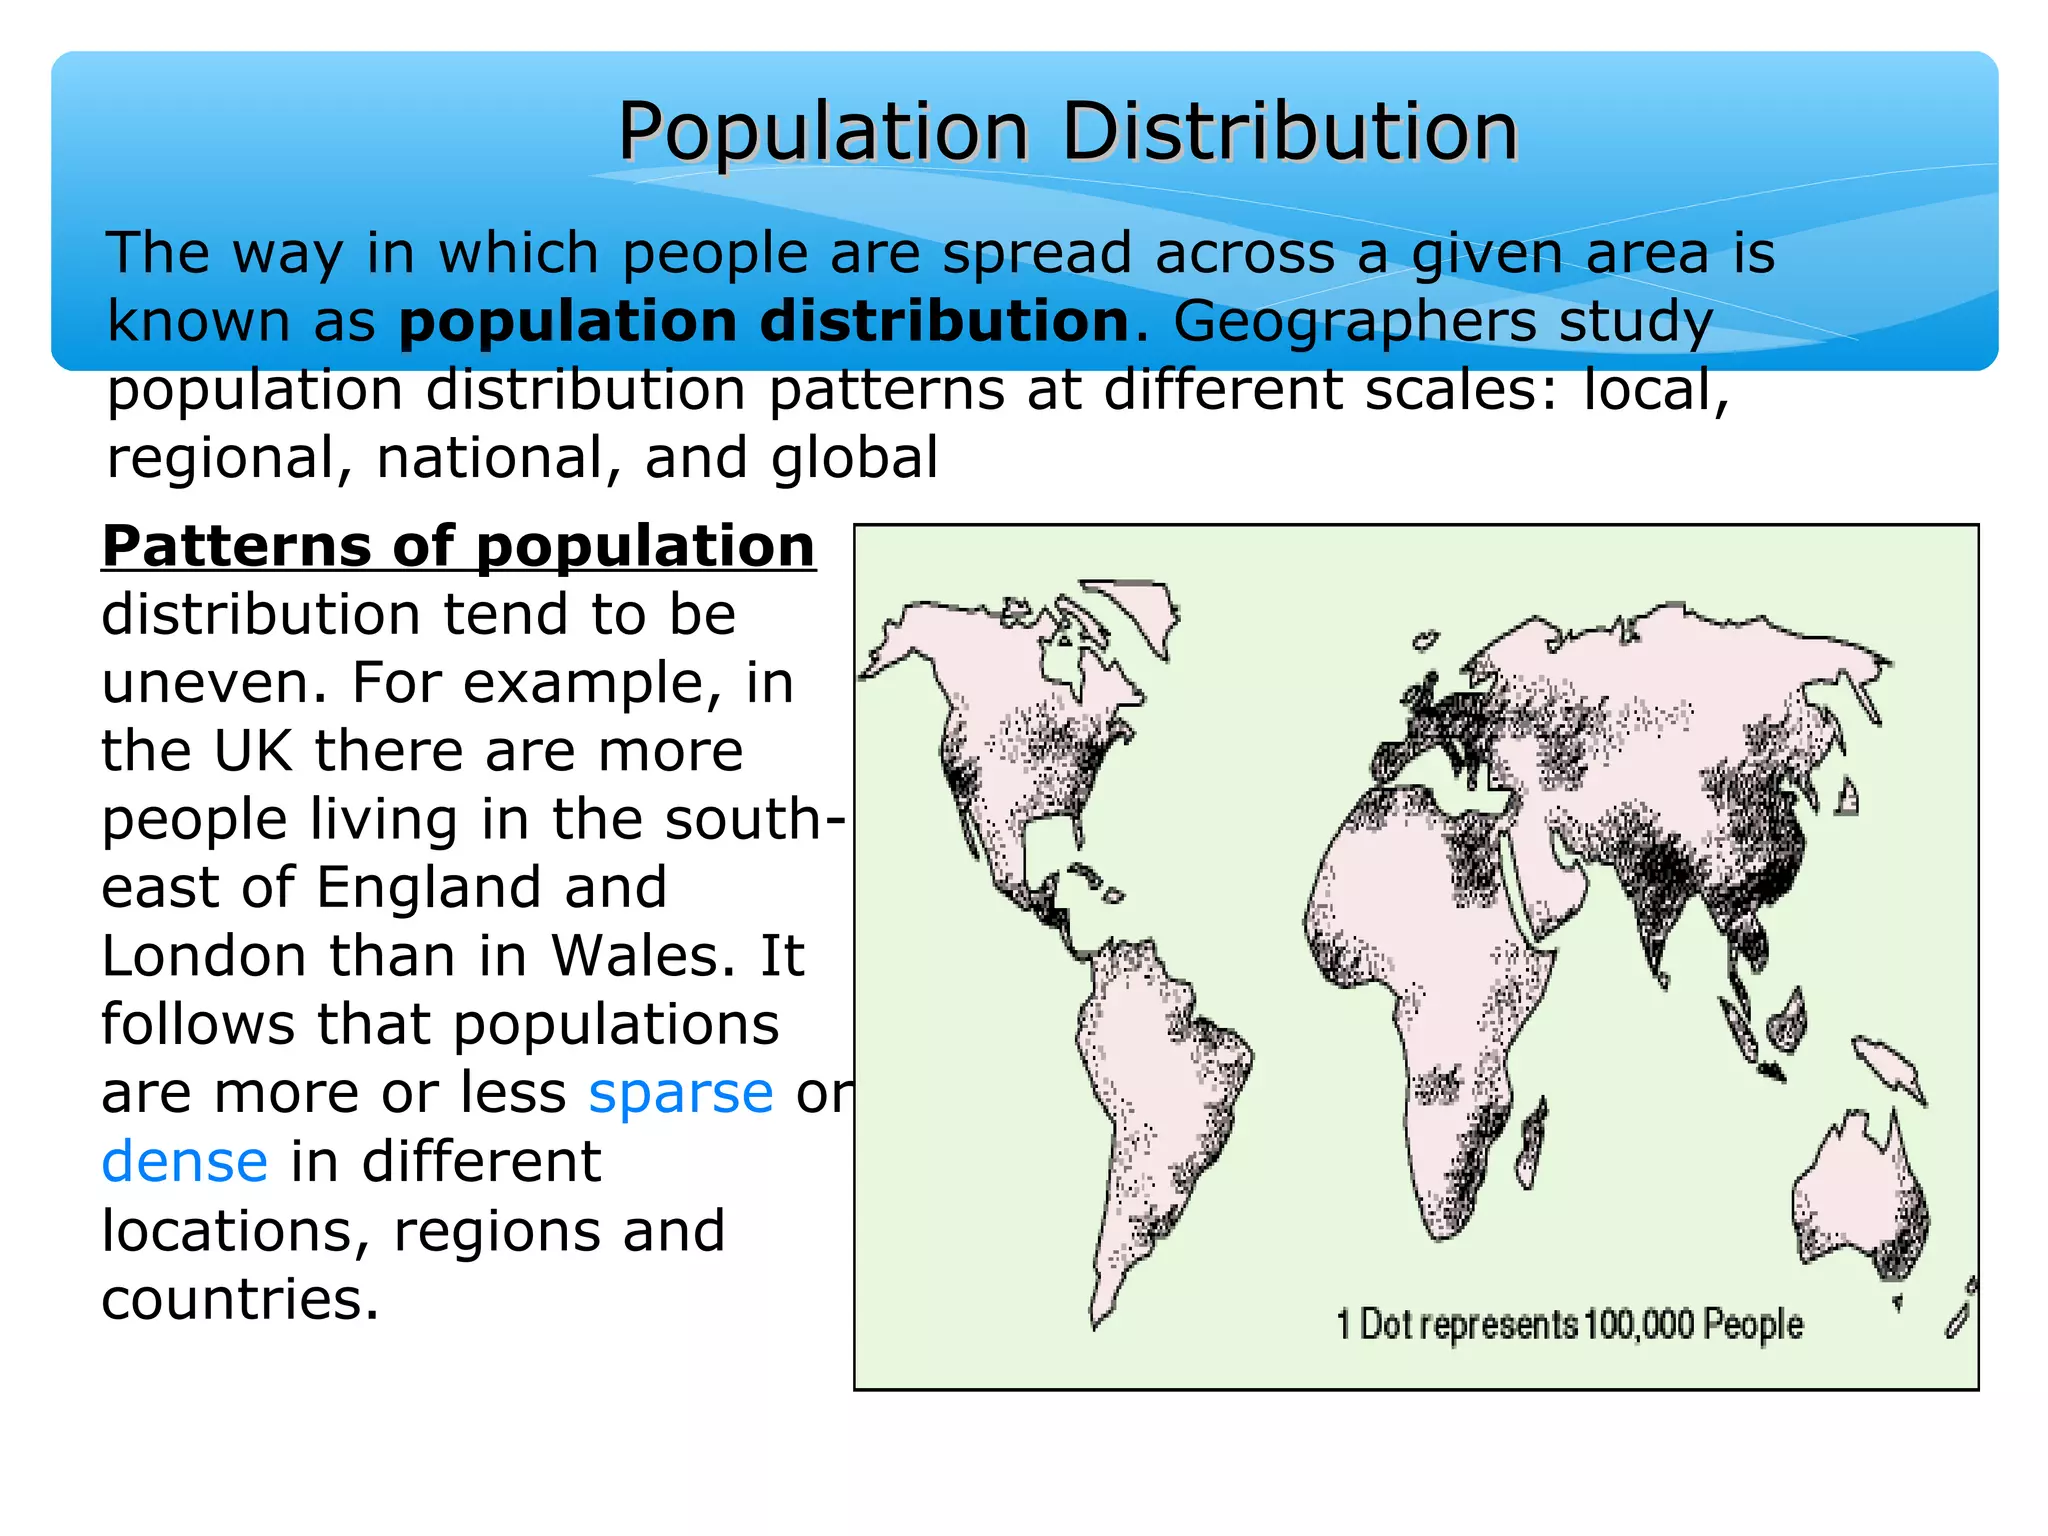


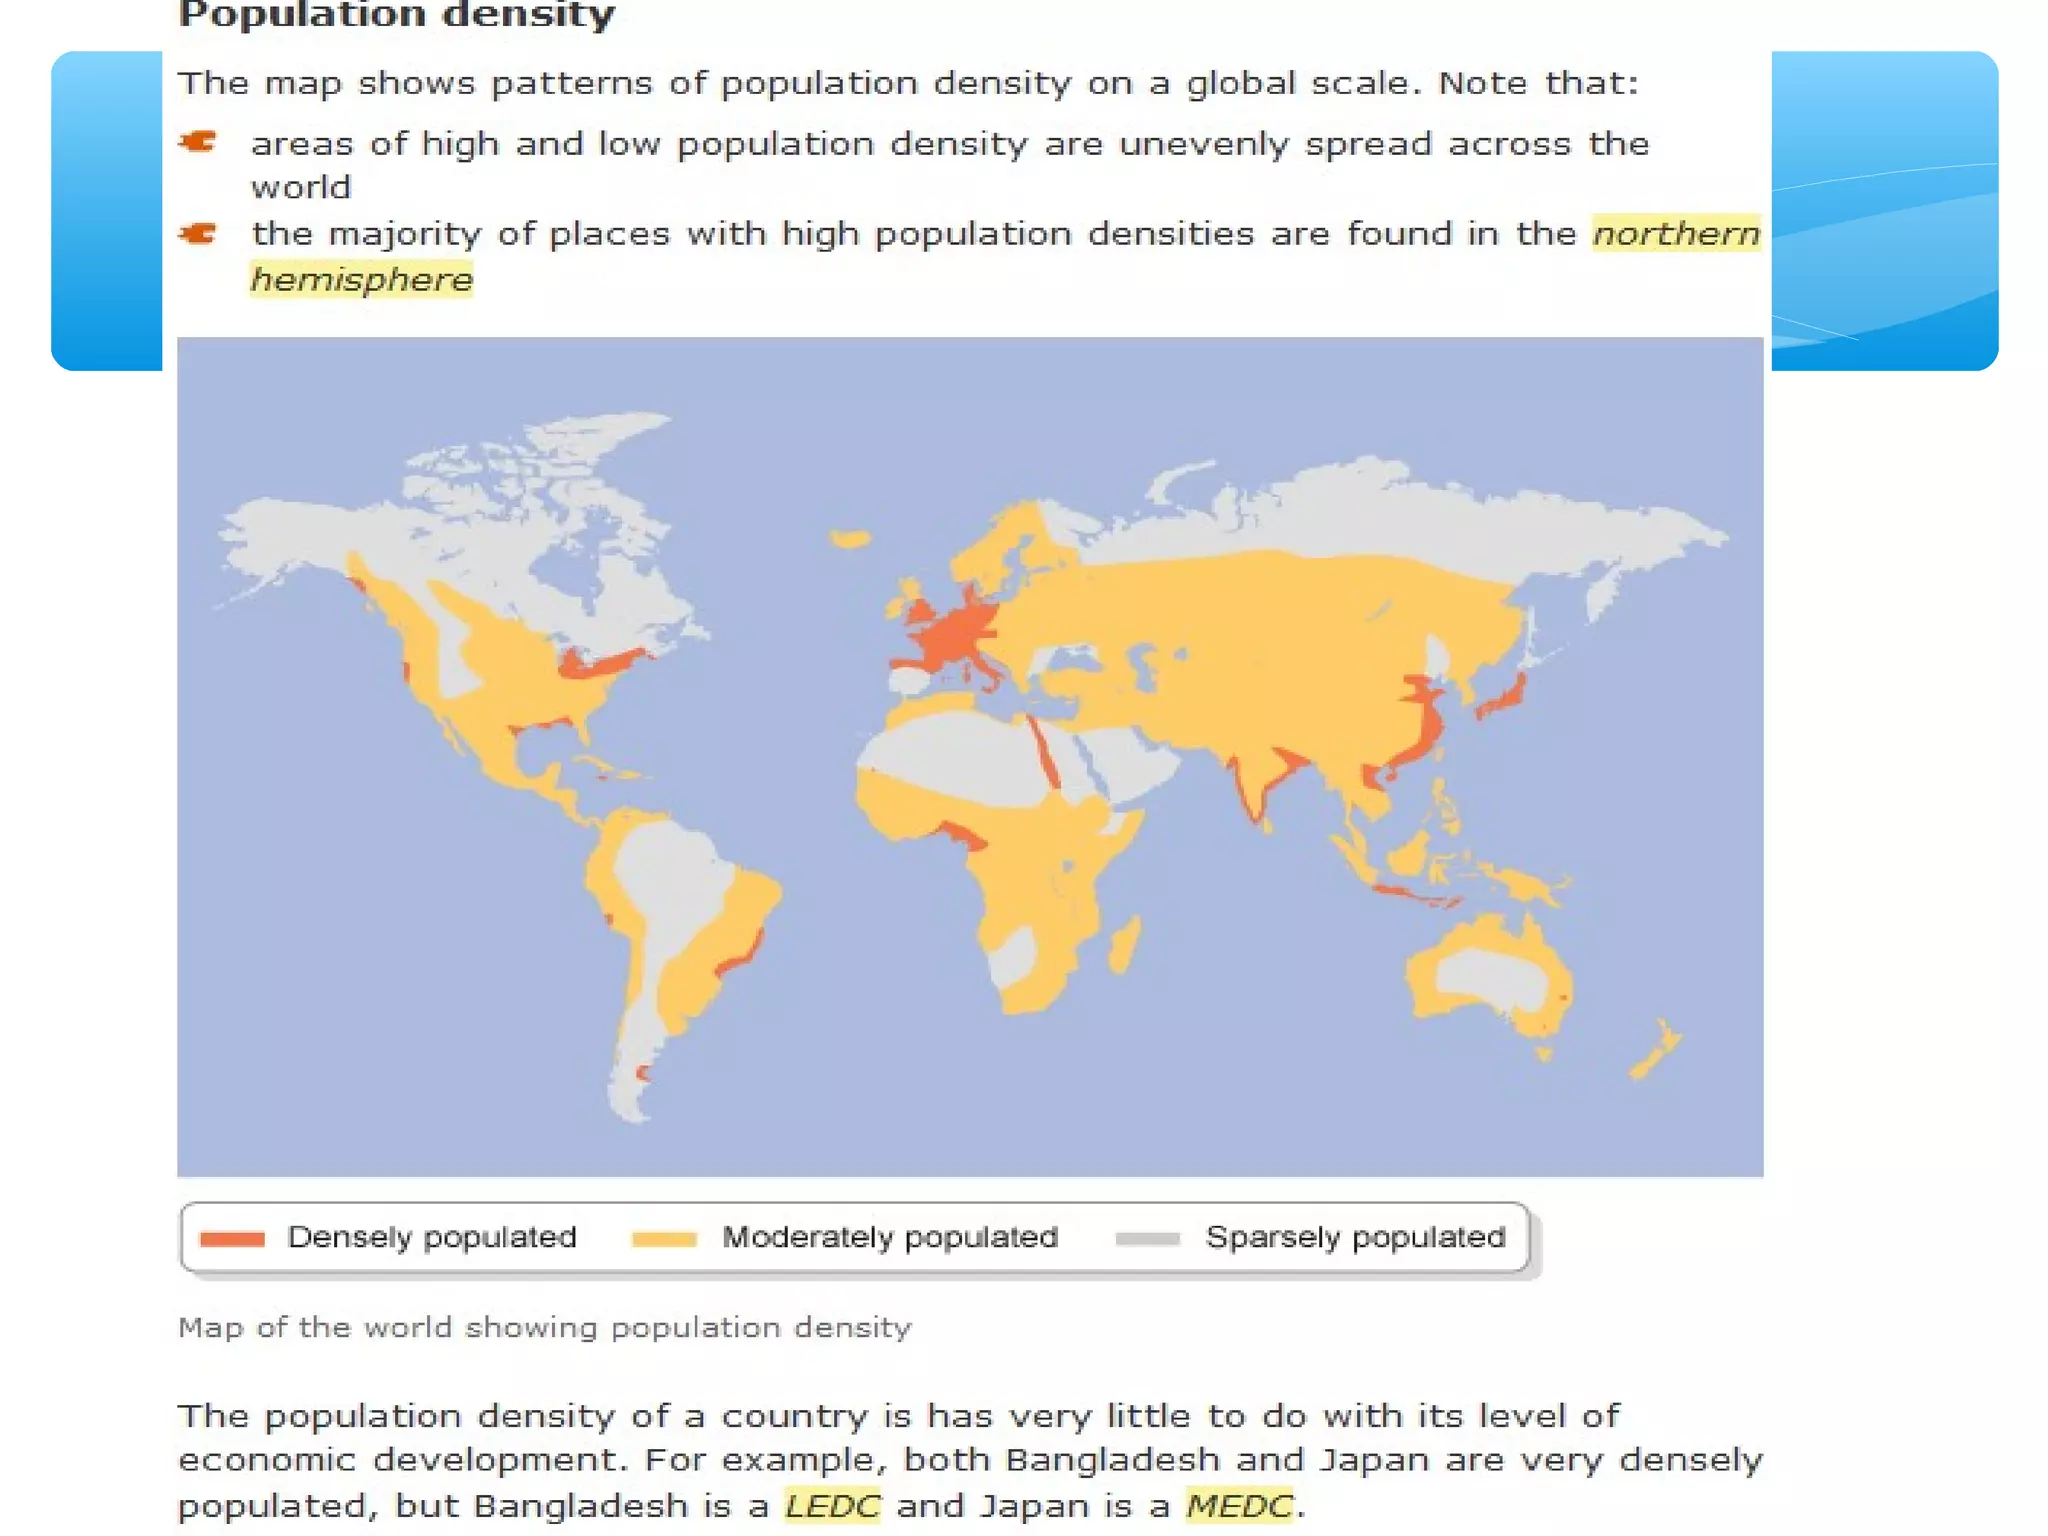
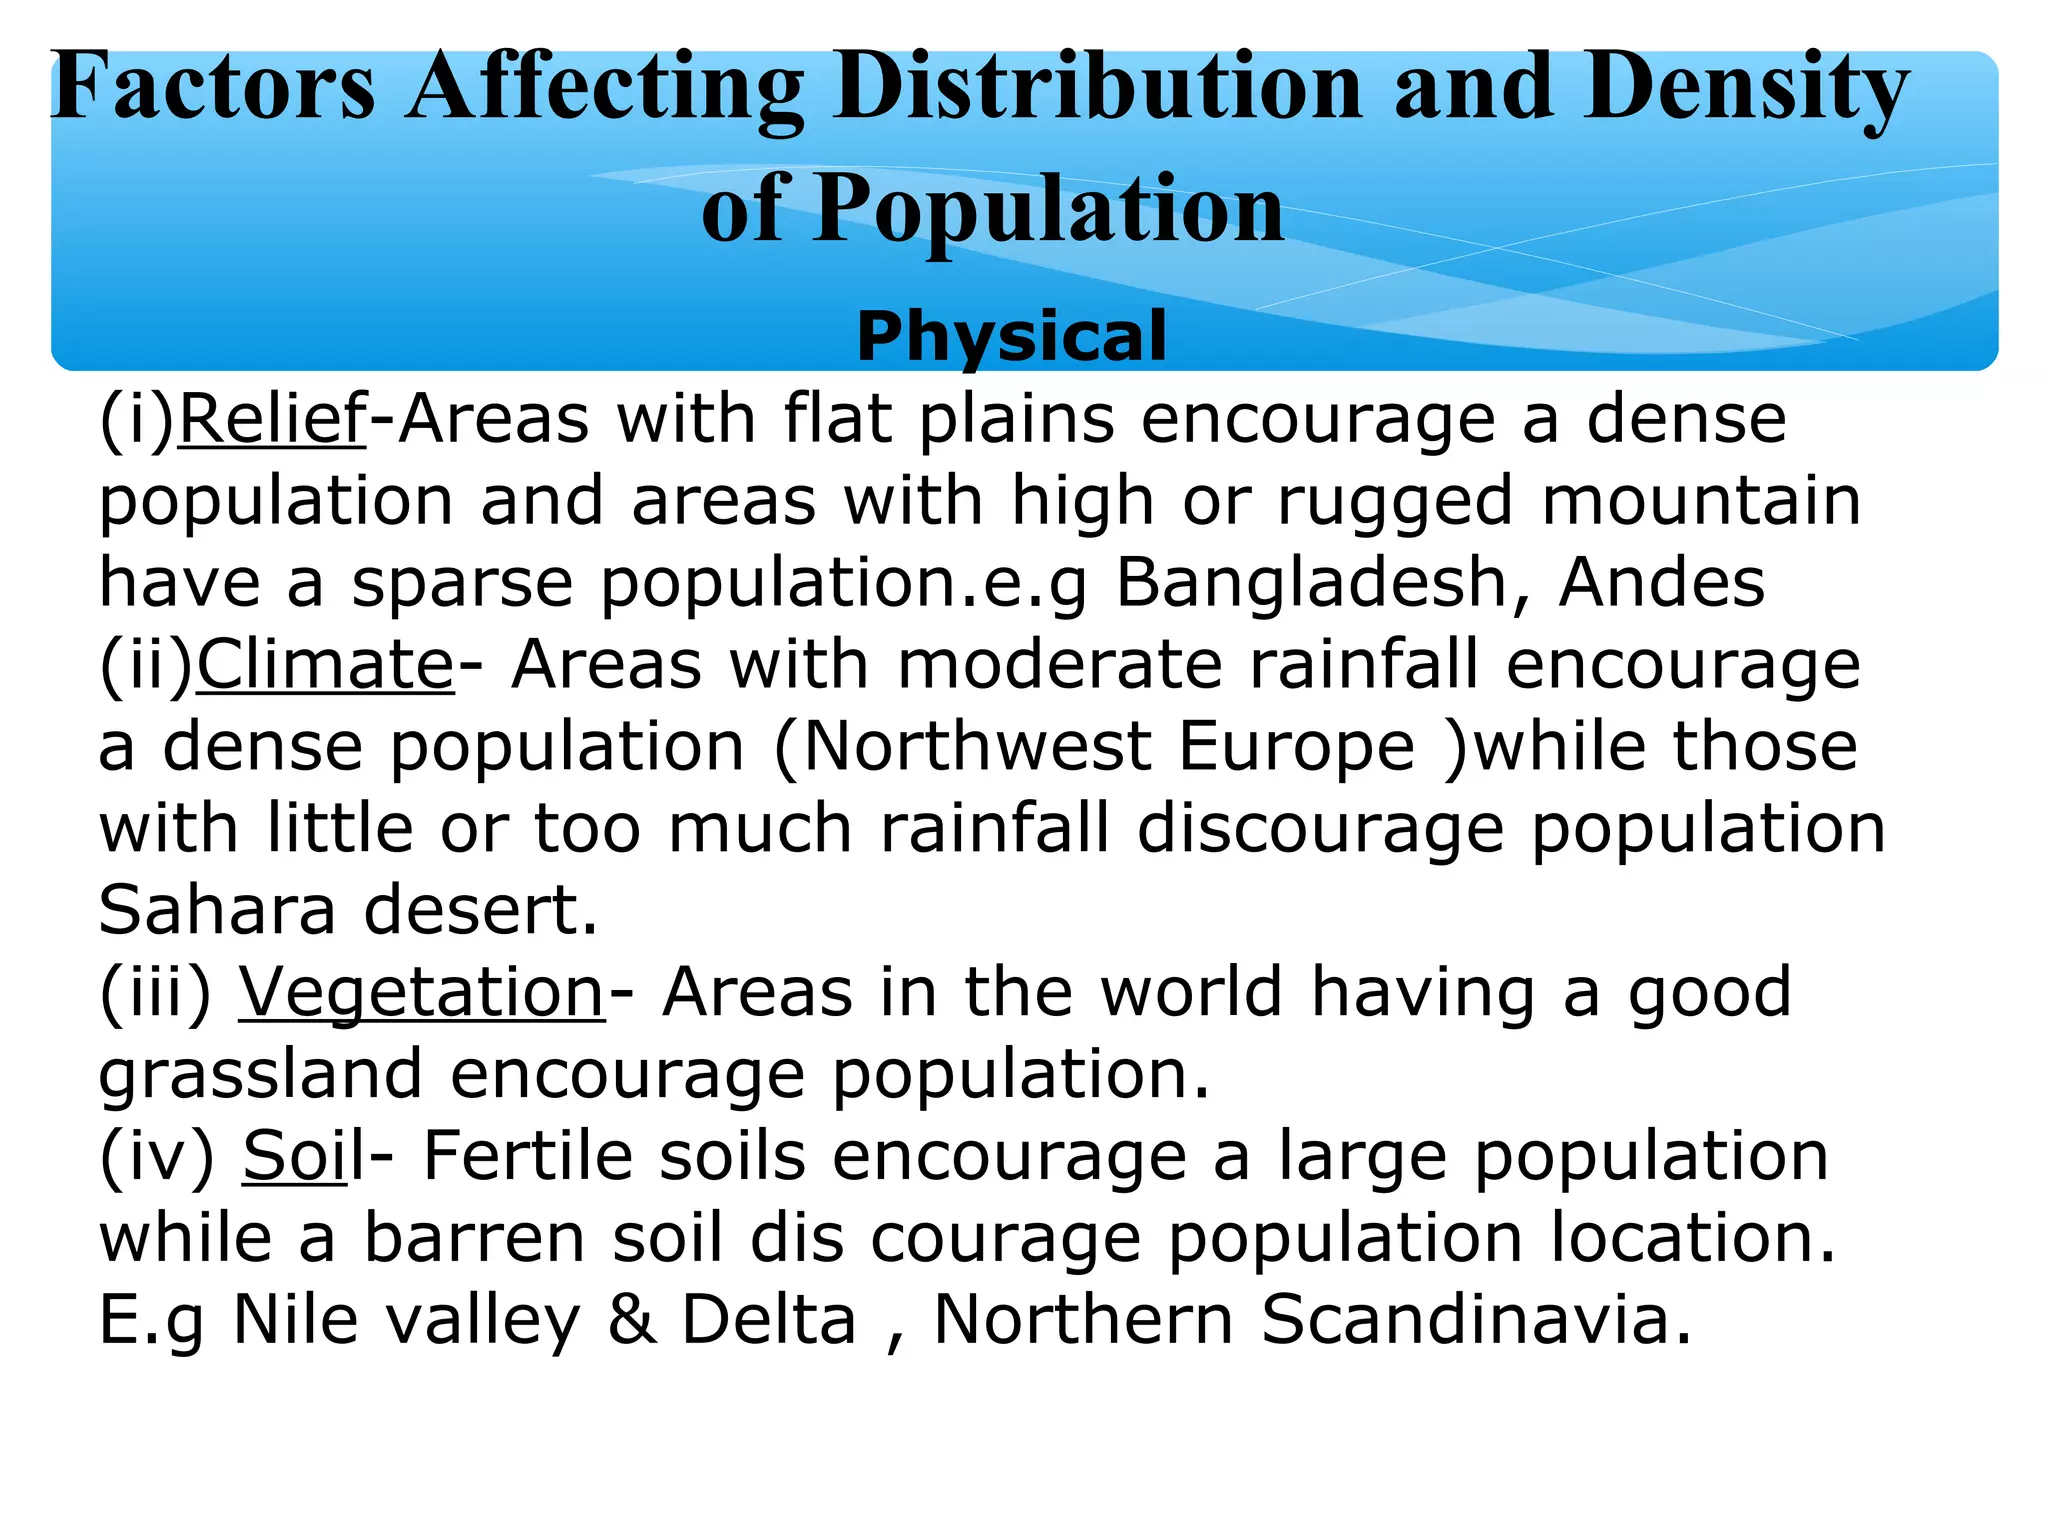
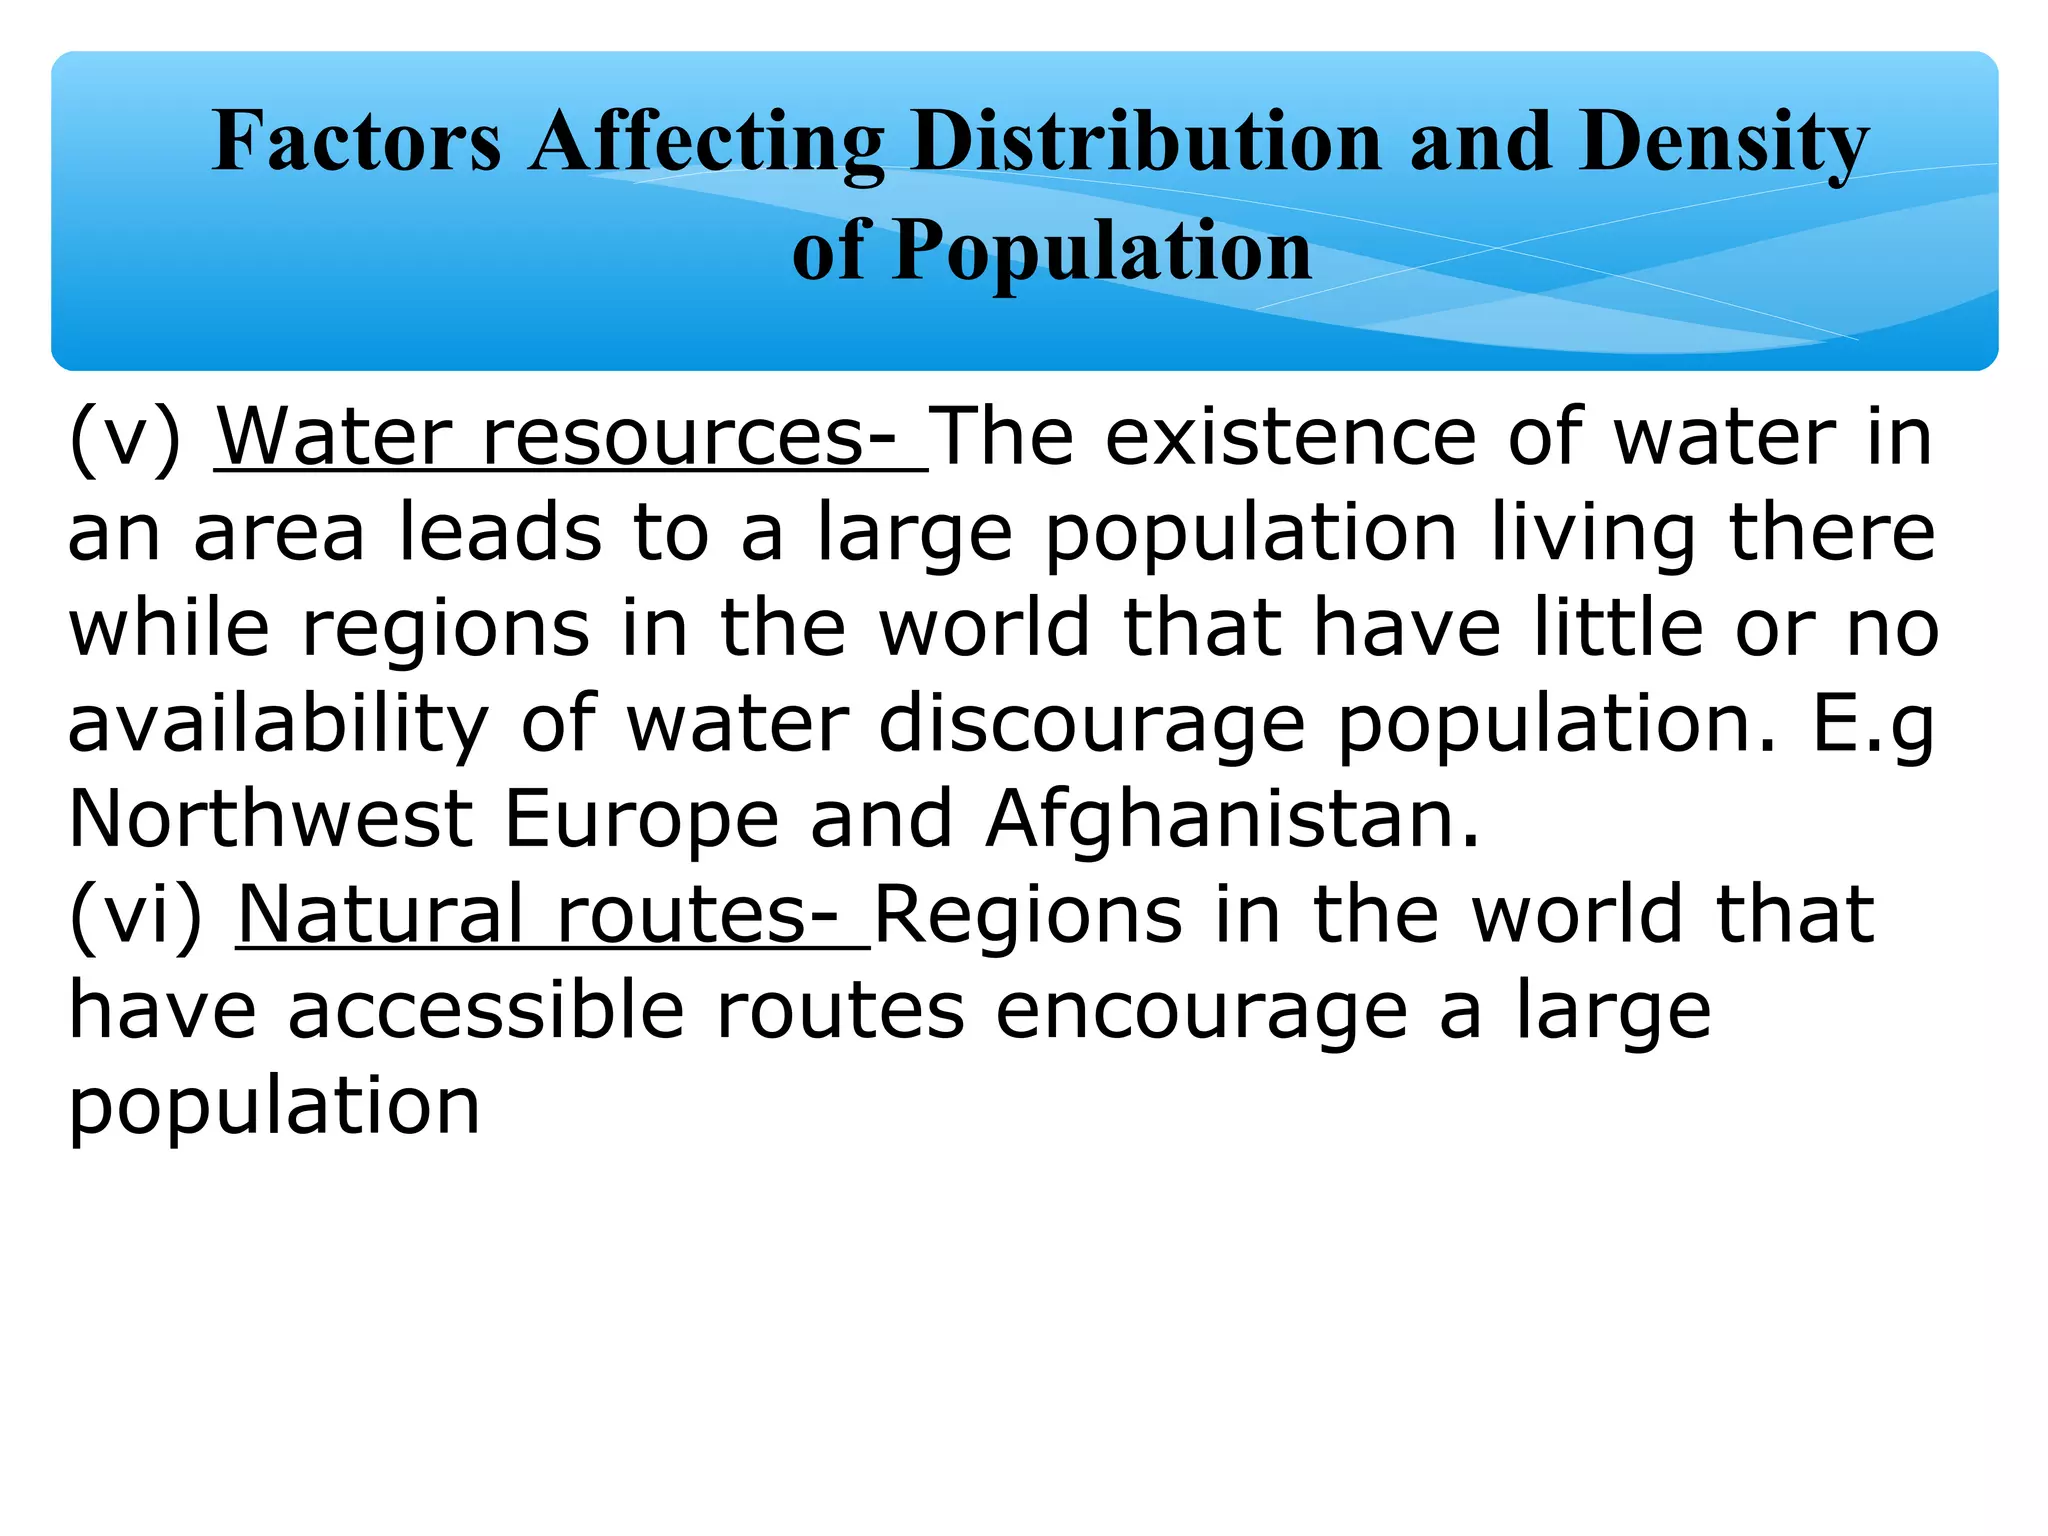


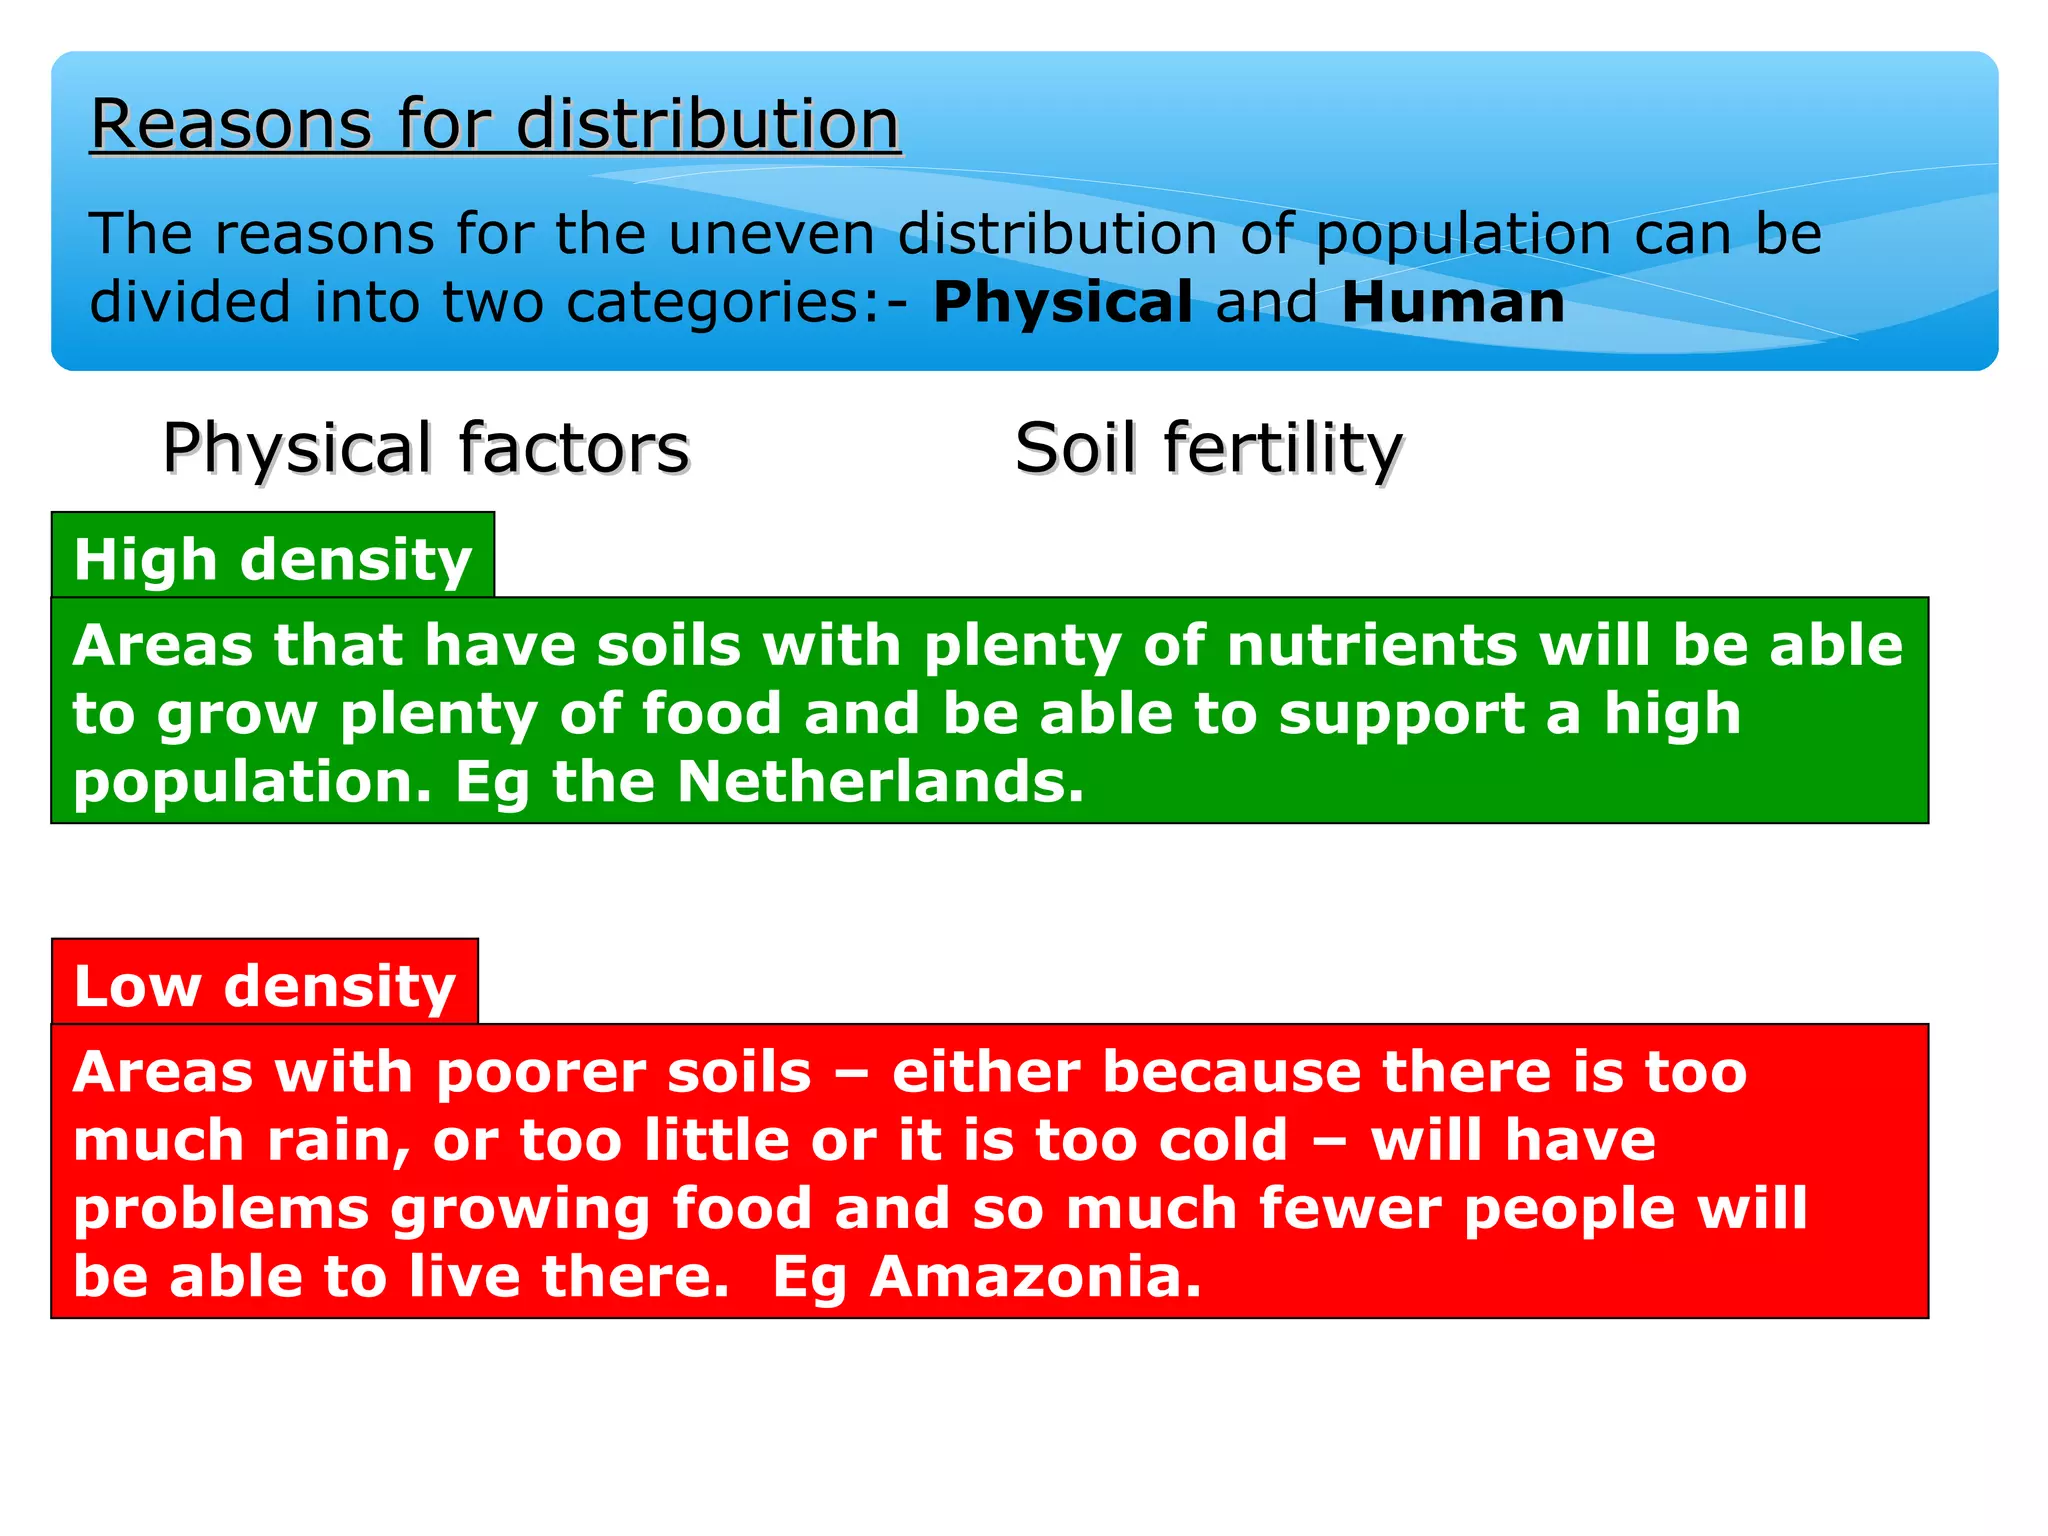


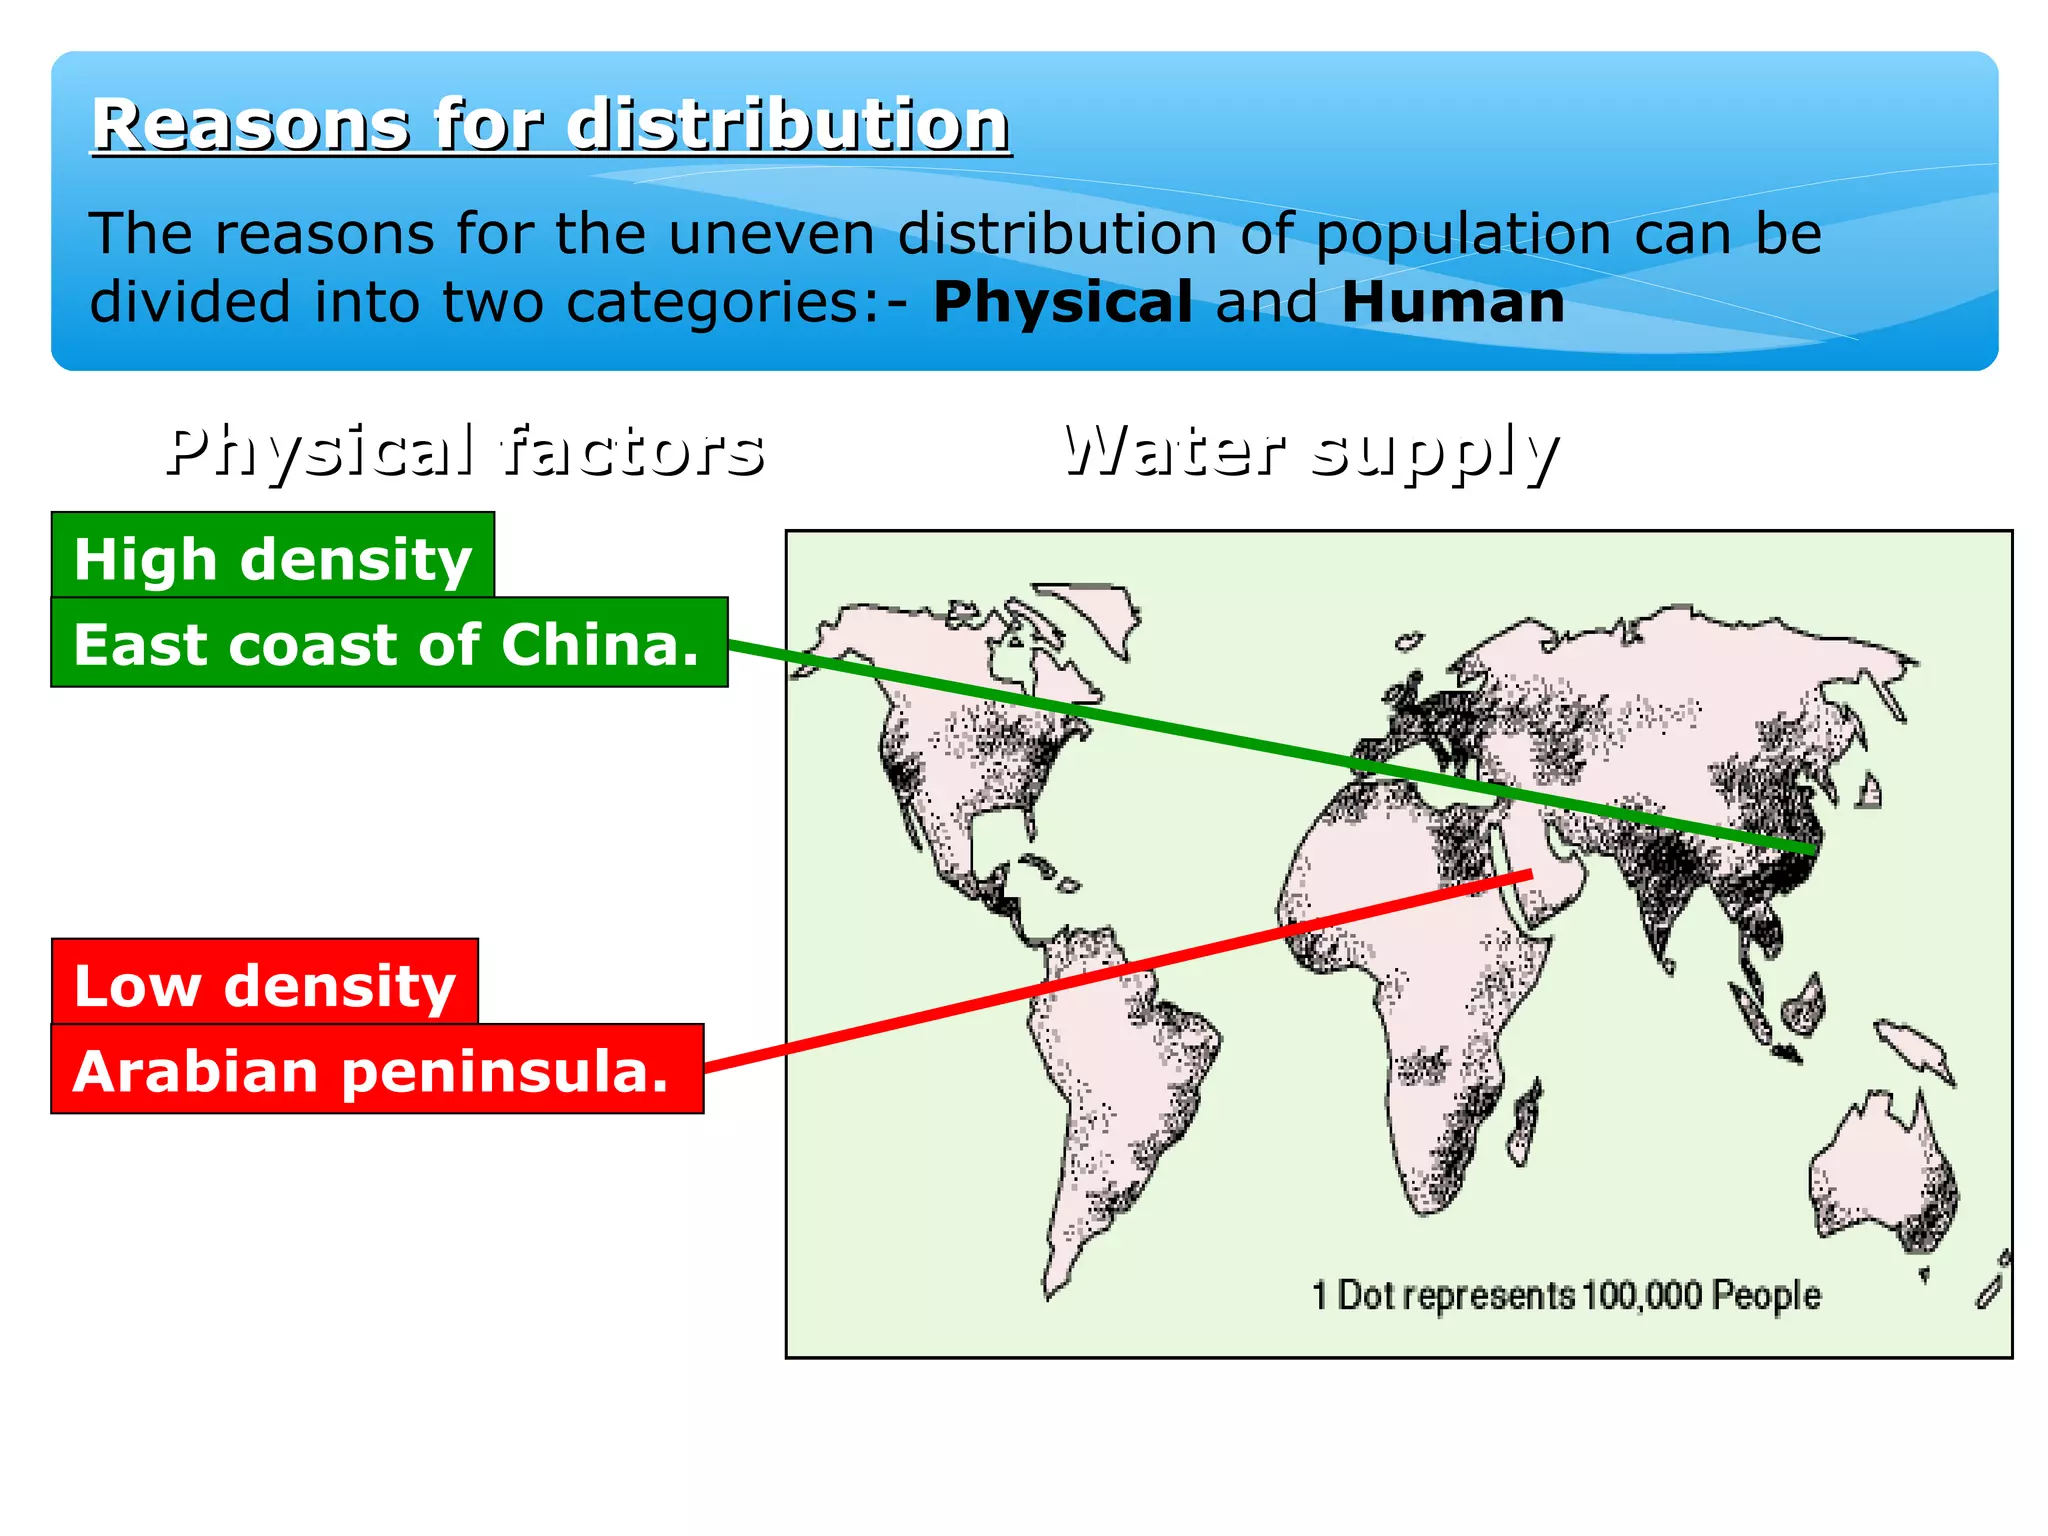


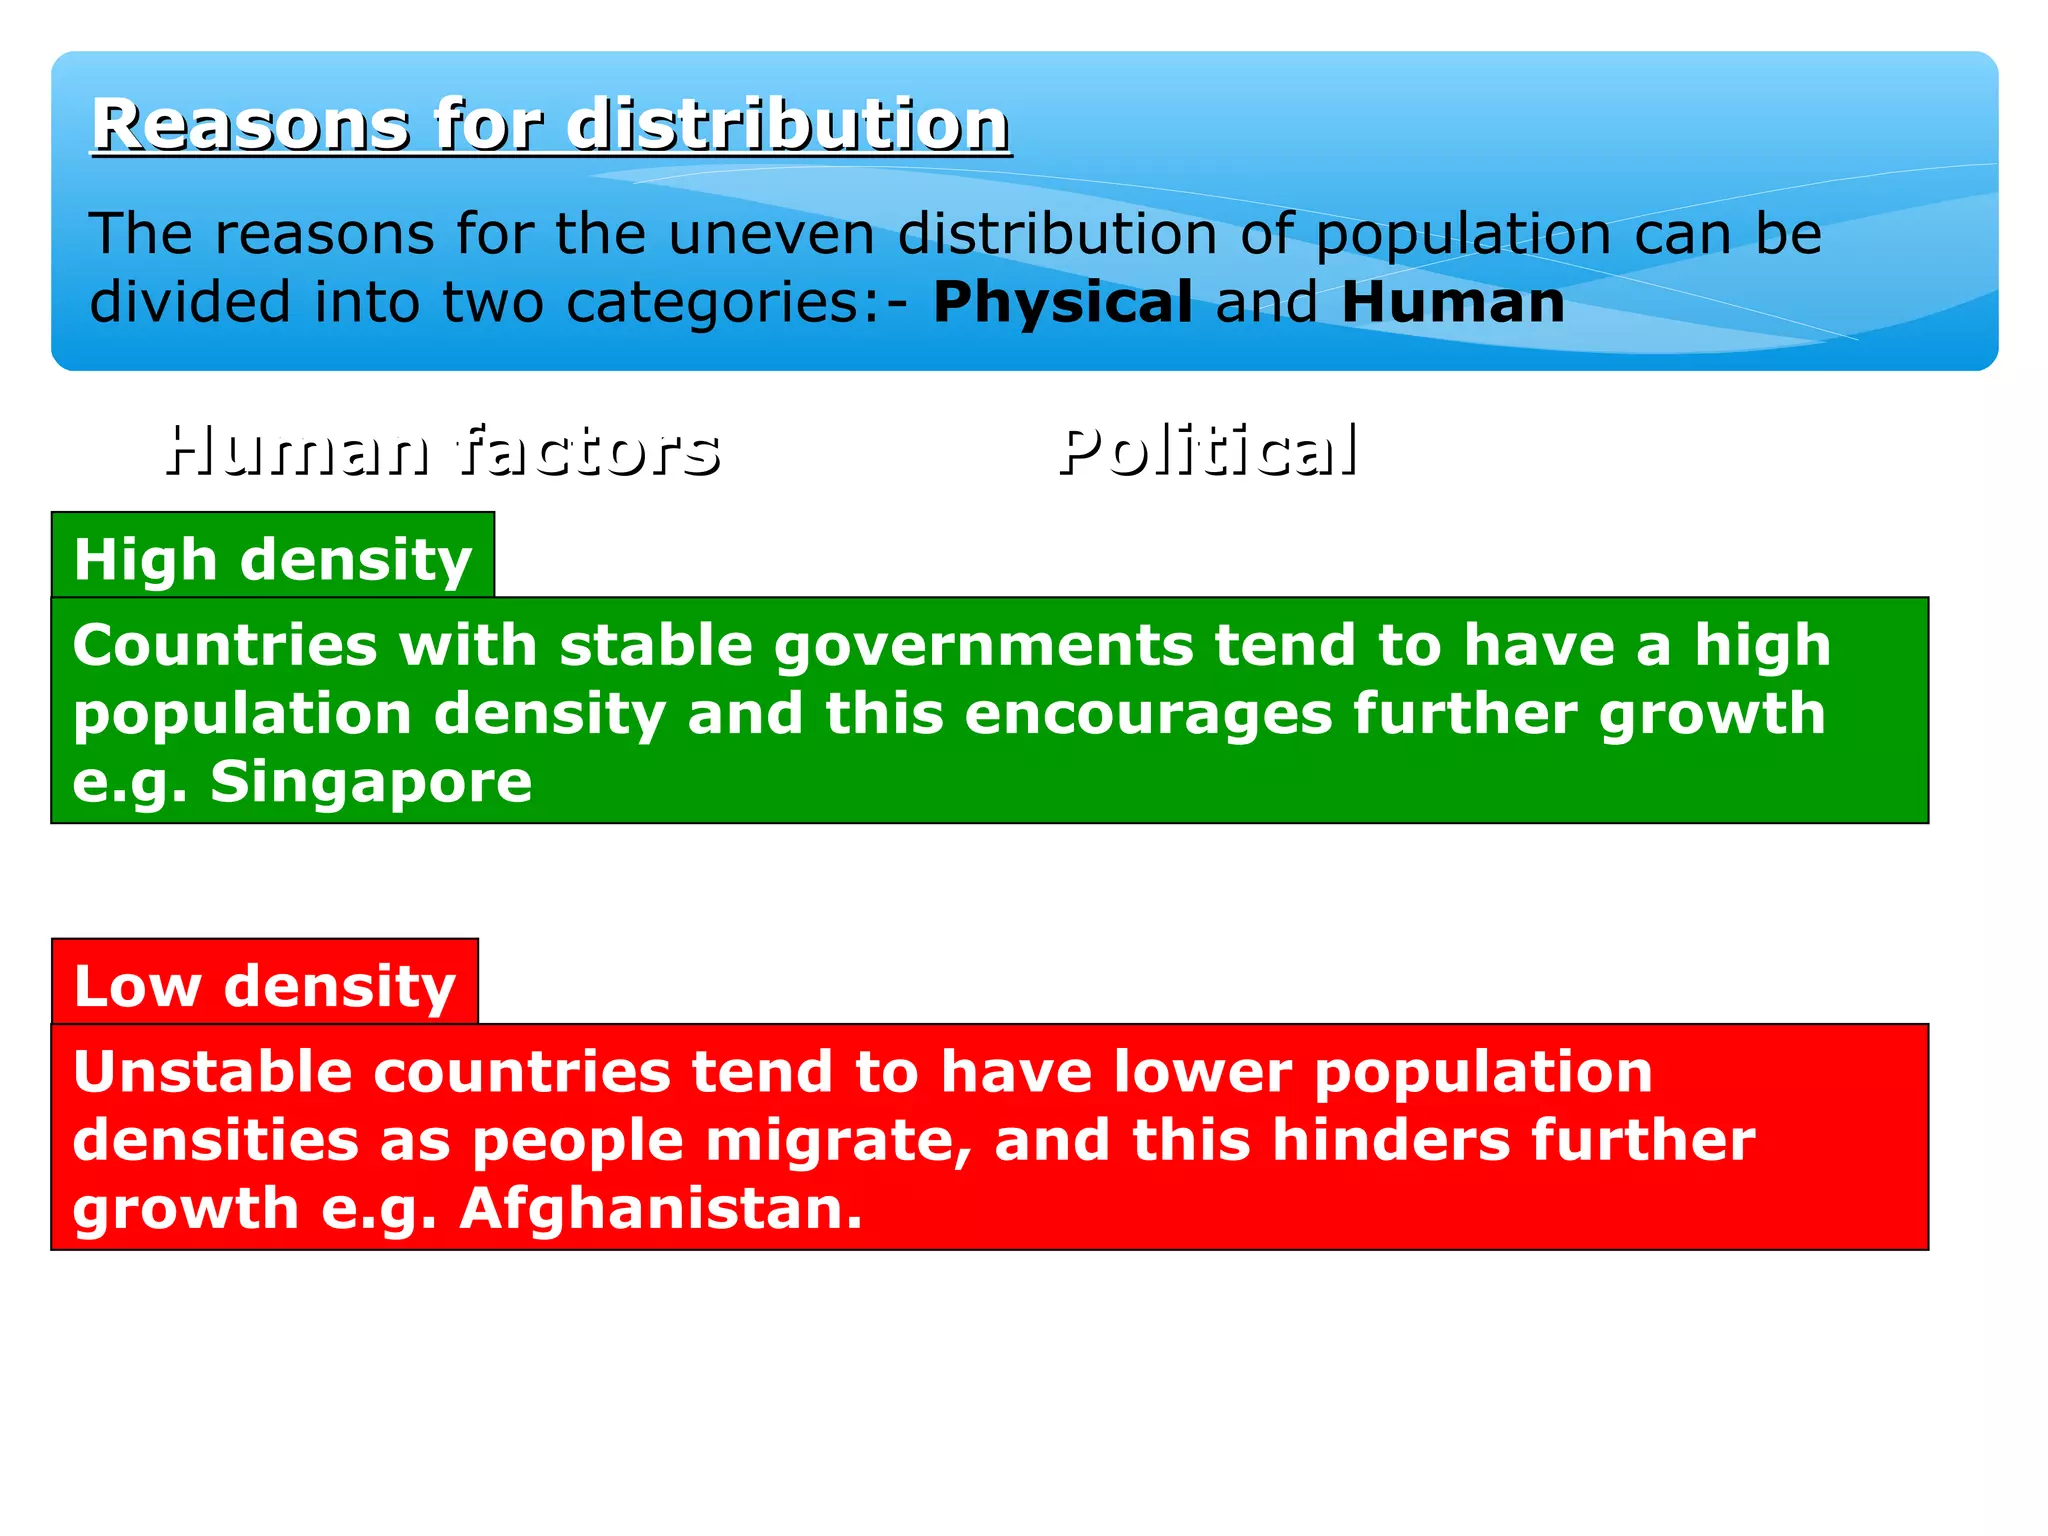
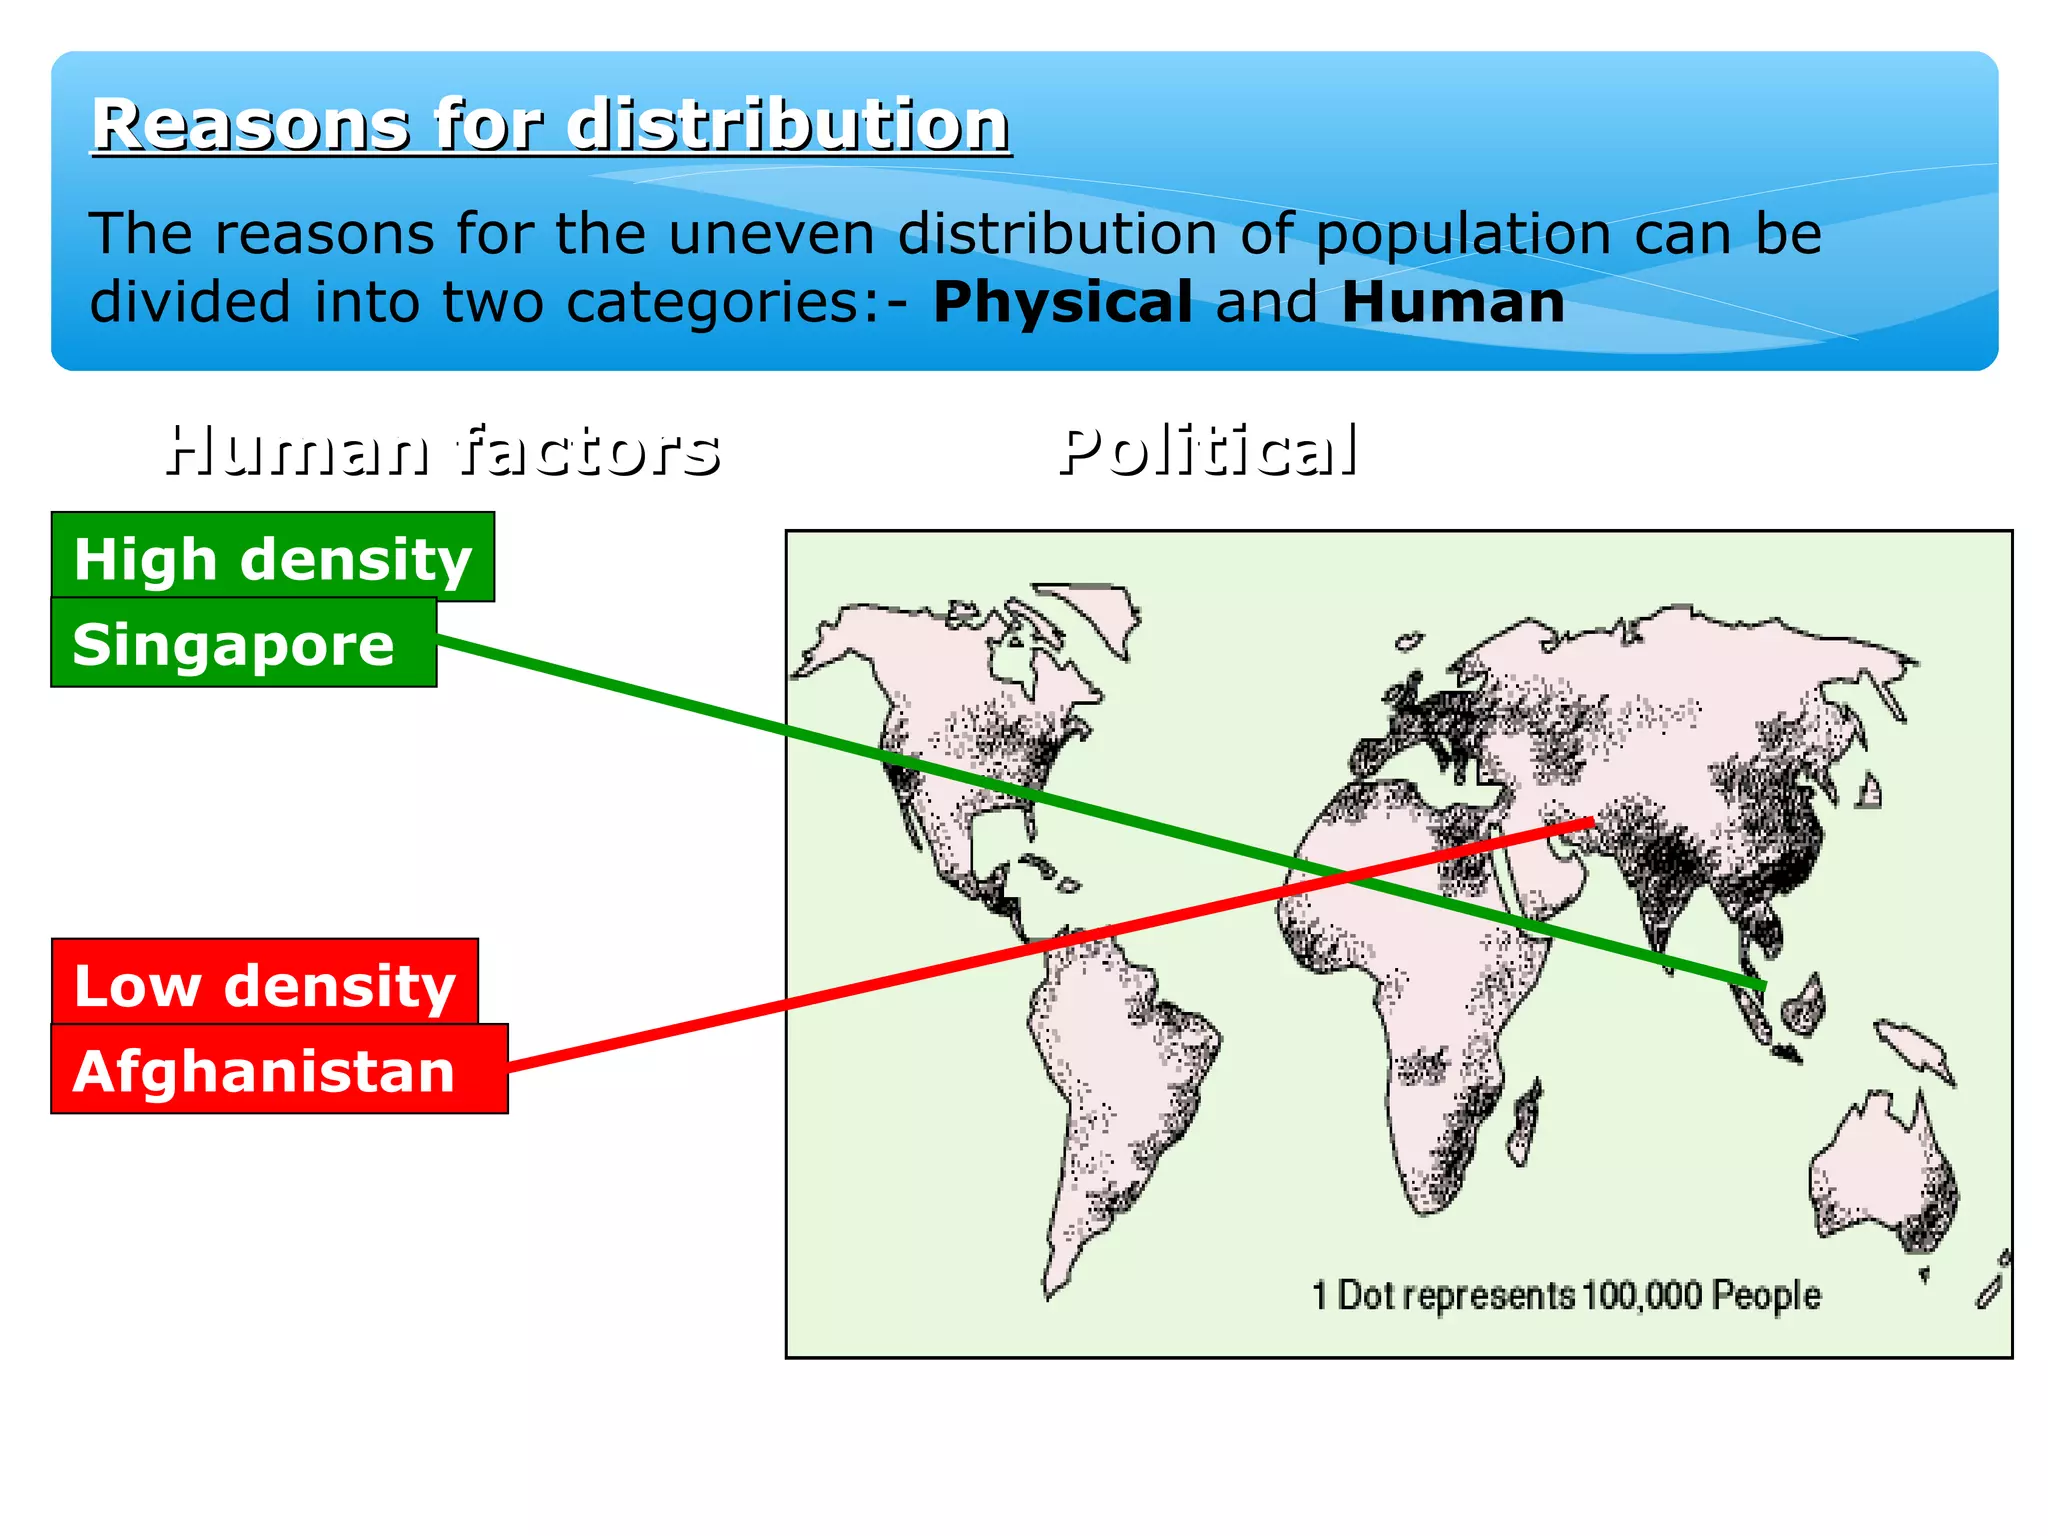
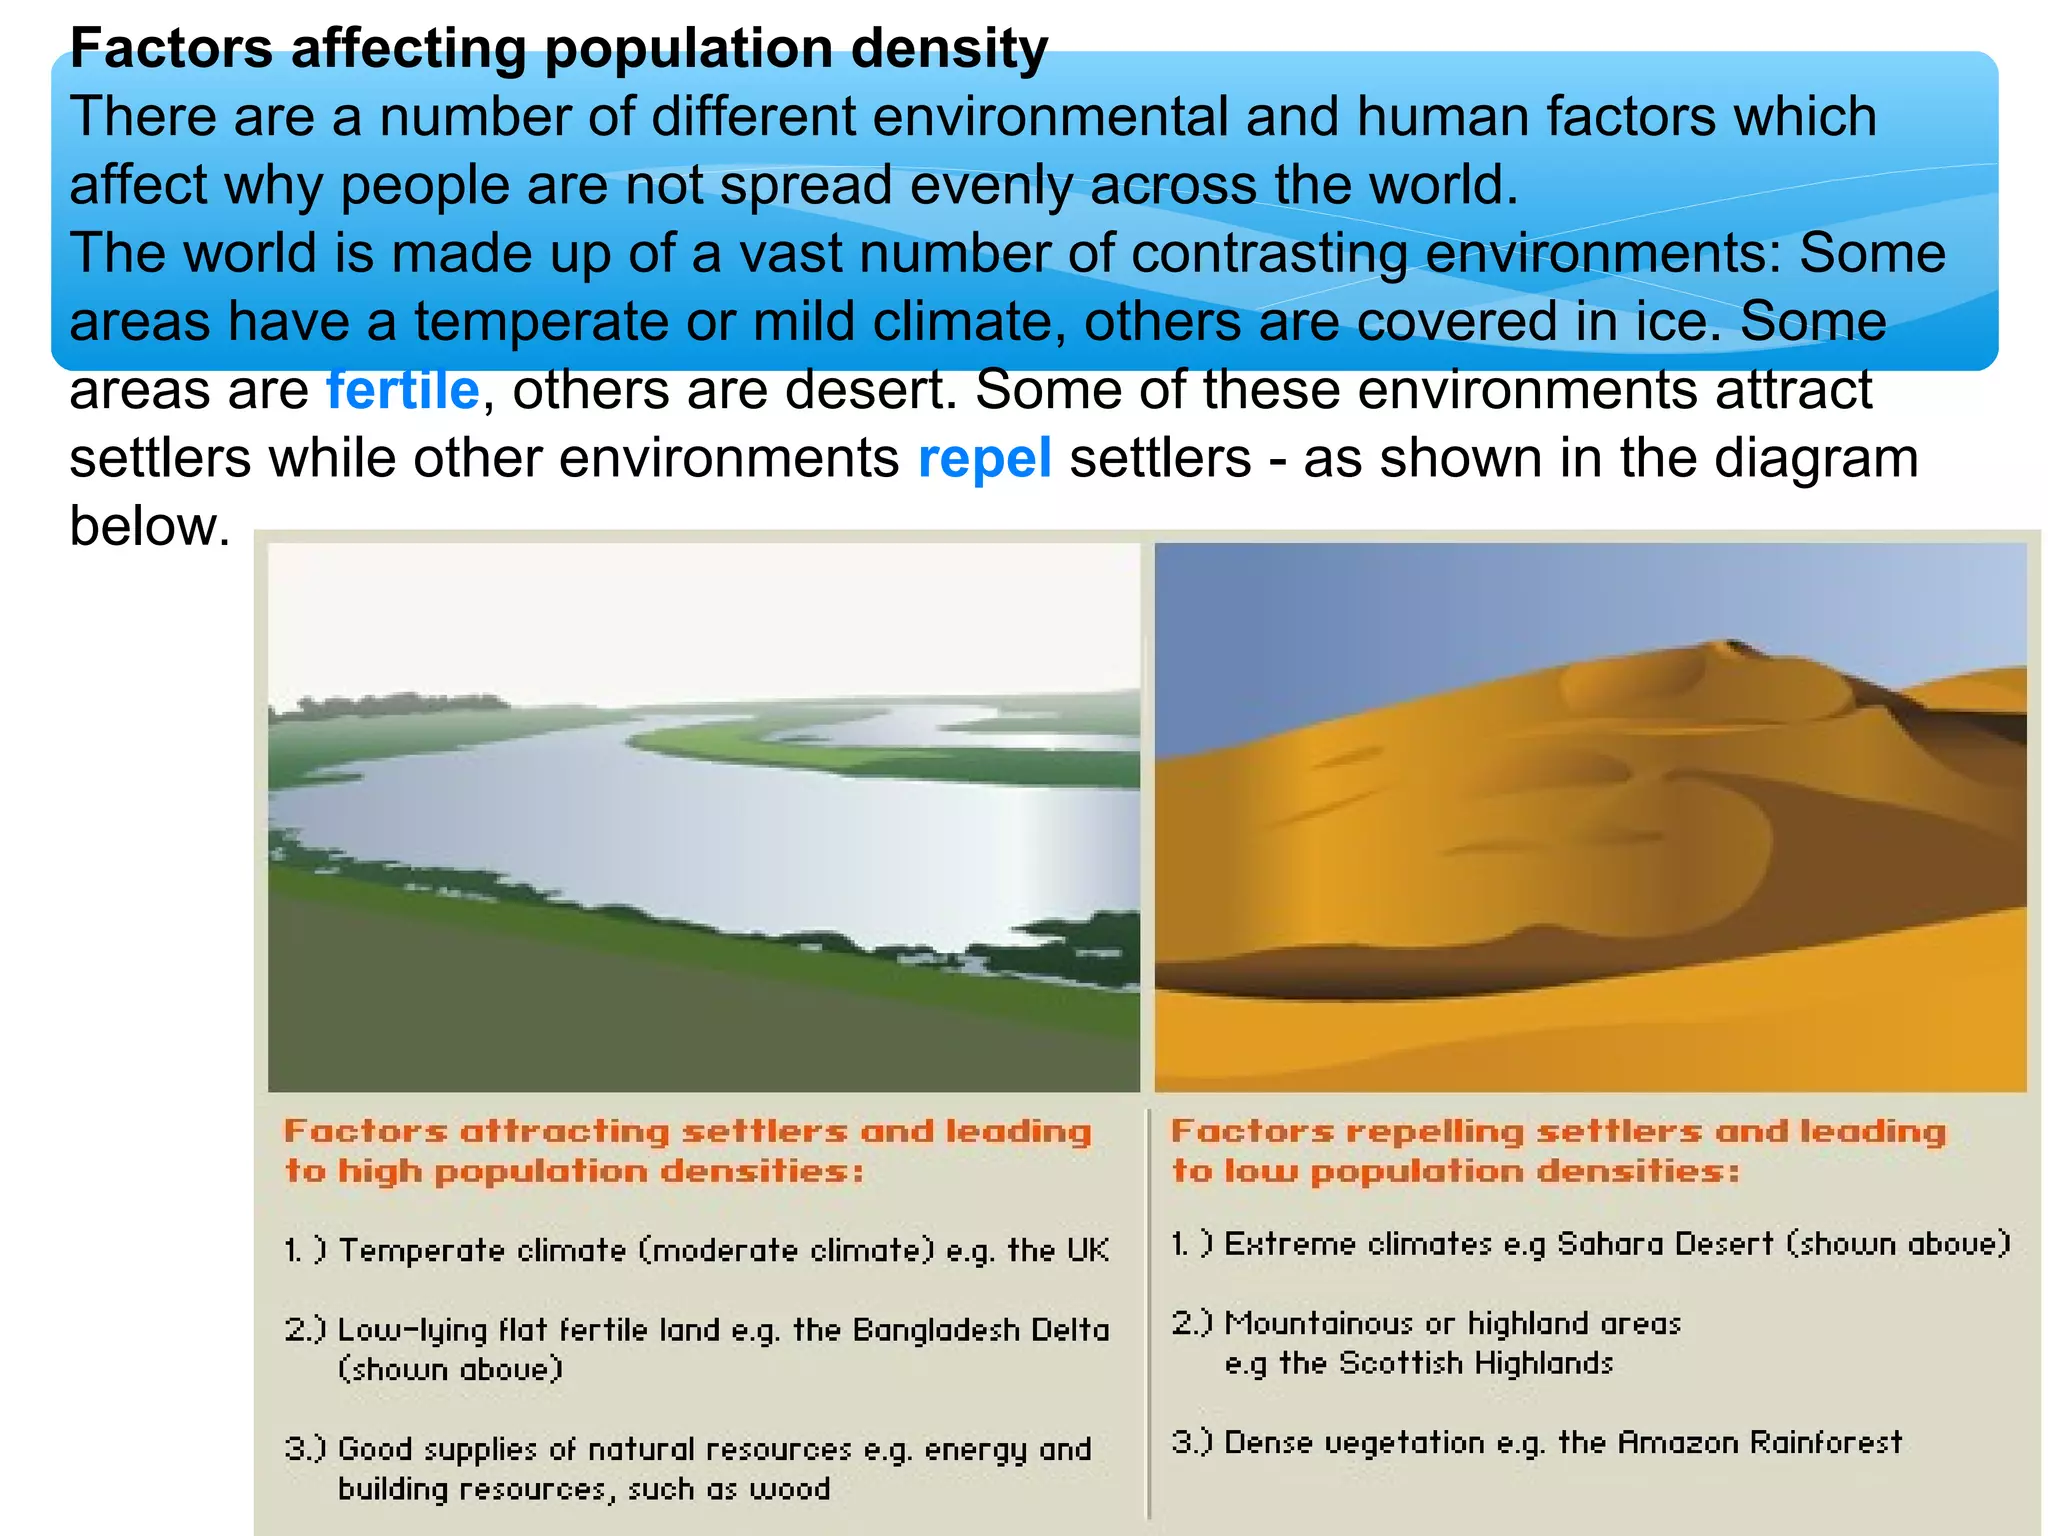

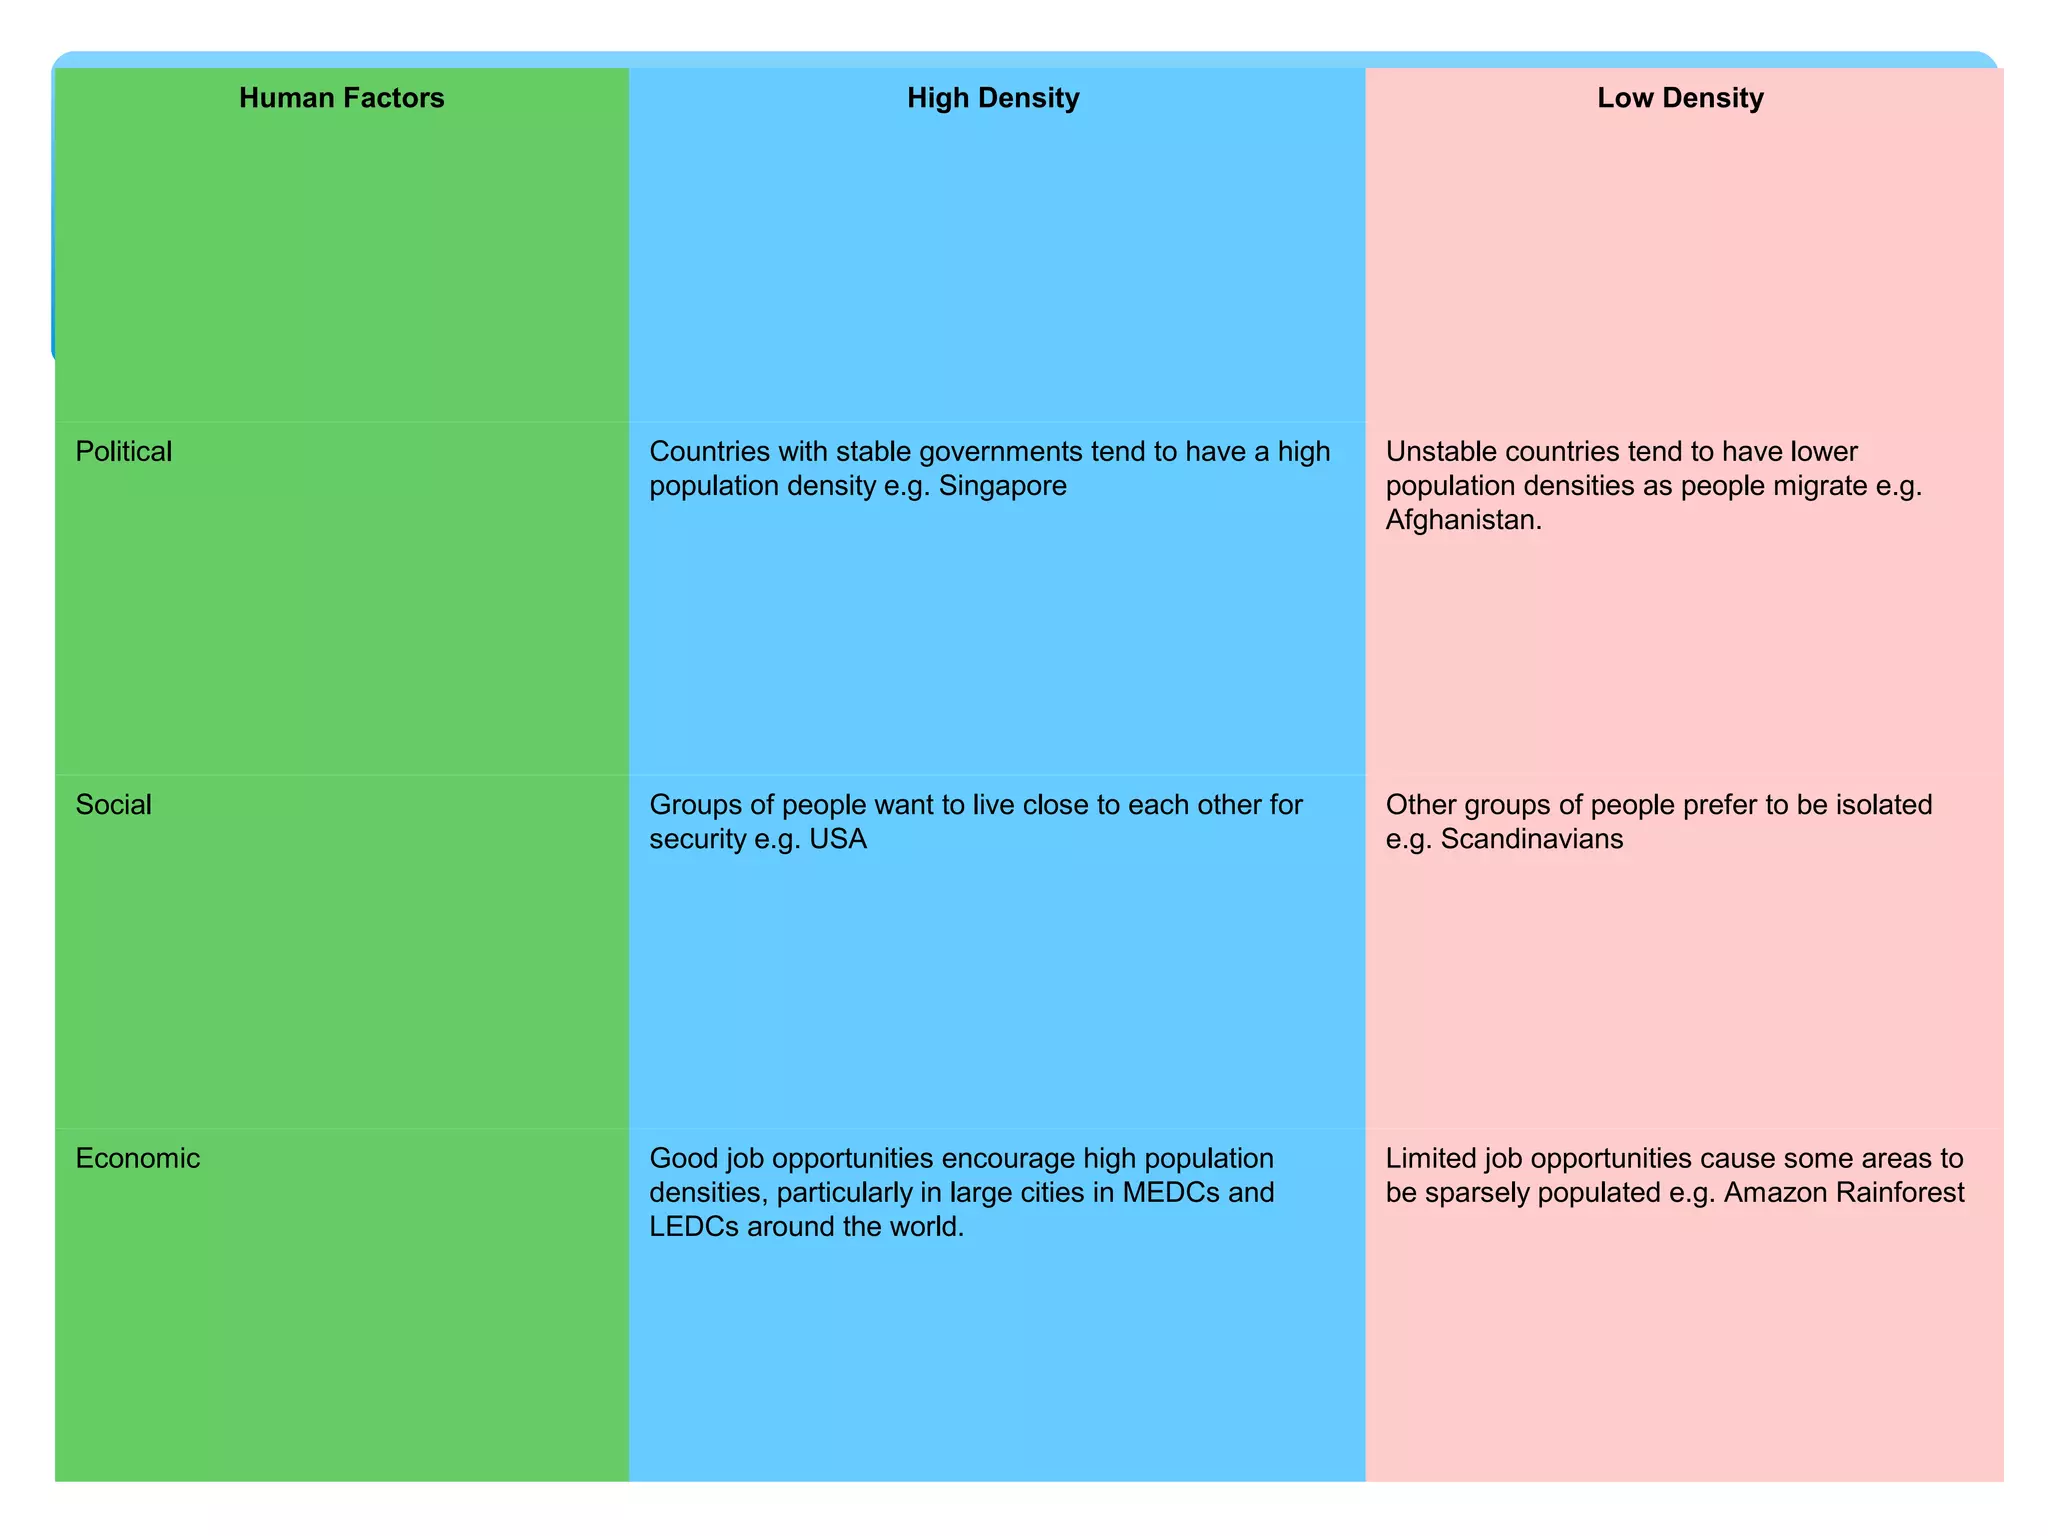
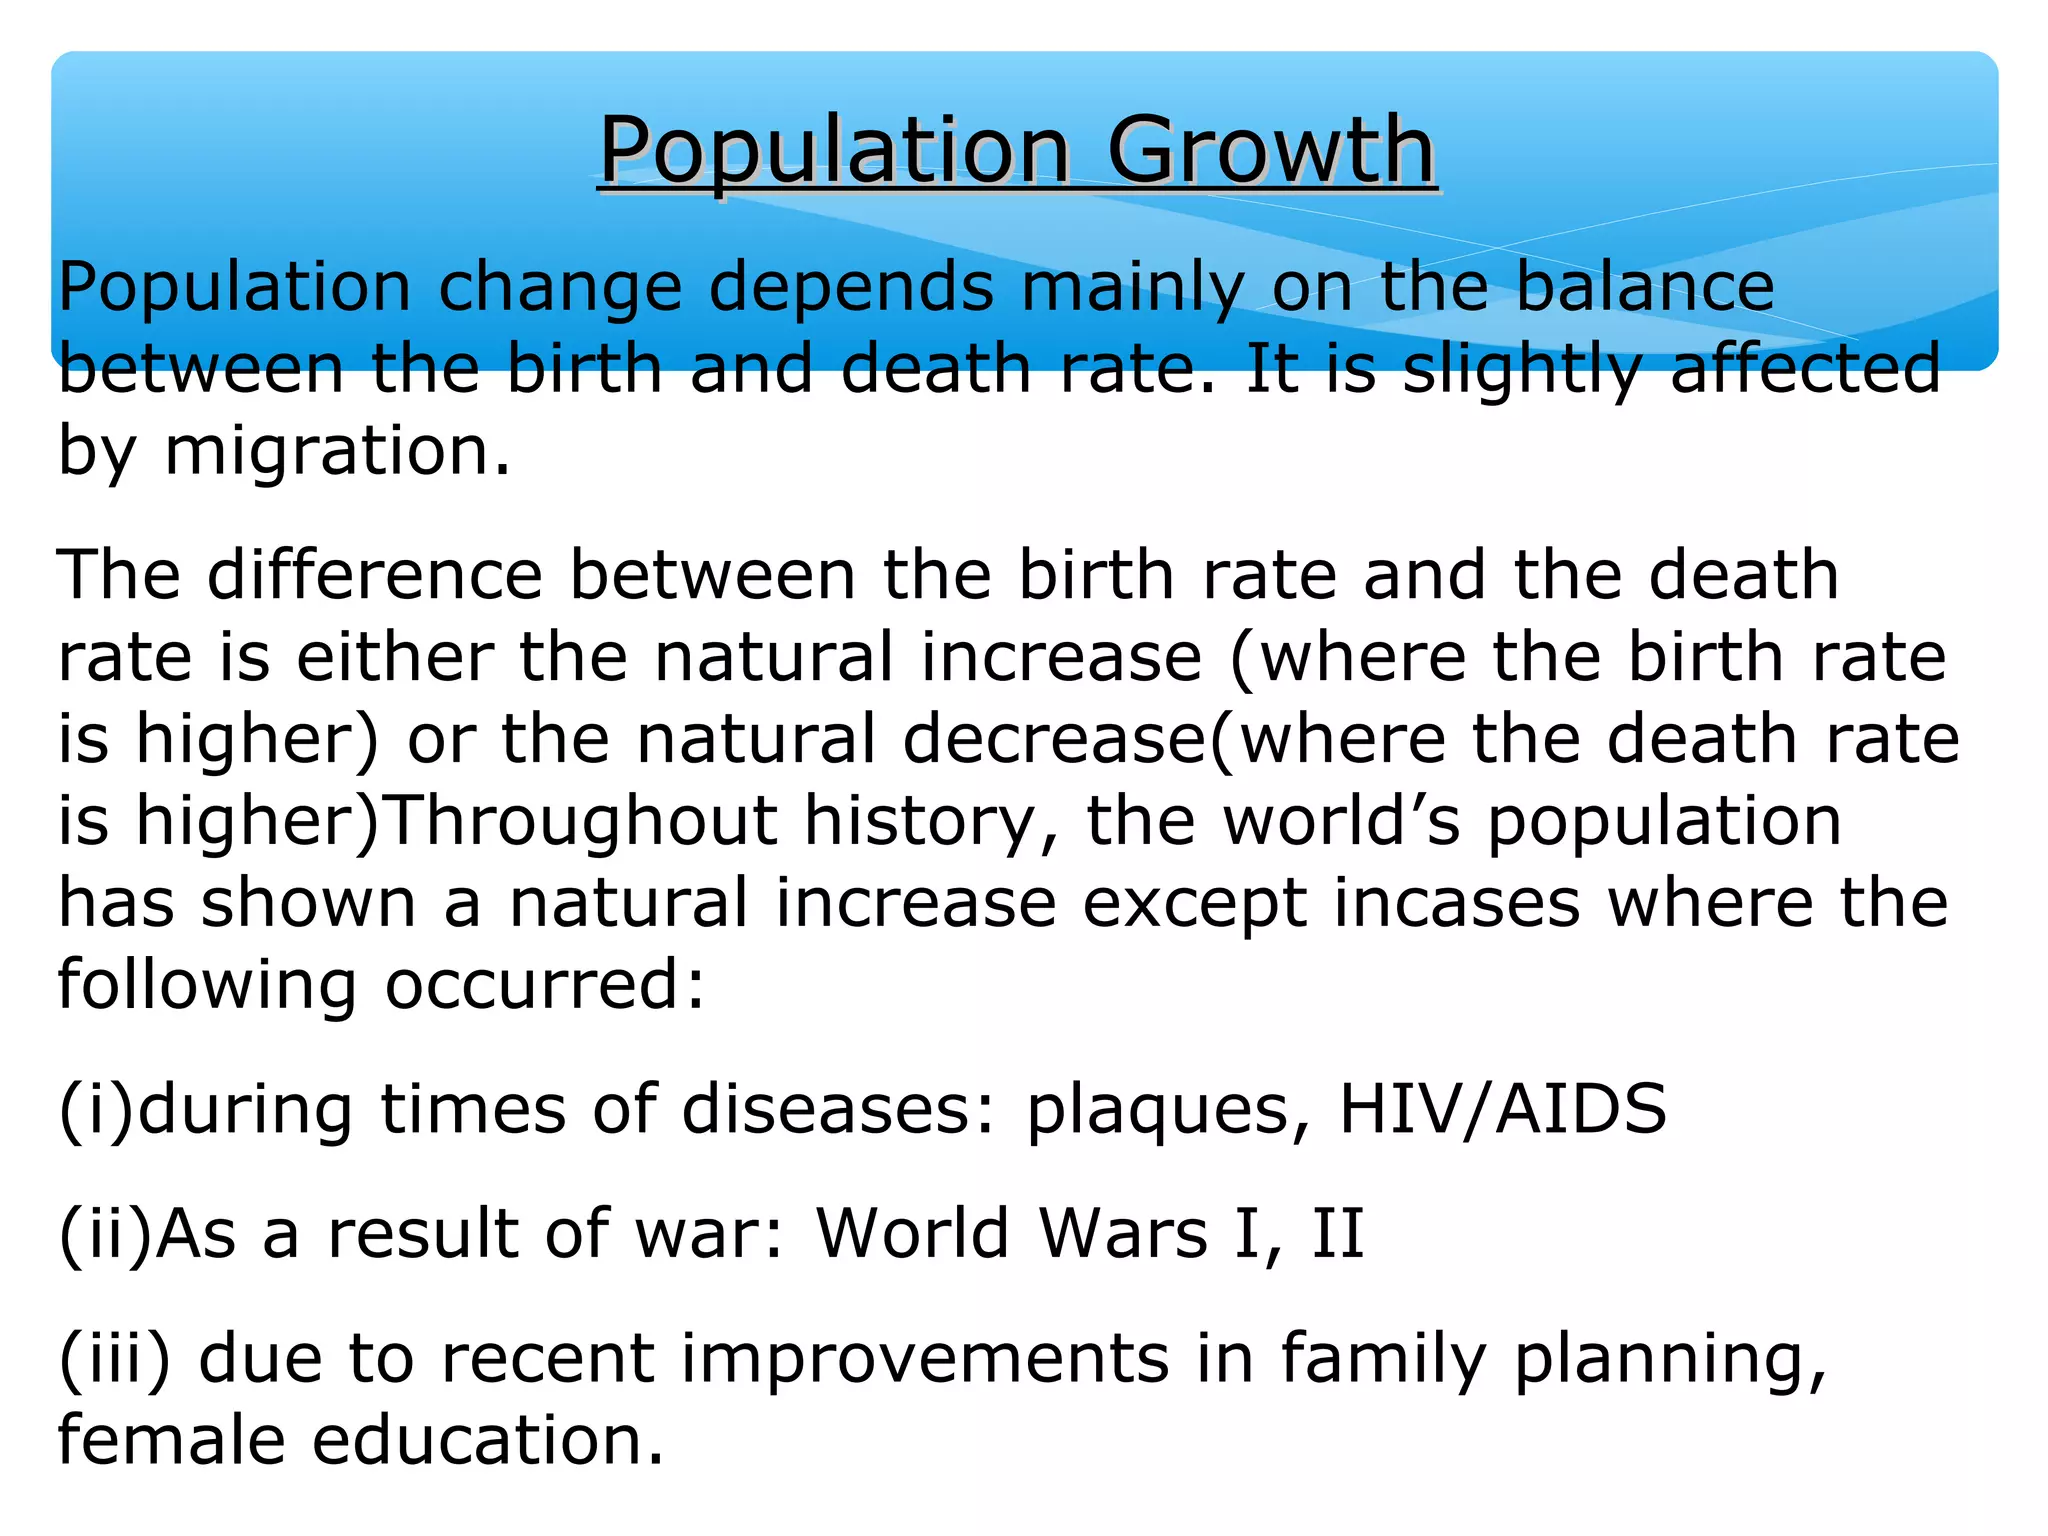


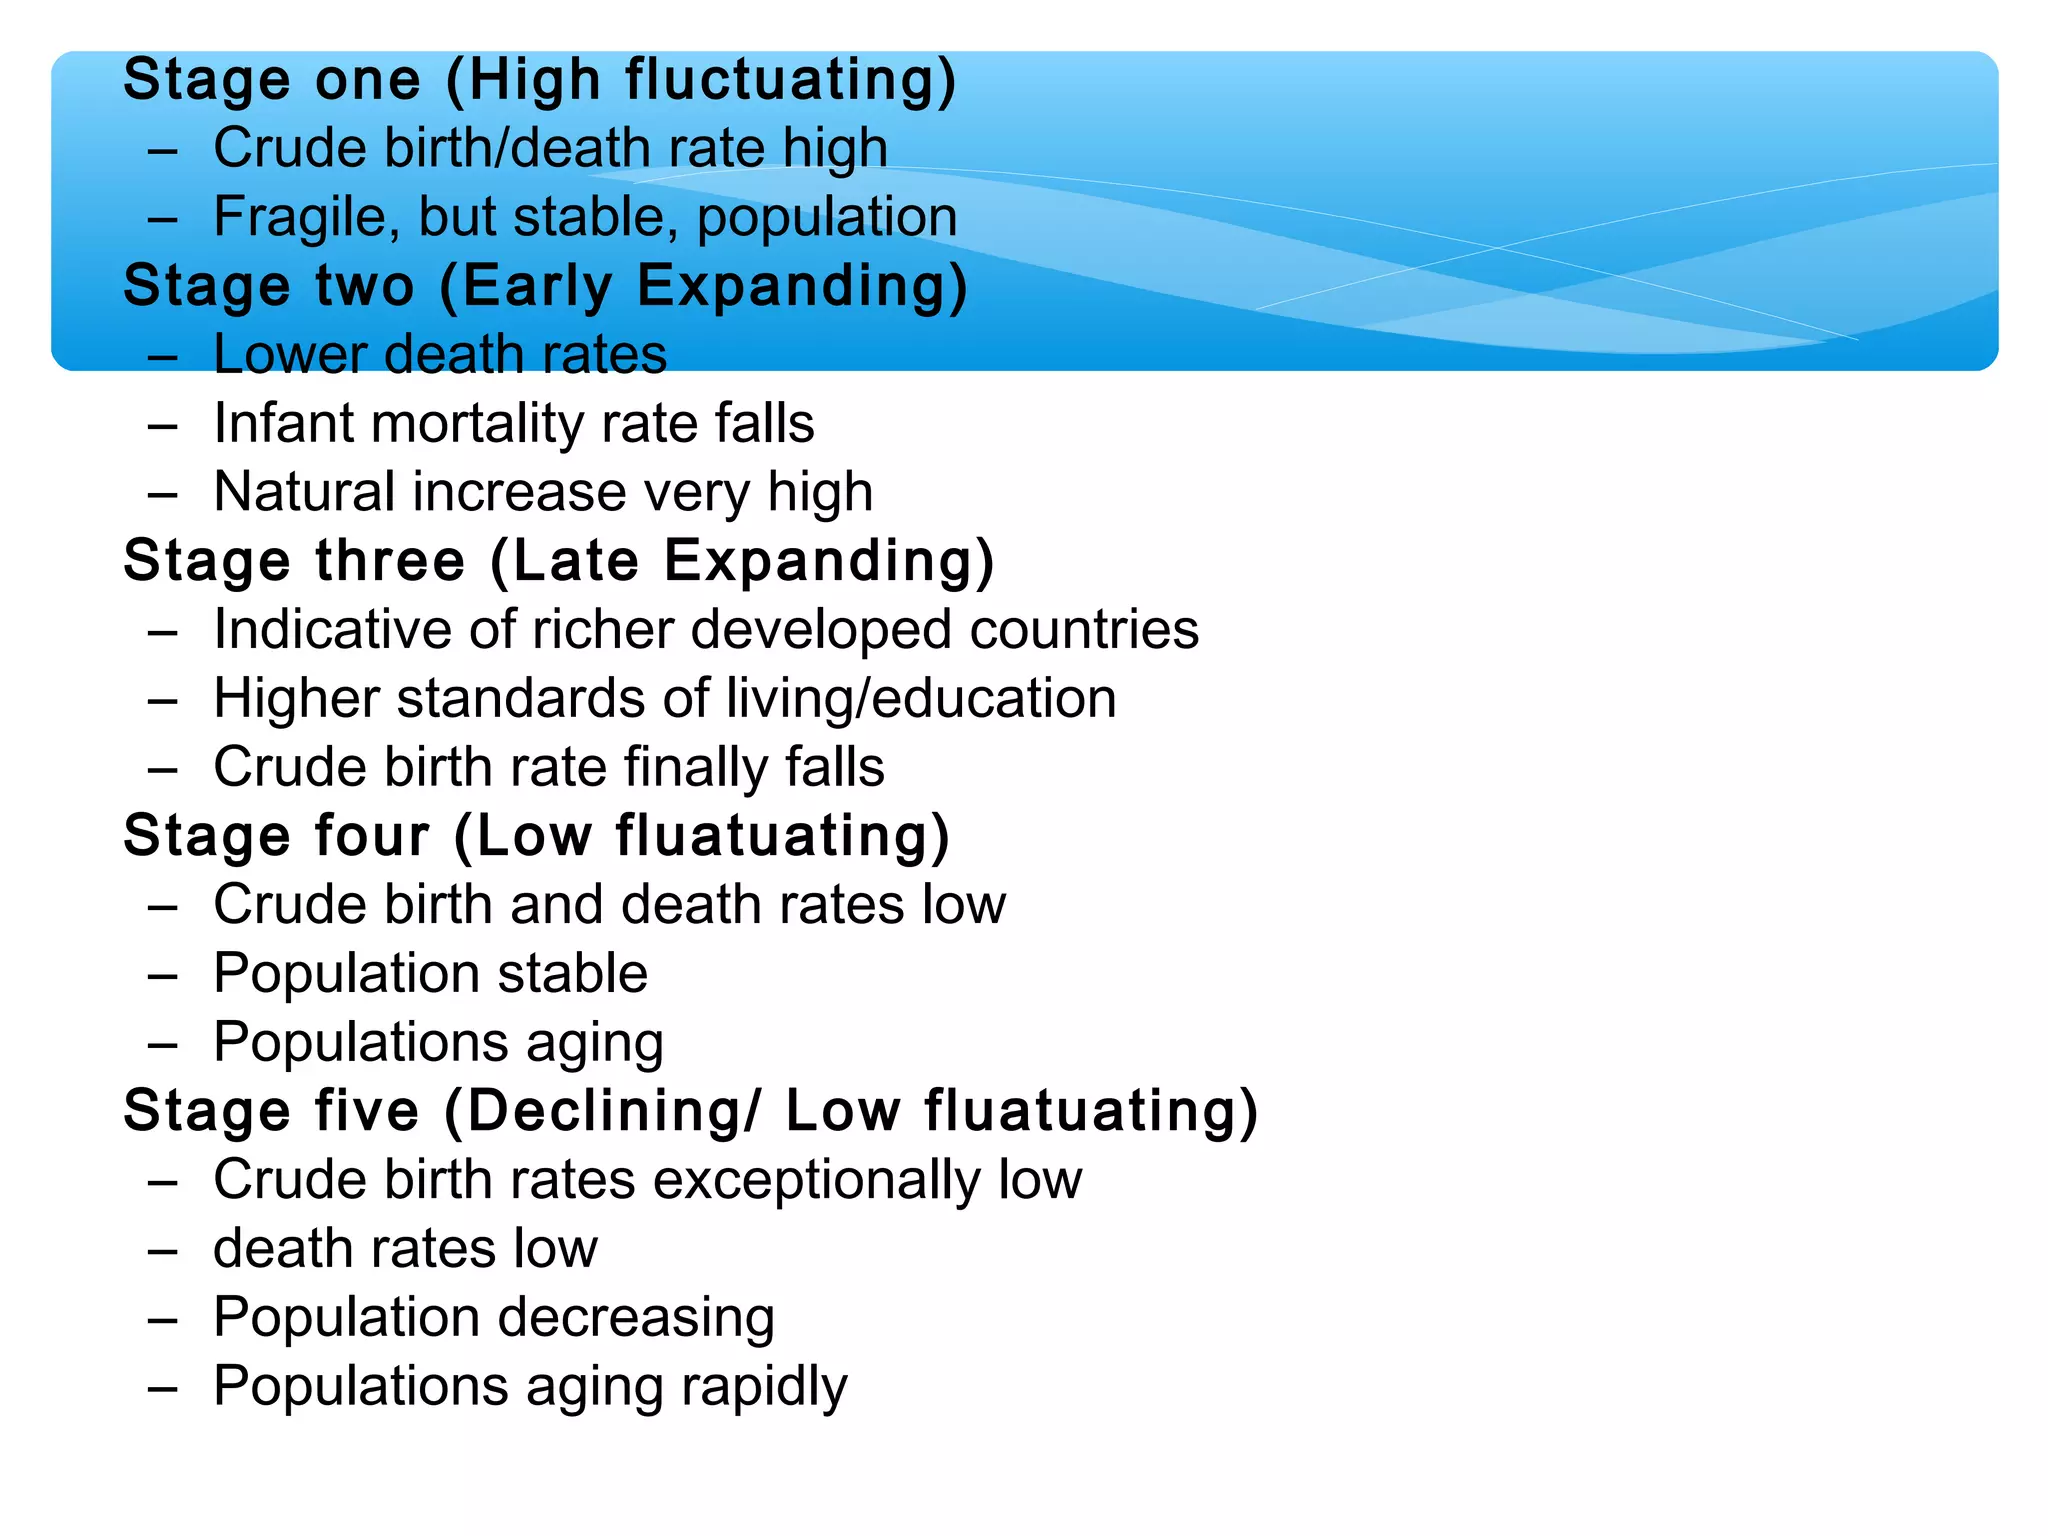
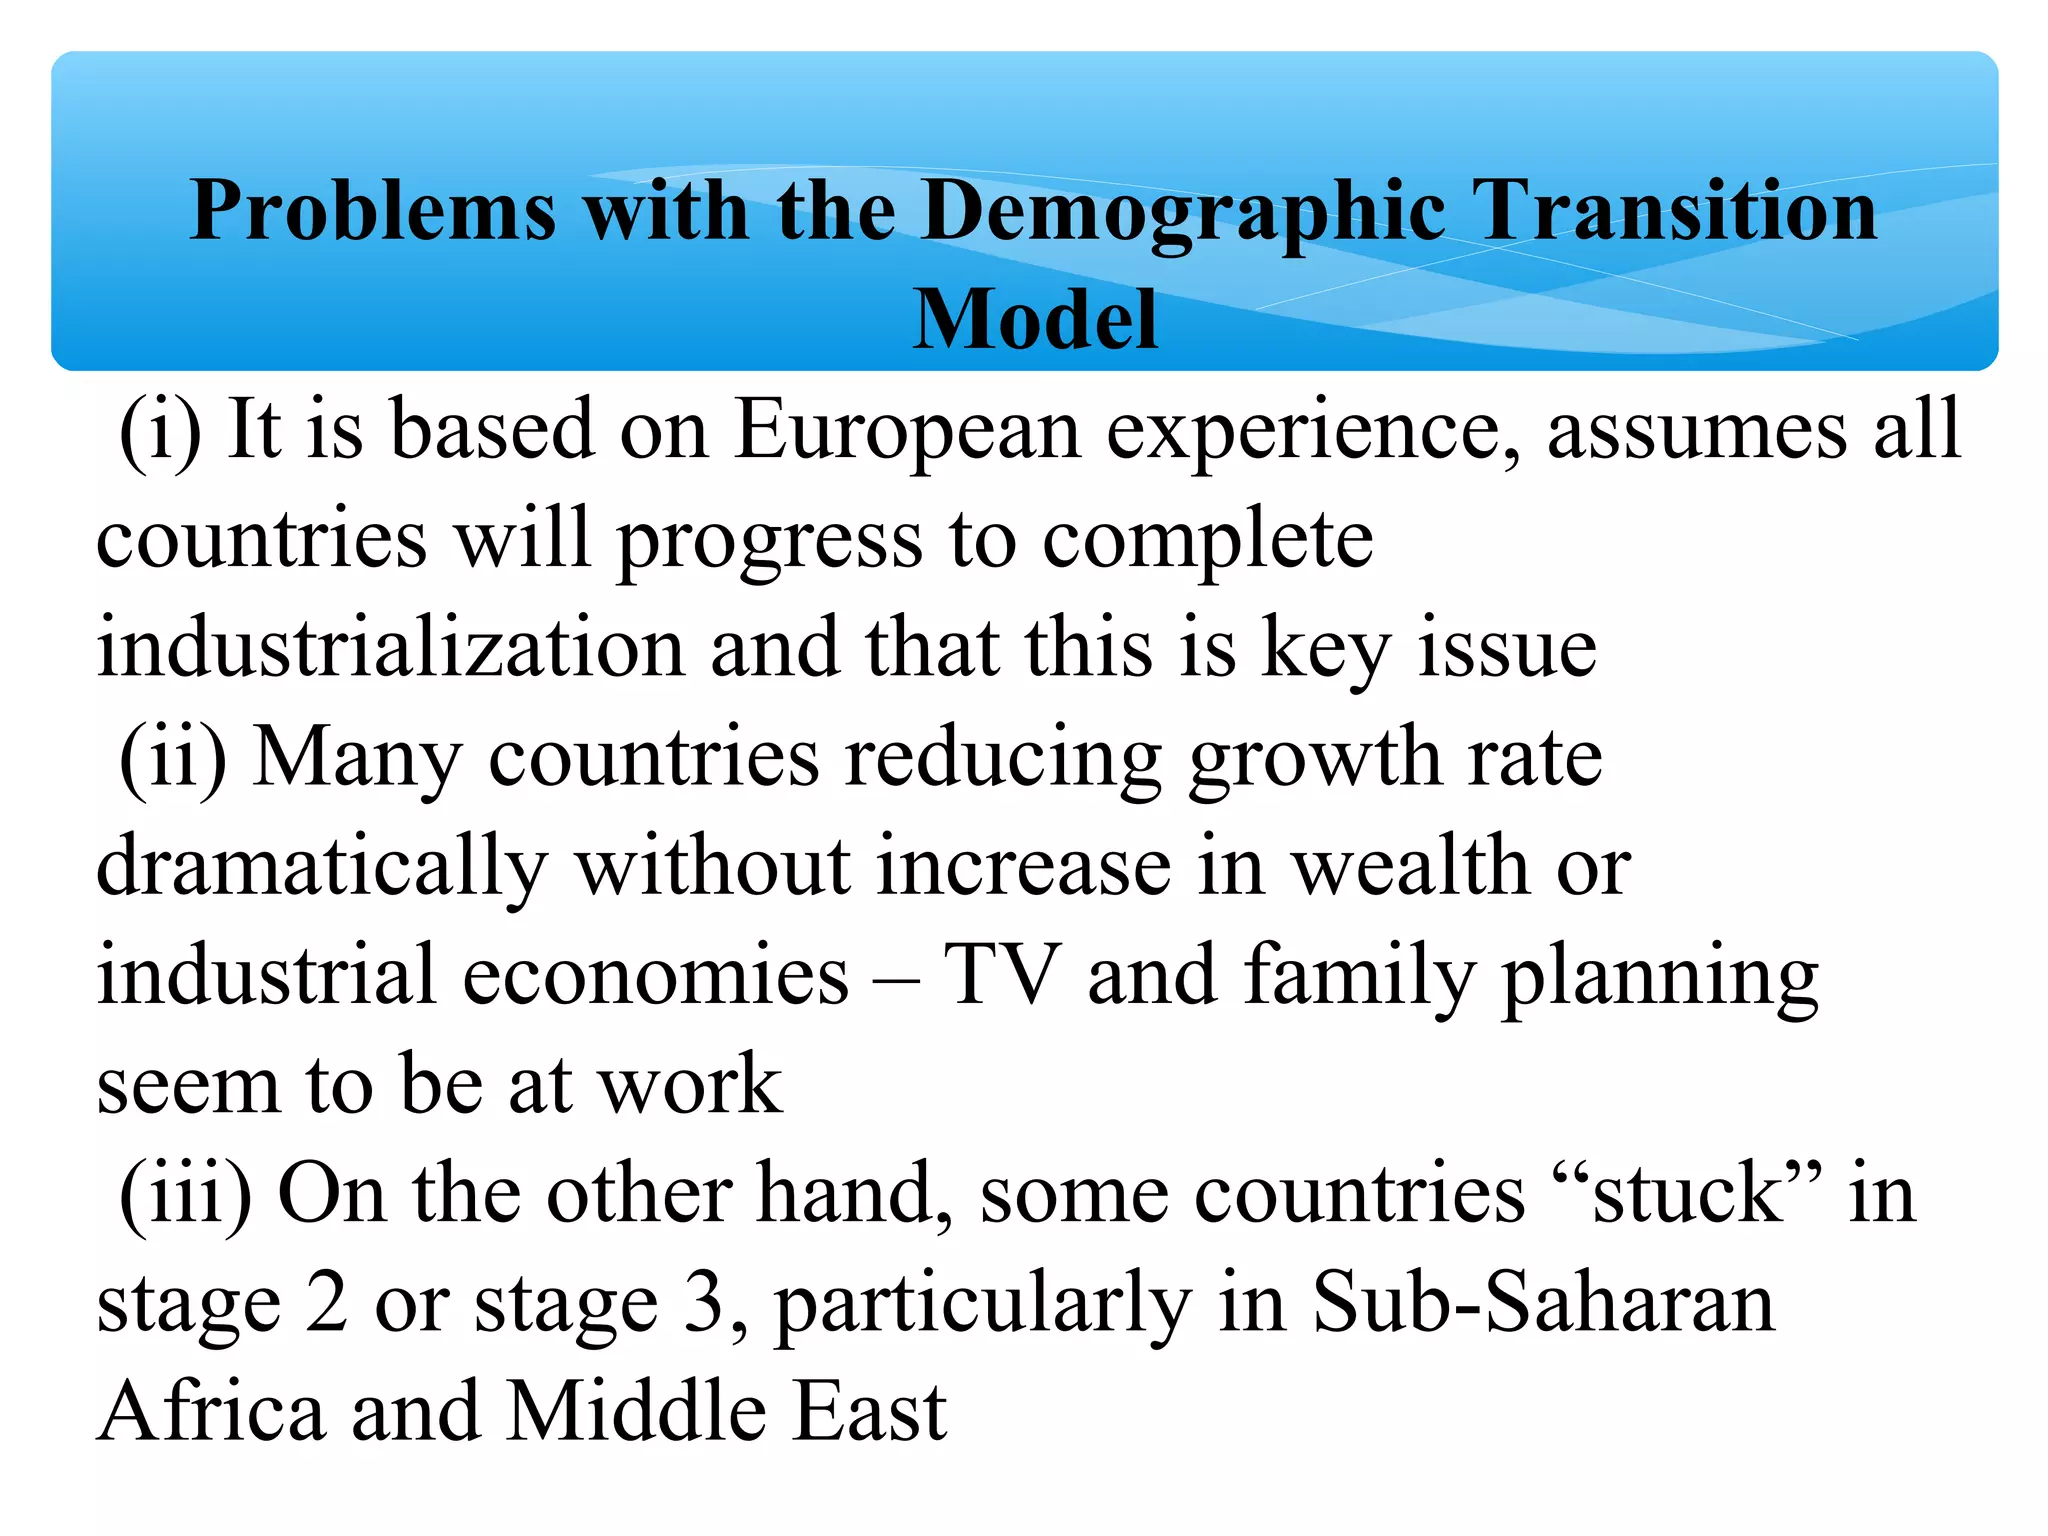


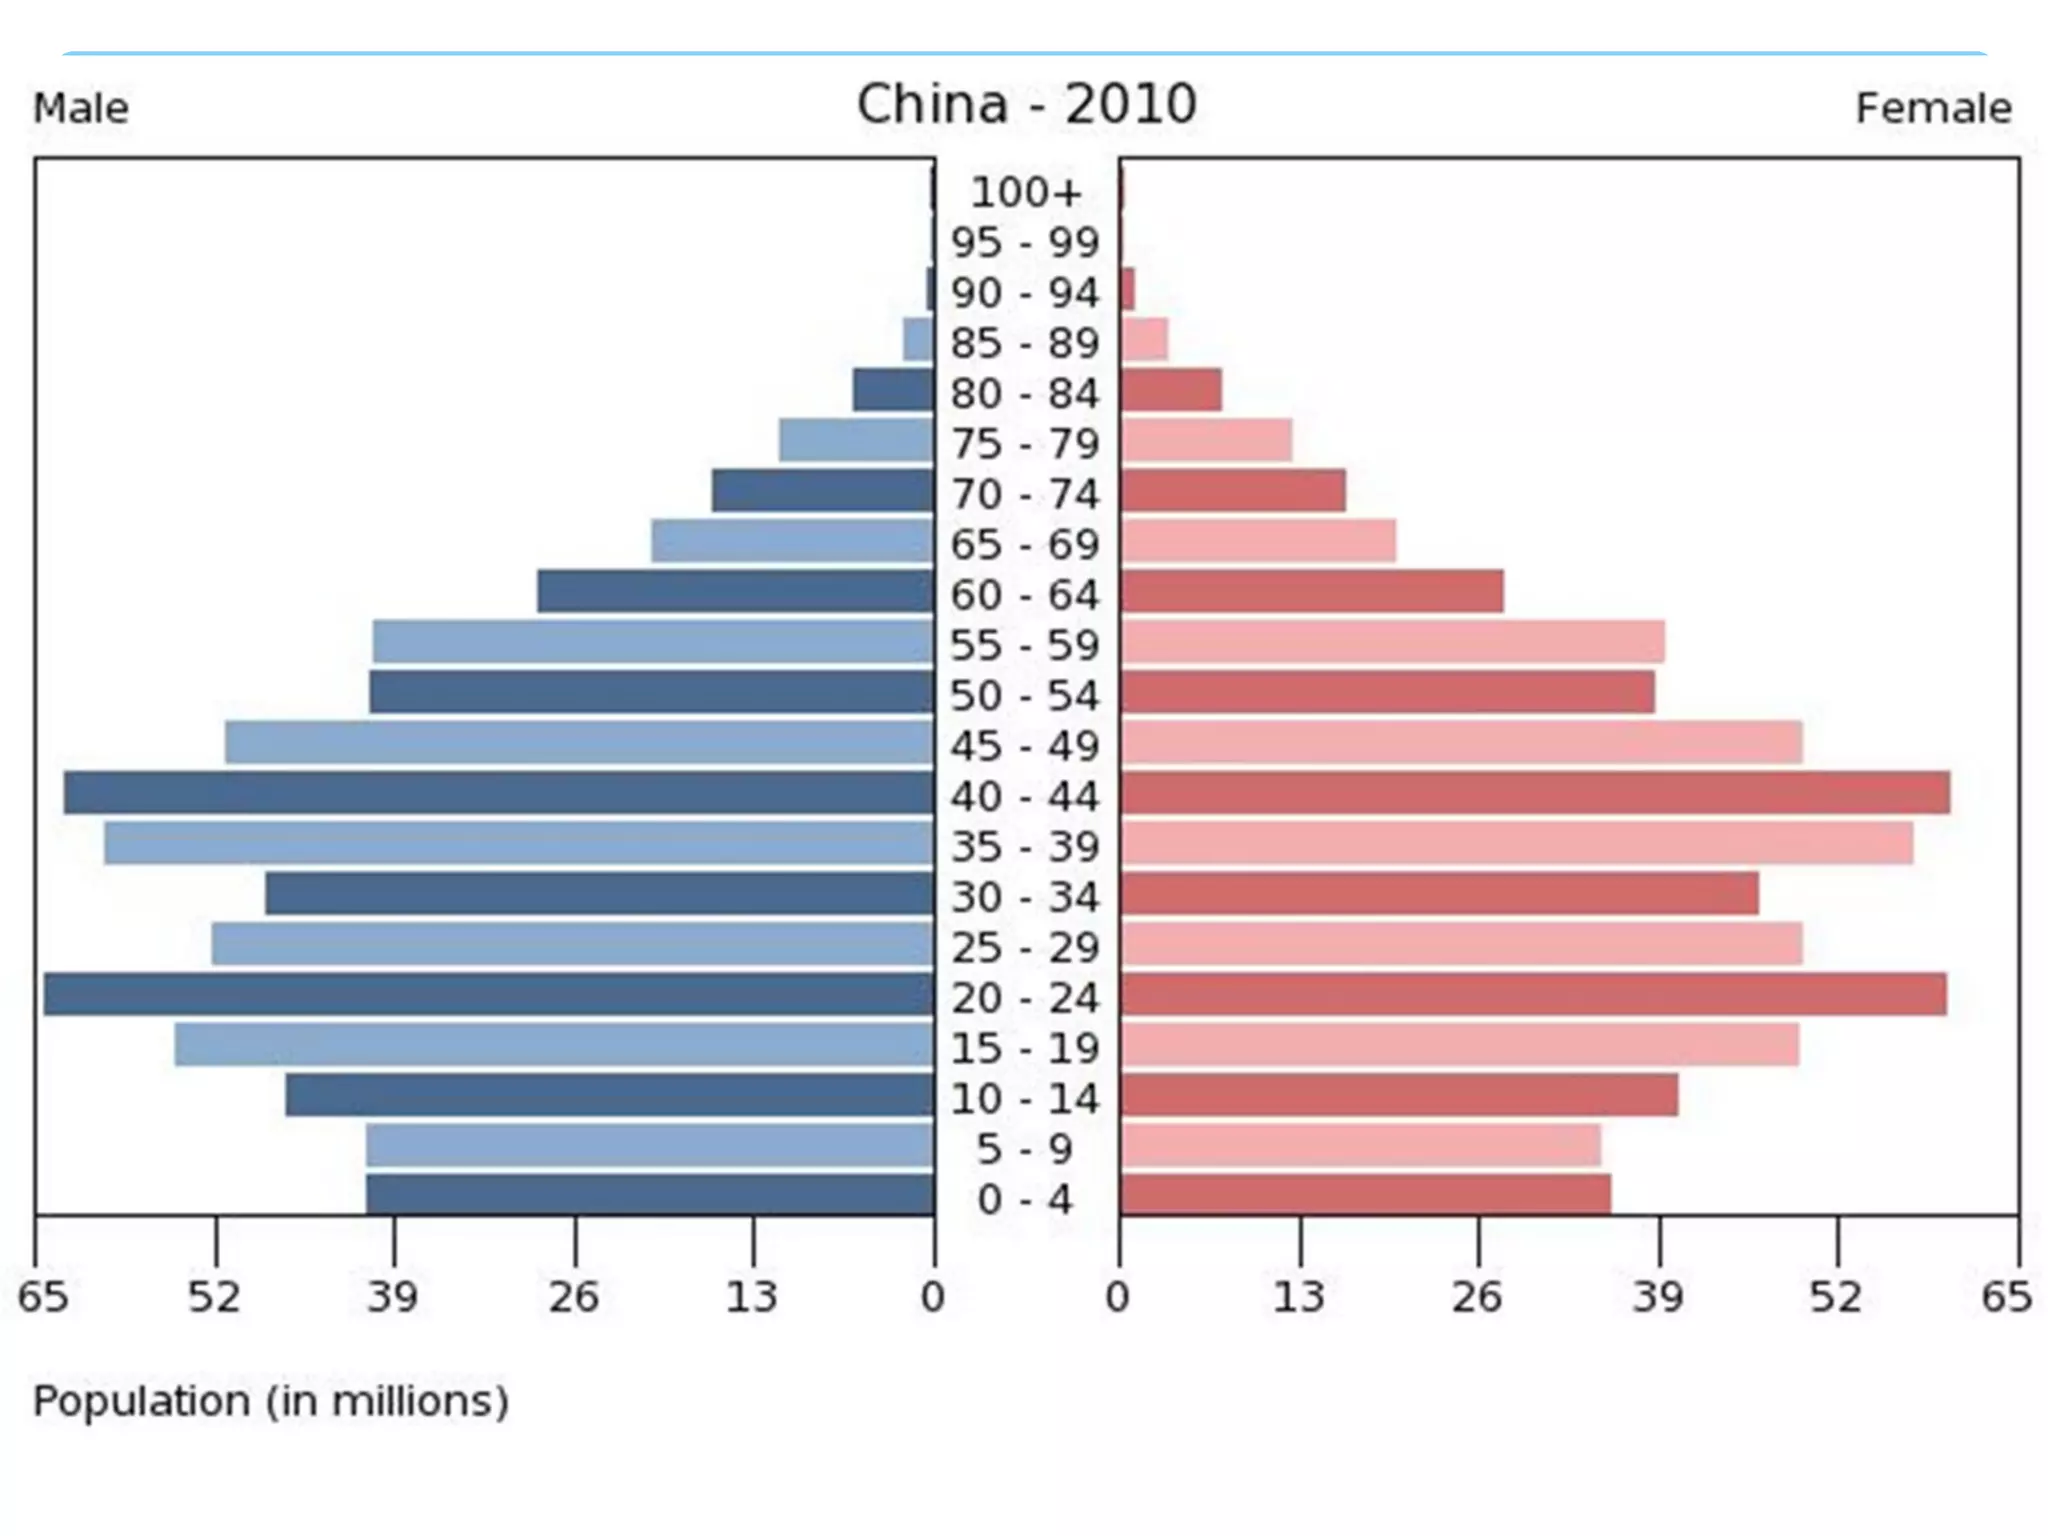
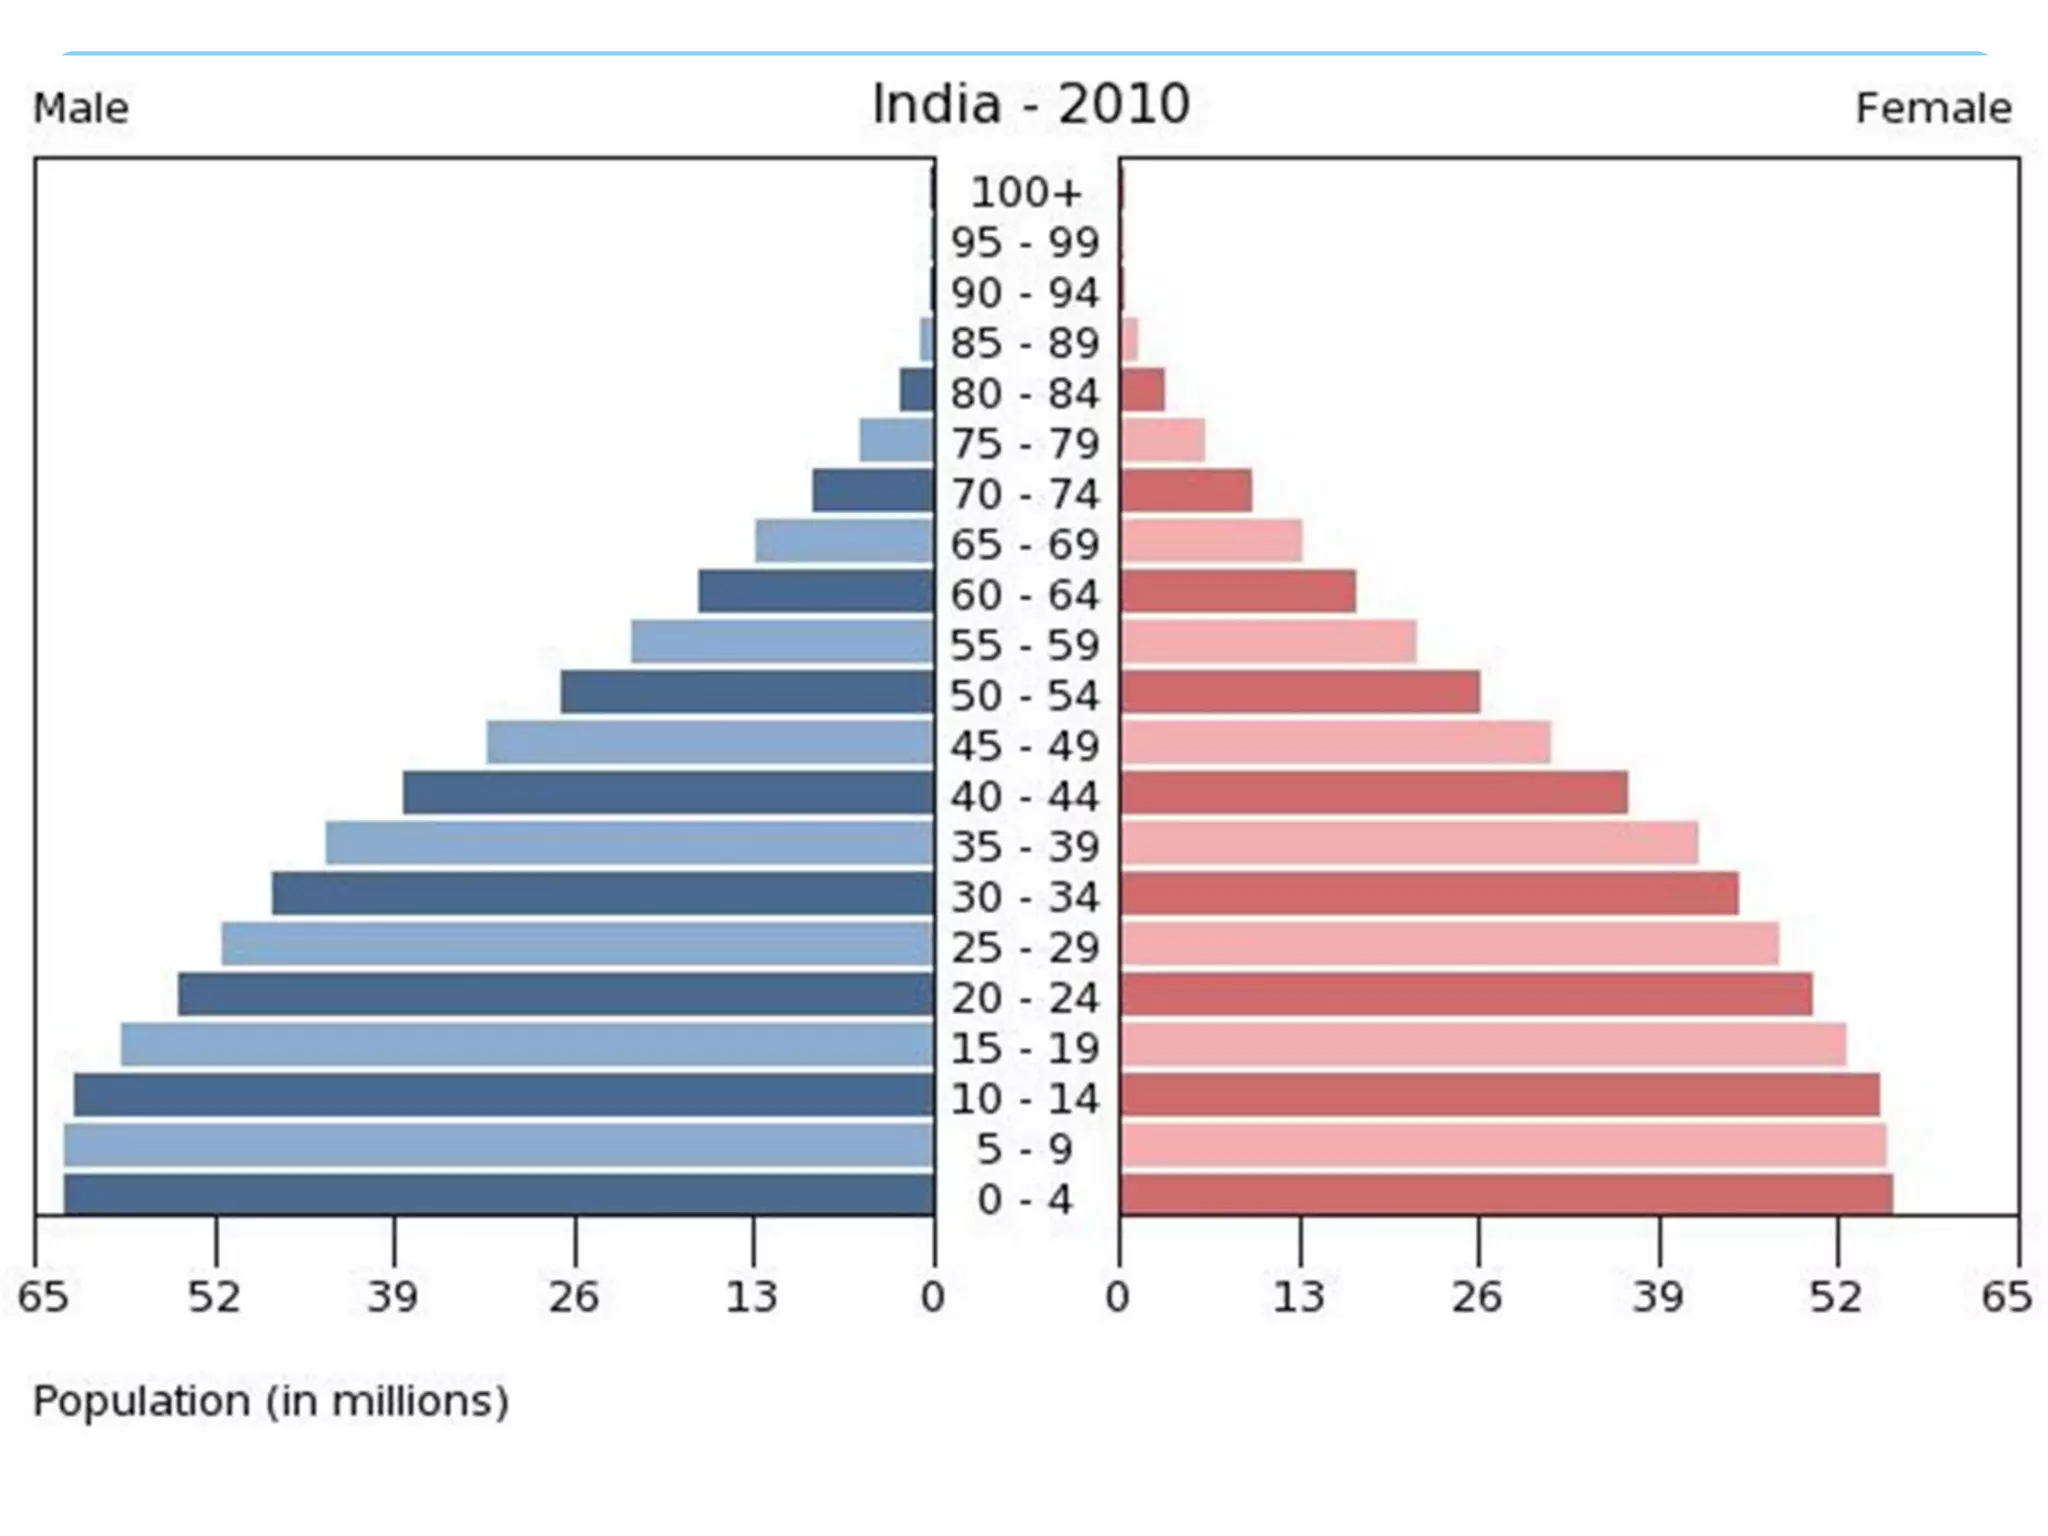
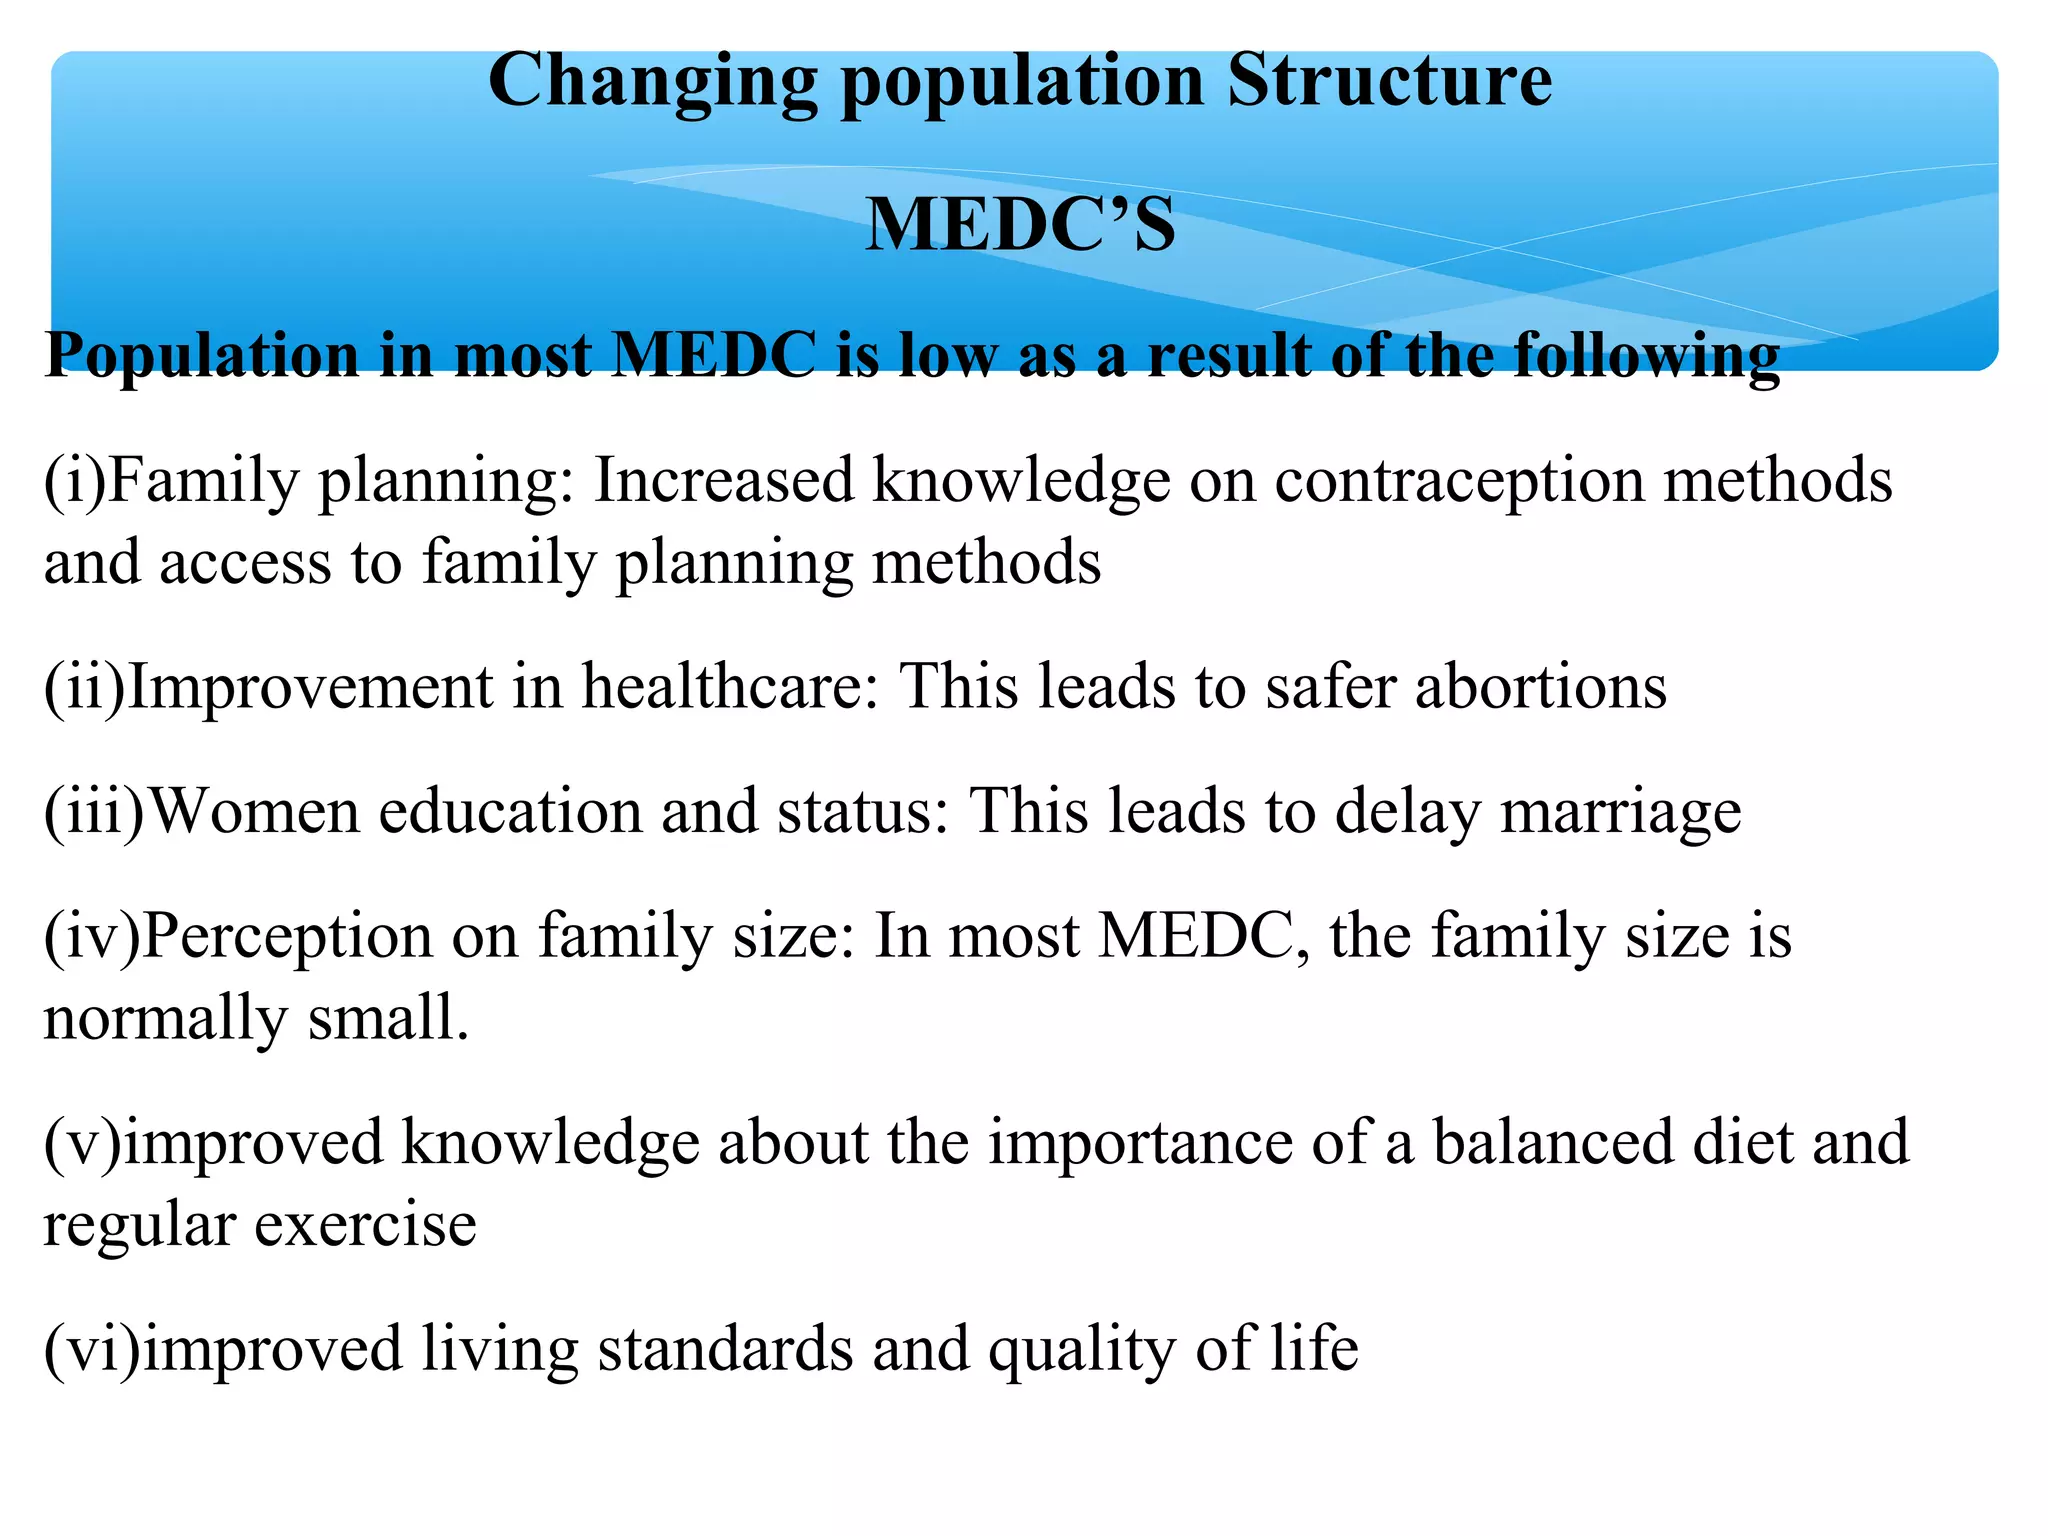


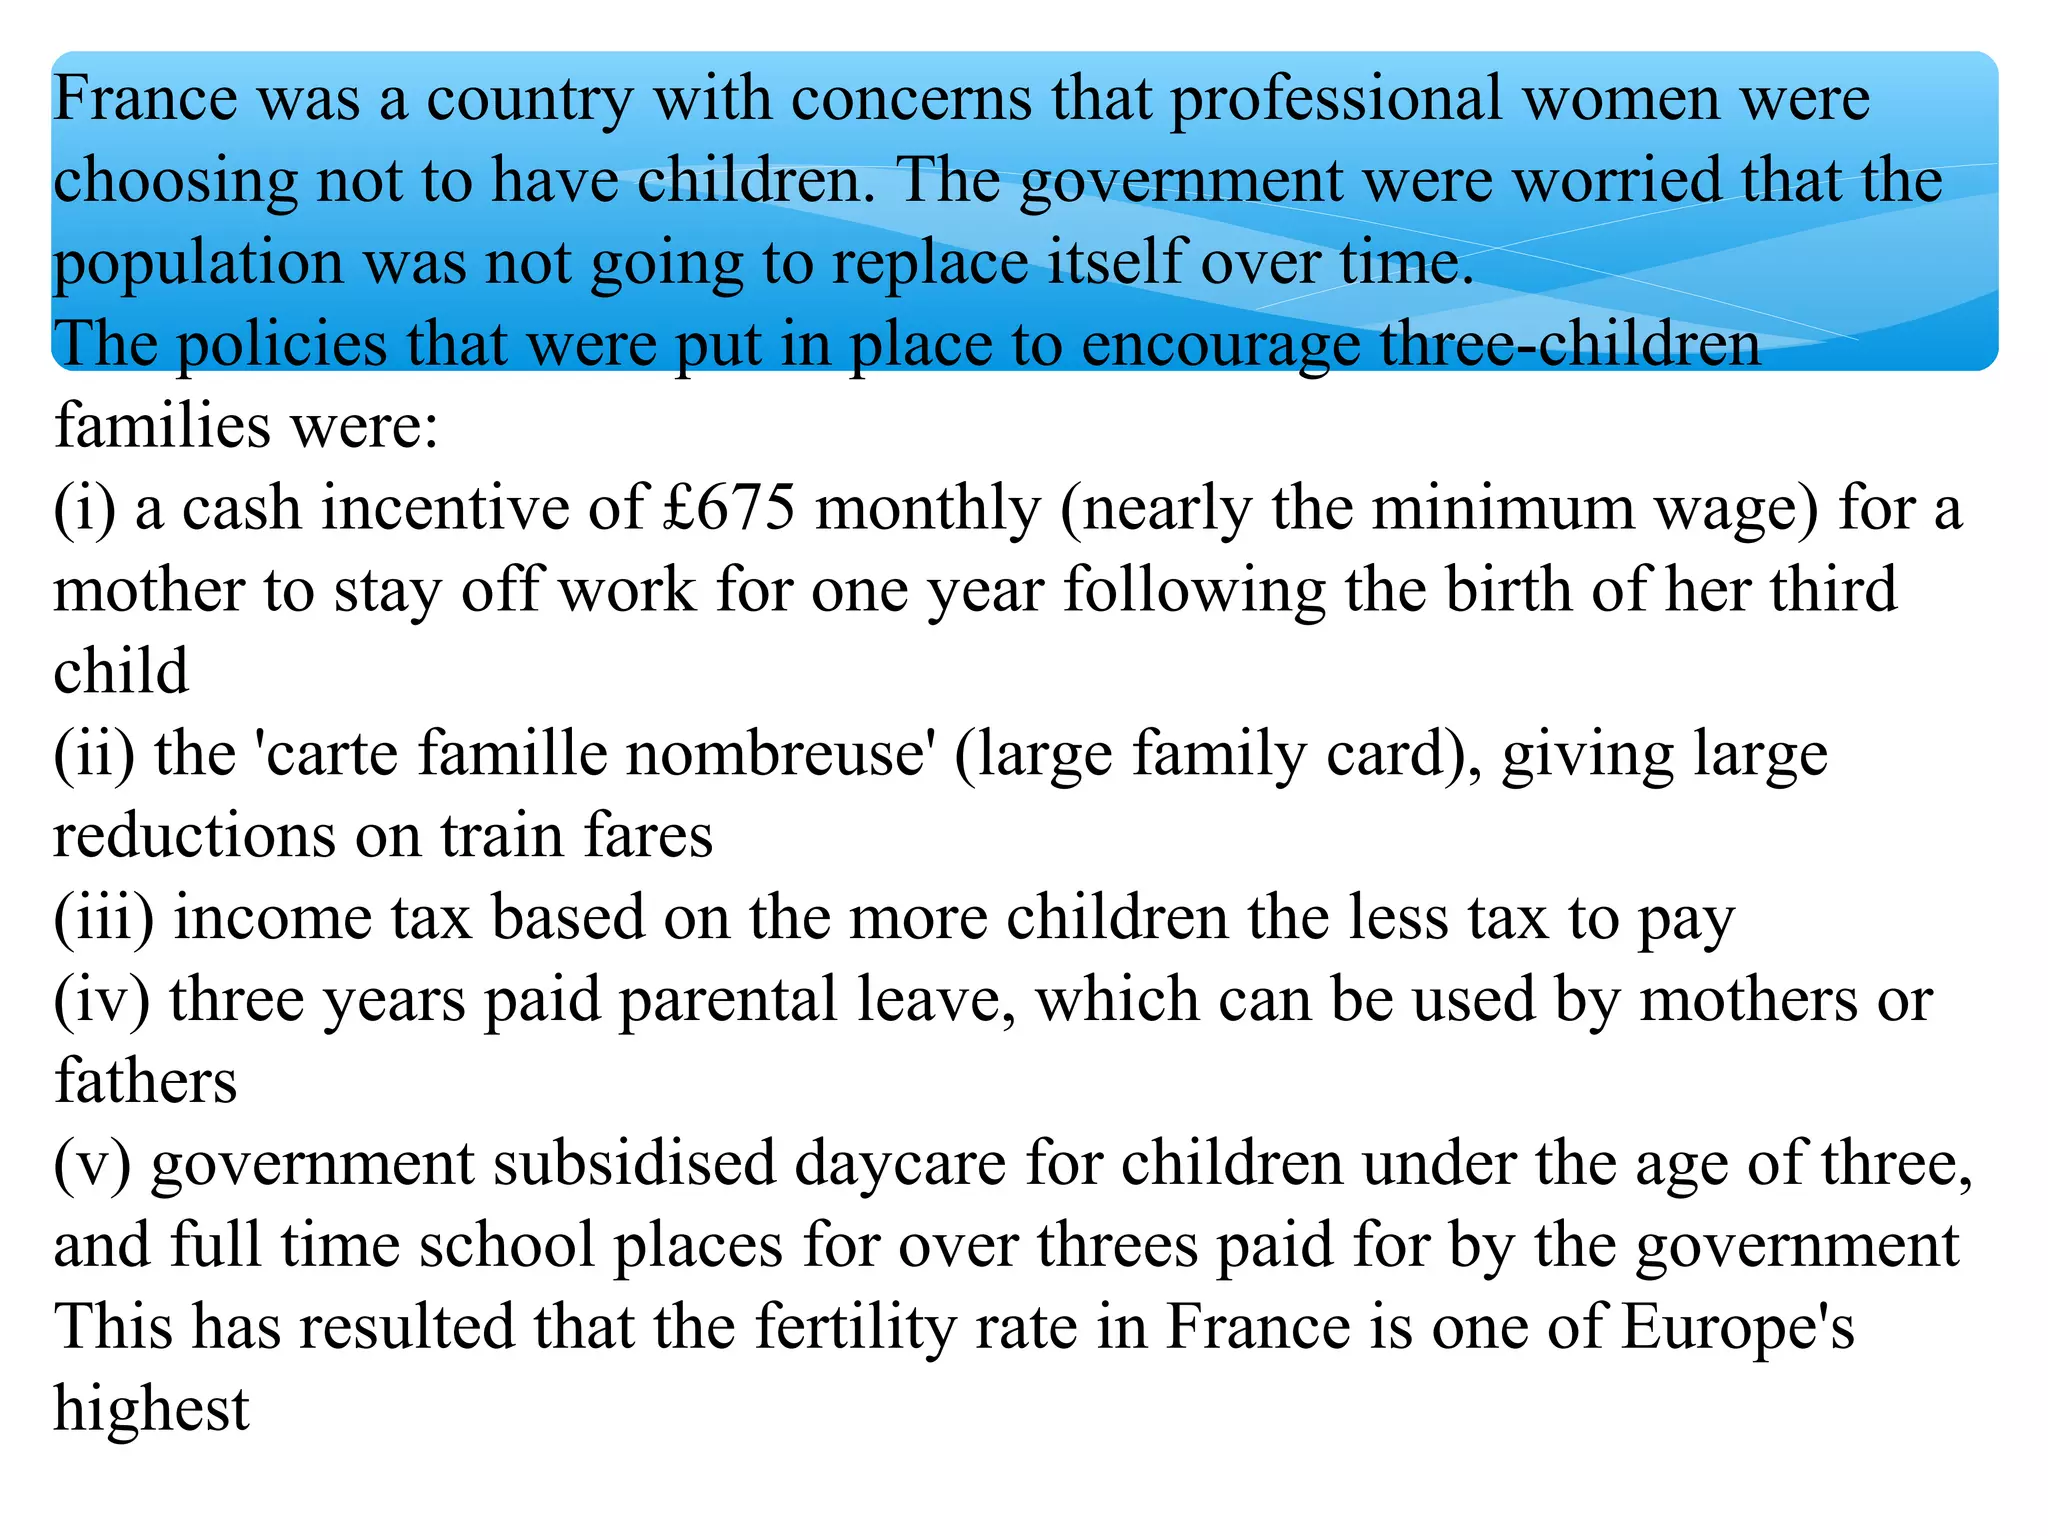


The document discusses population distribution, density, and factors influencing them, including physical and human reasons. It defines key concepts such as over-population, under-population, birth rates, and migration, while describing population distribution patterns across different regions. Additionally, it explores demographic transitions, population structures, and provides case studies on policies impacting population growth and fertility rates.