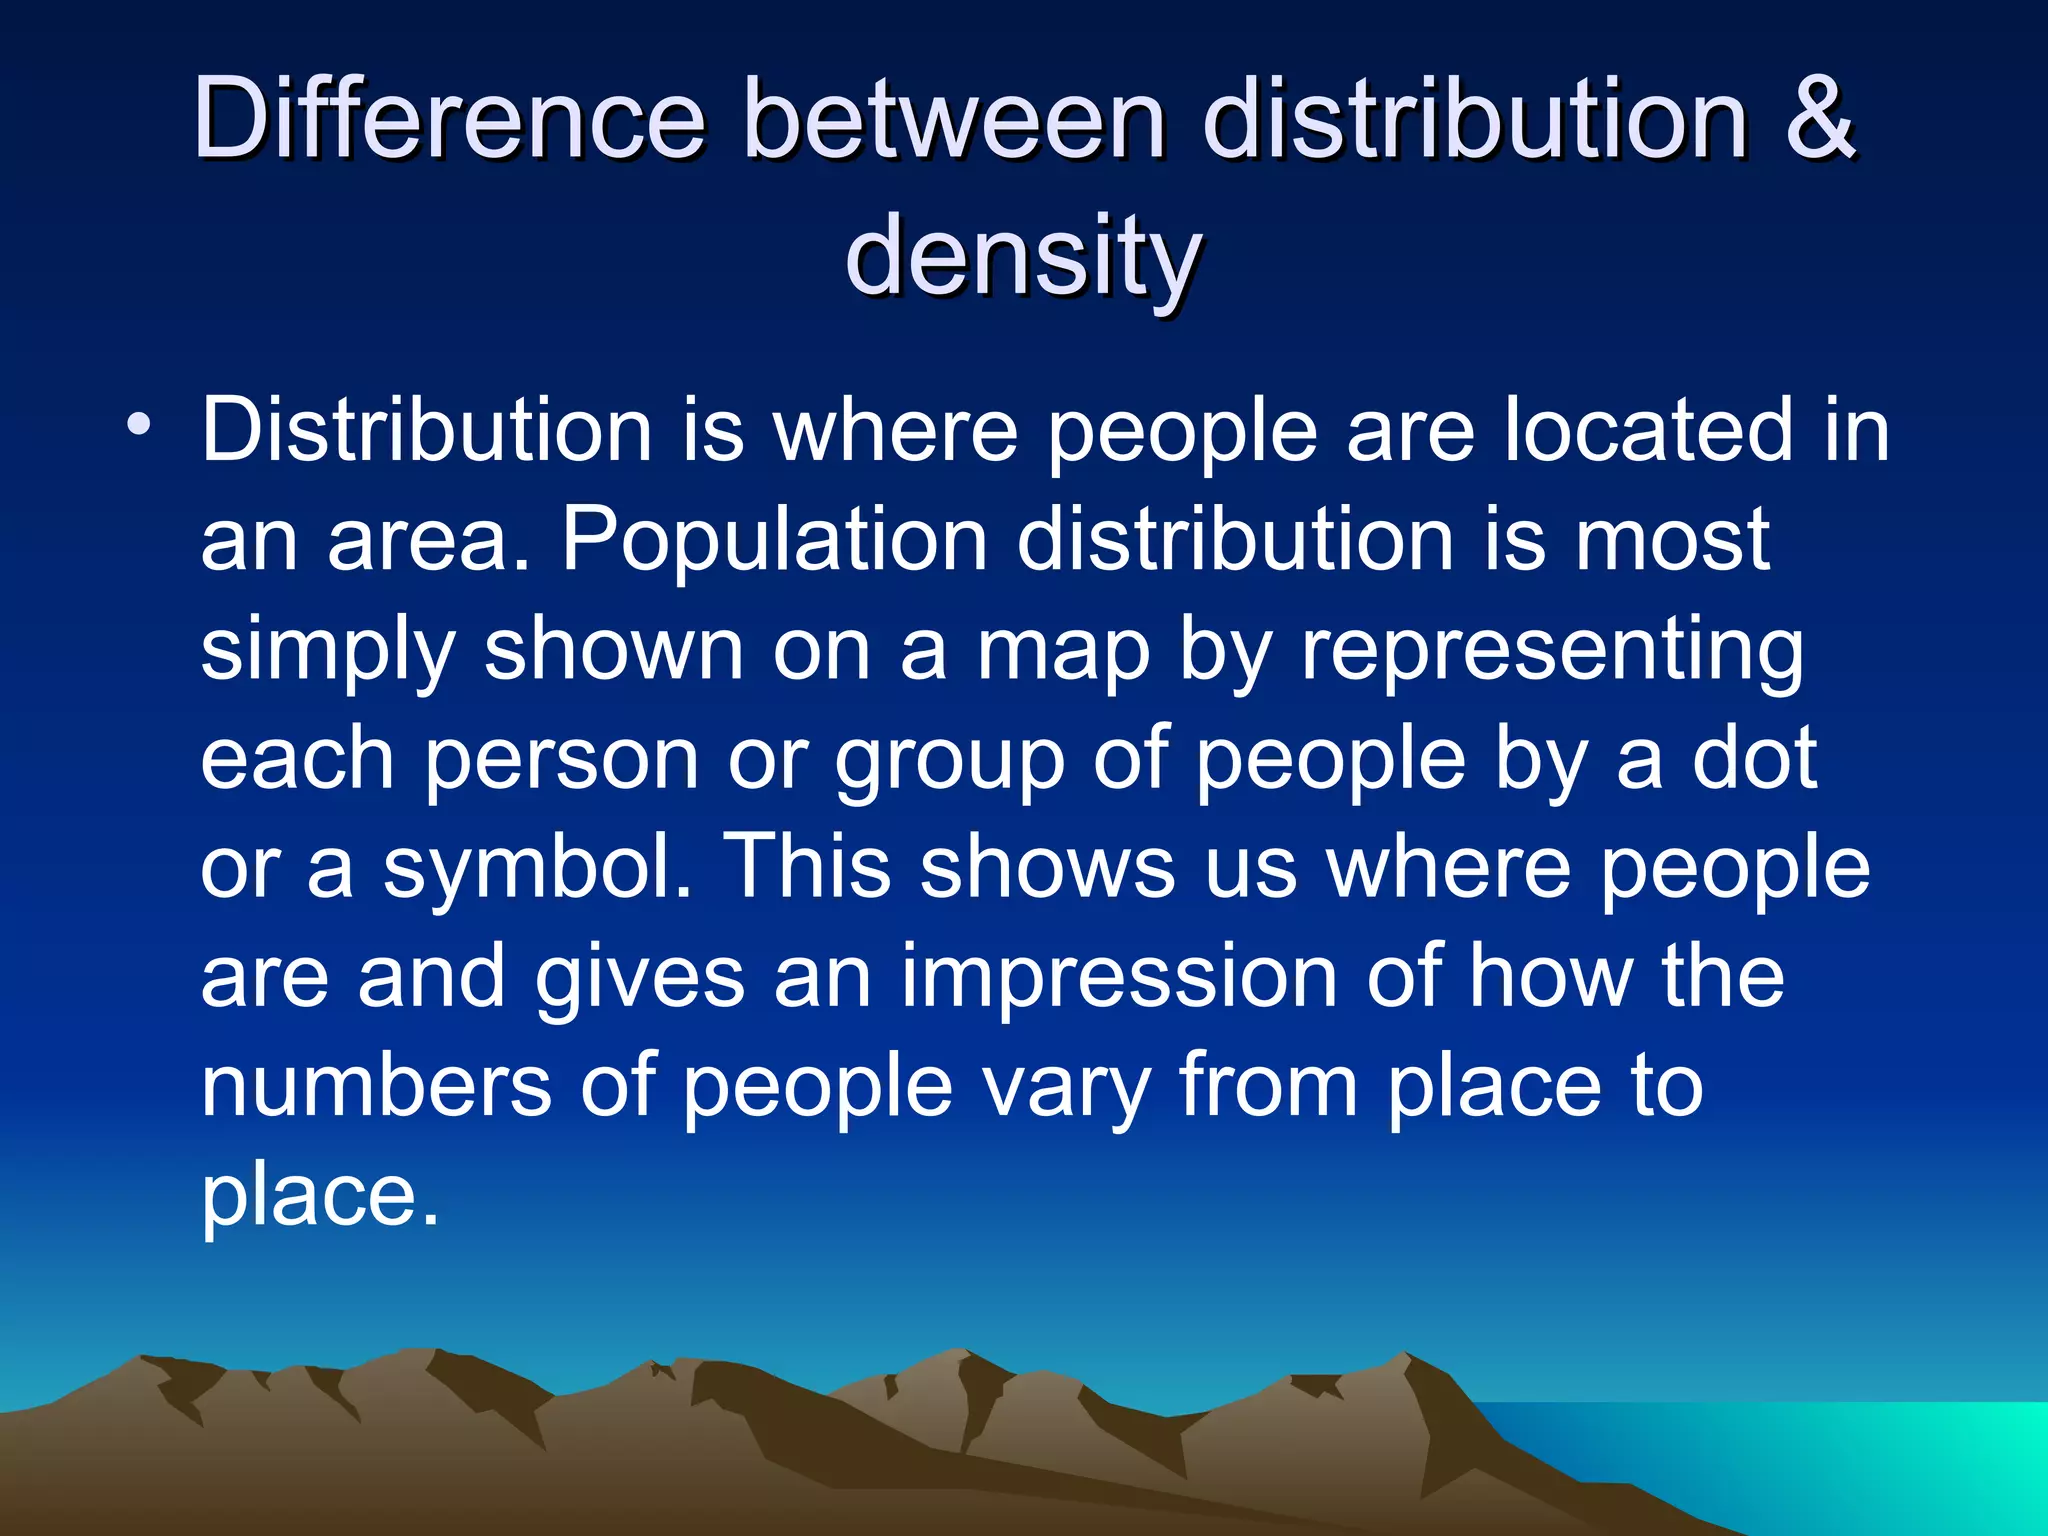
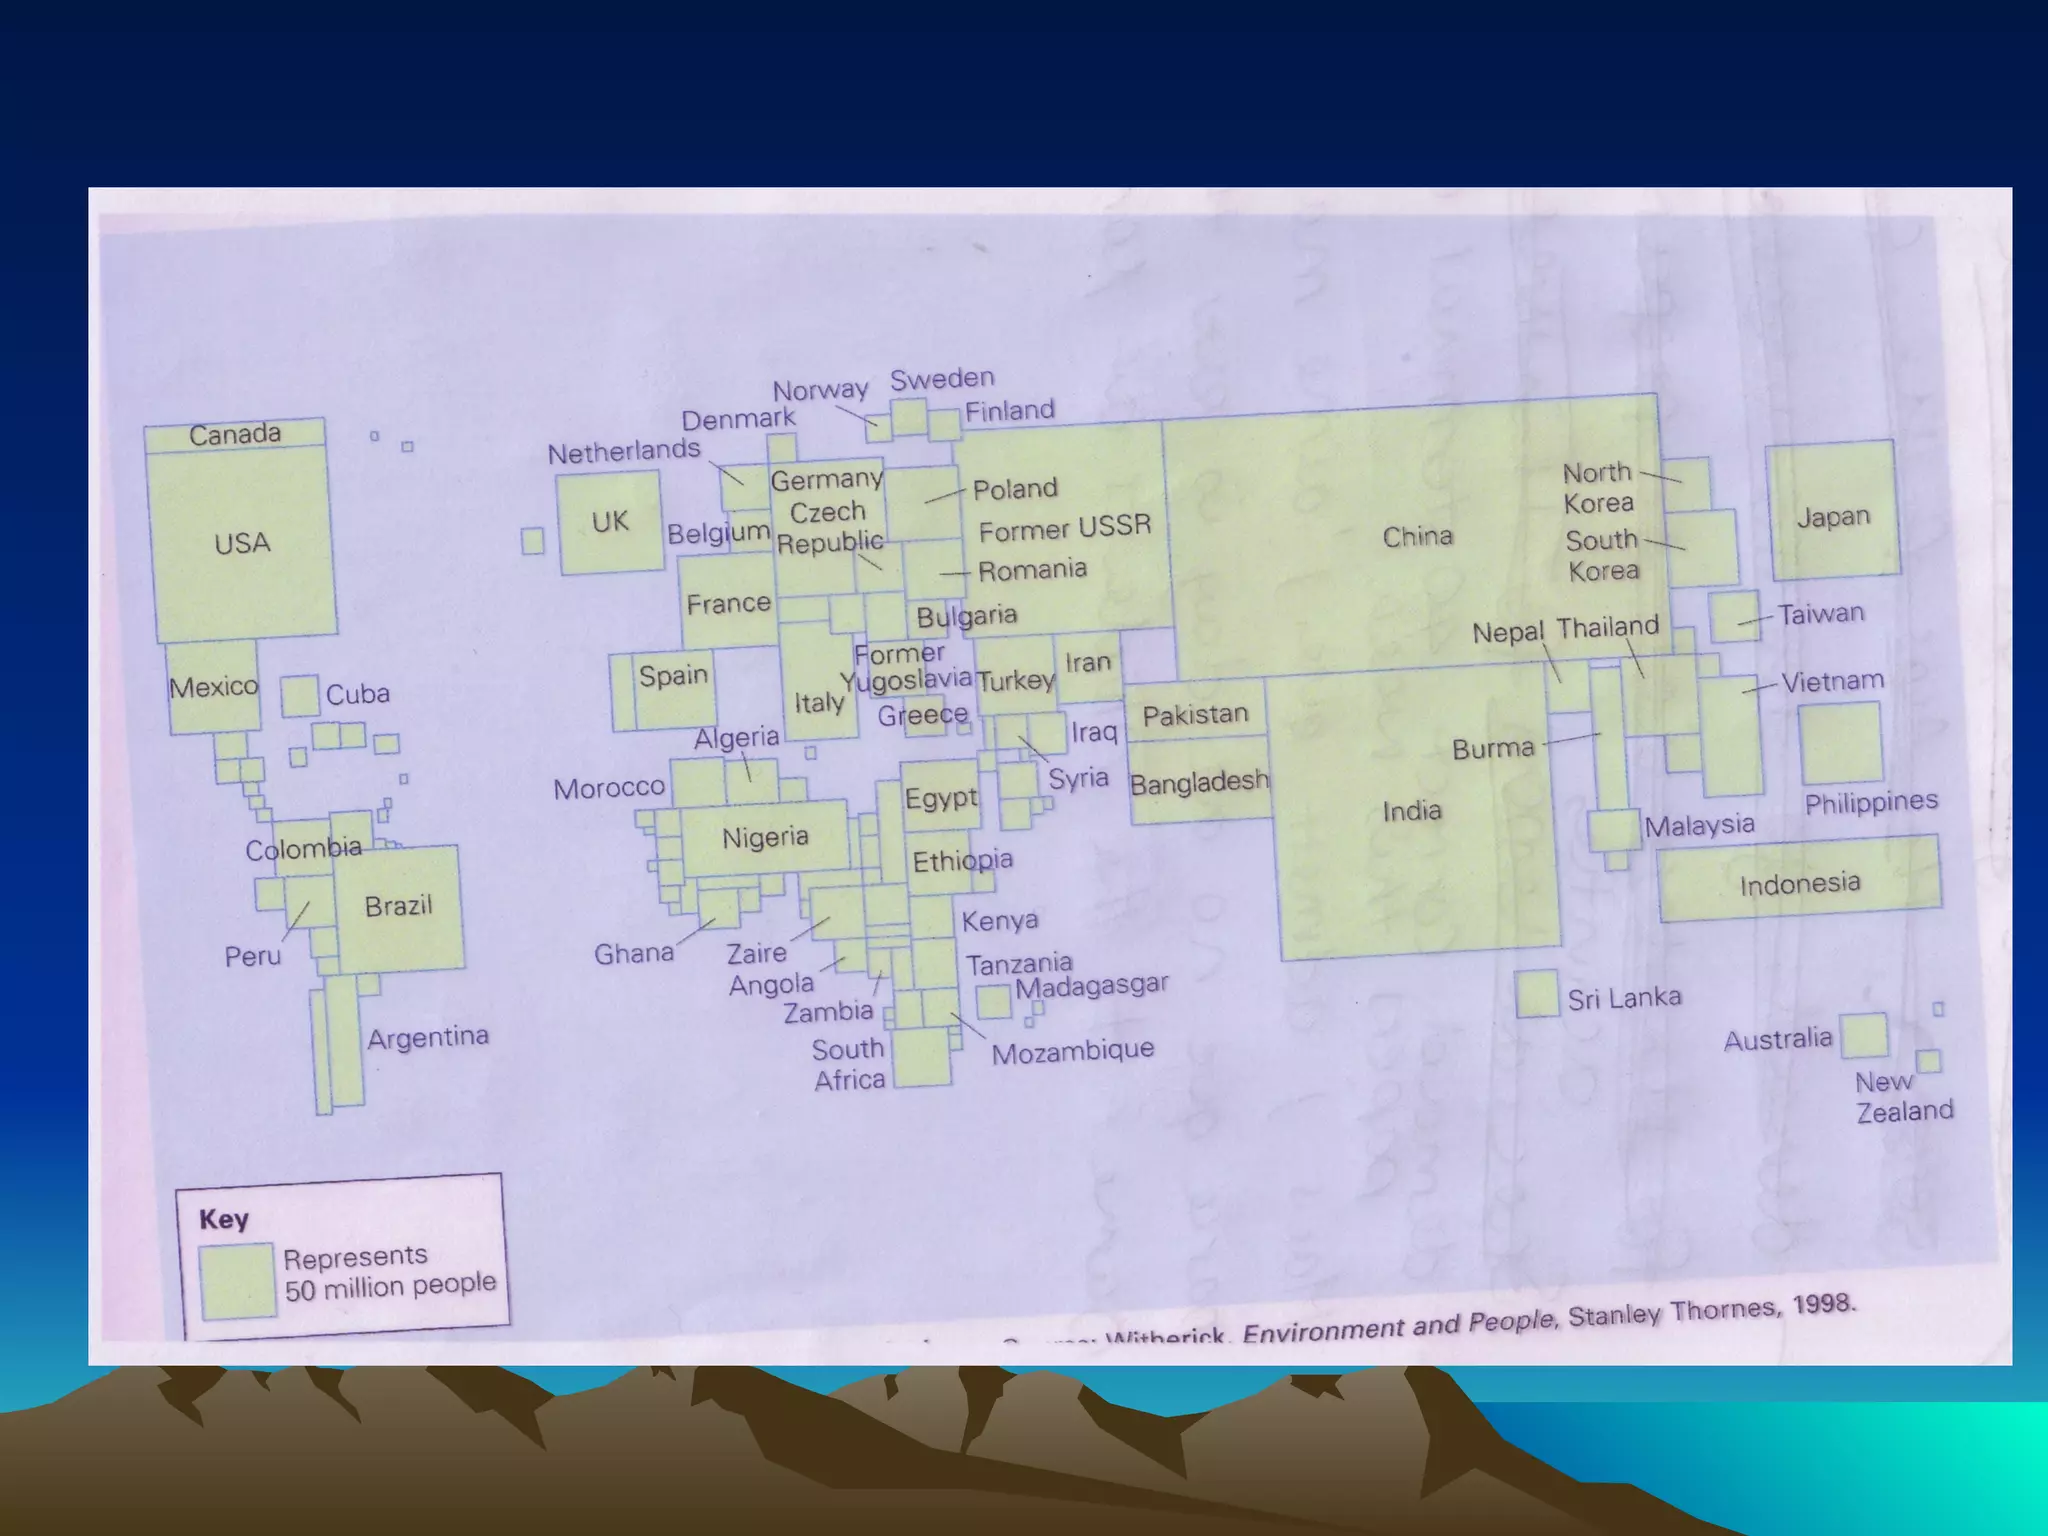
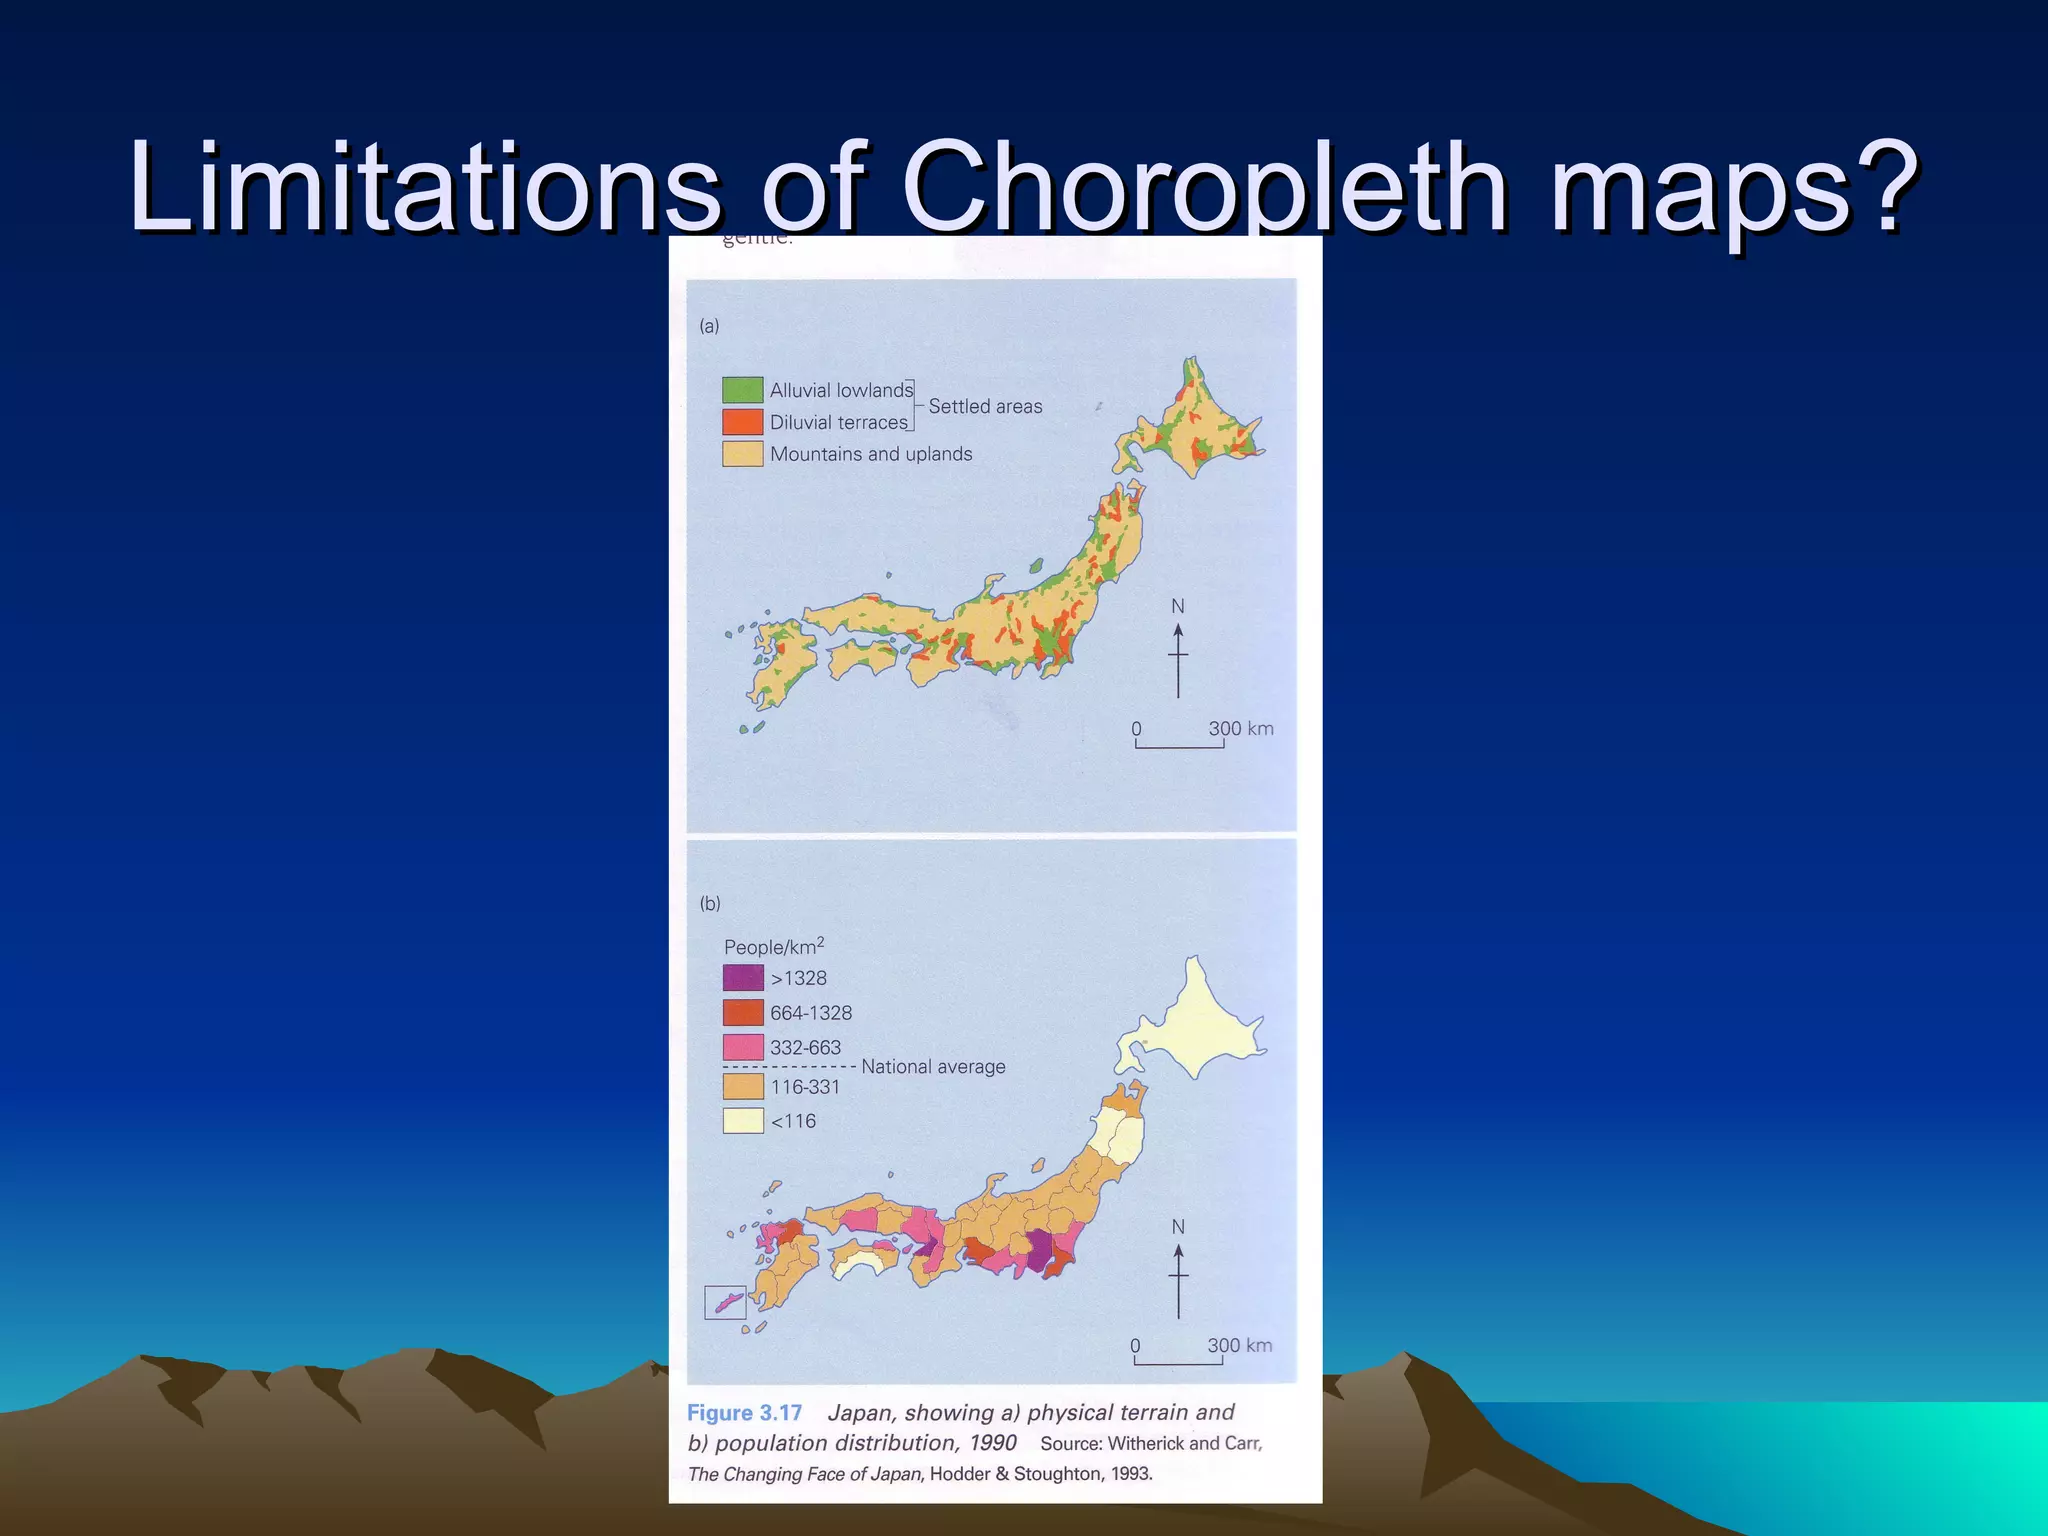
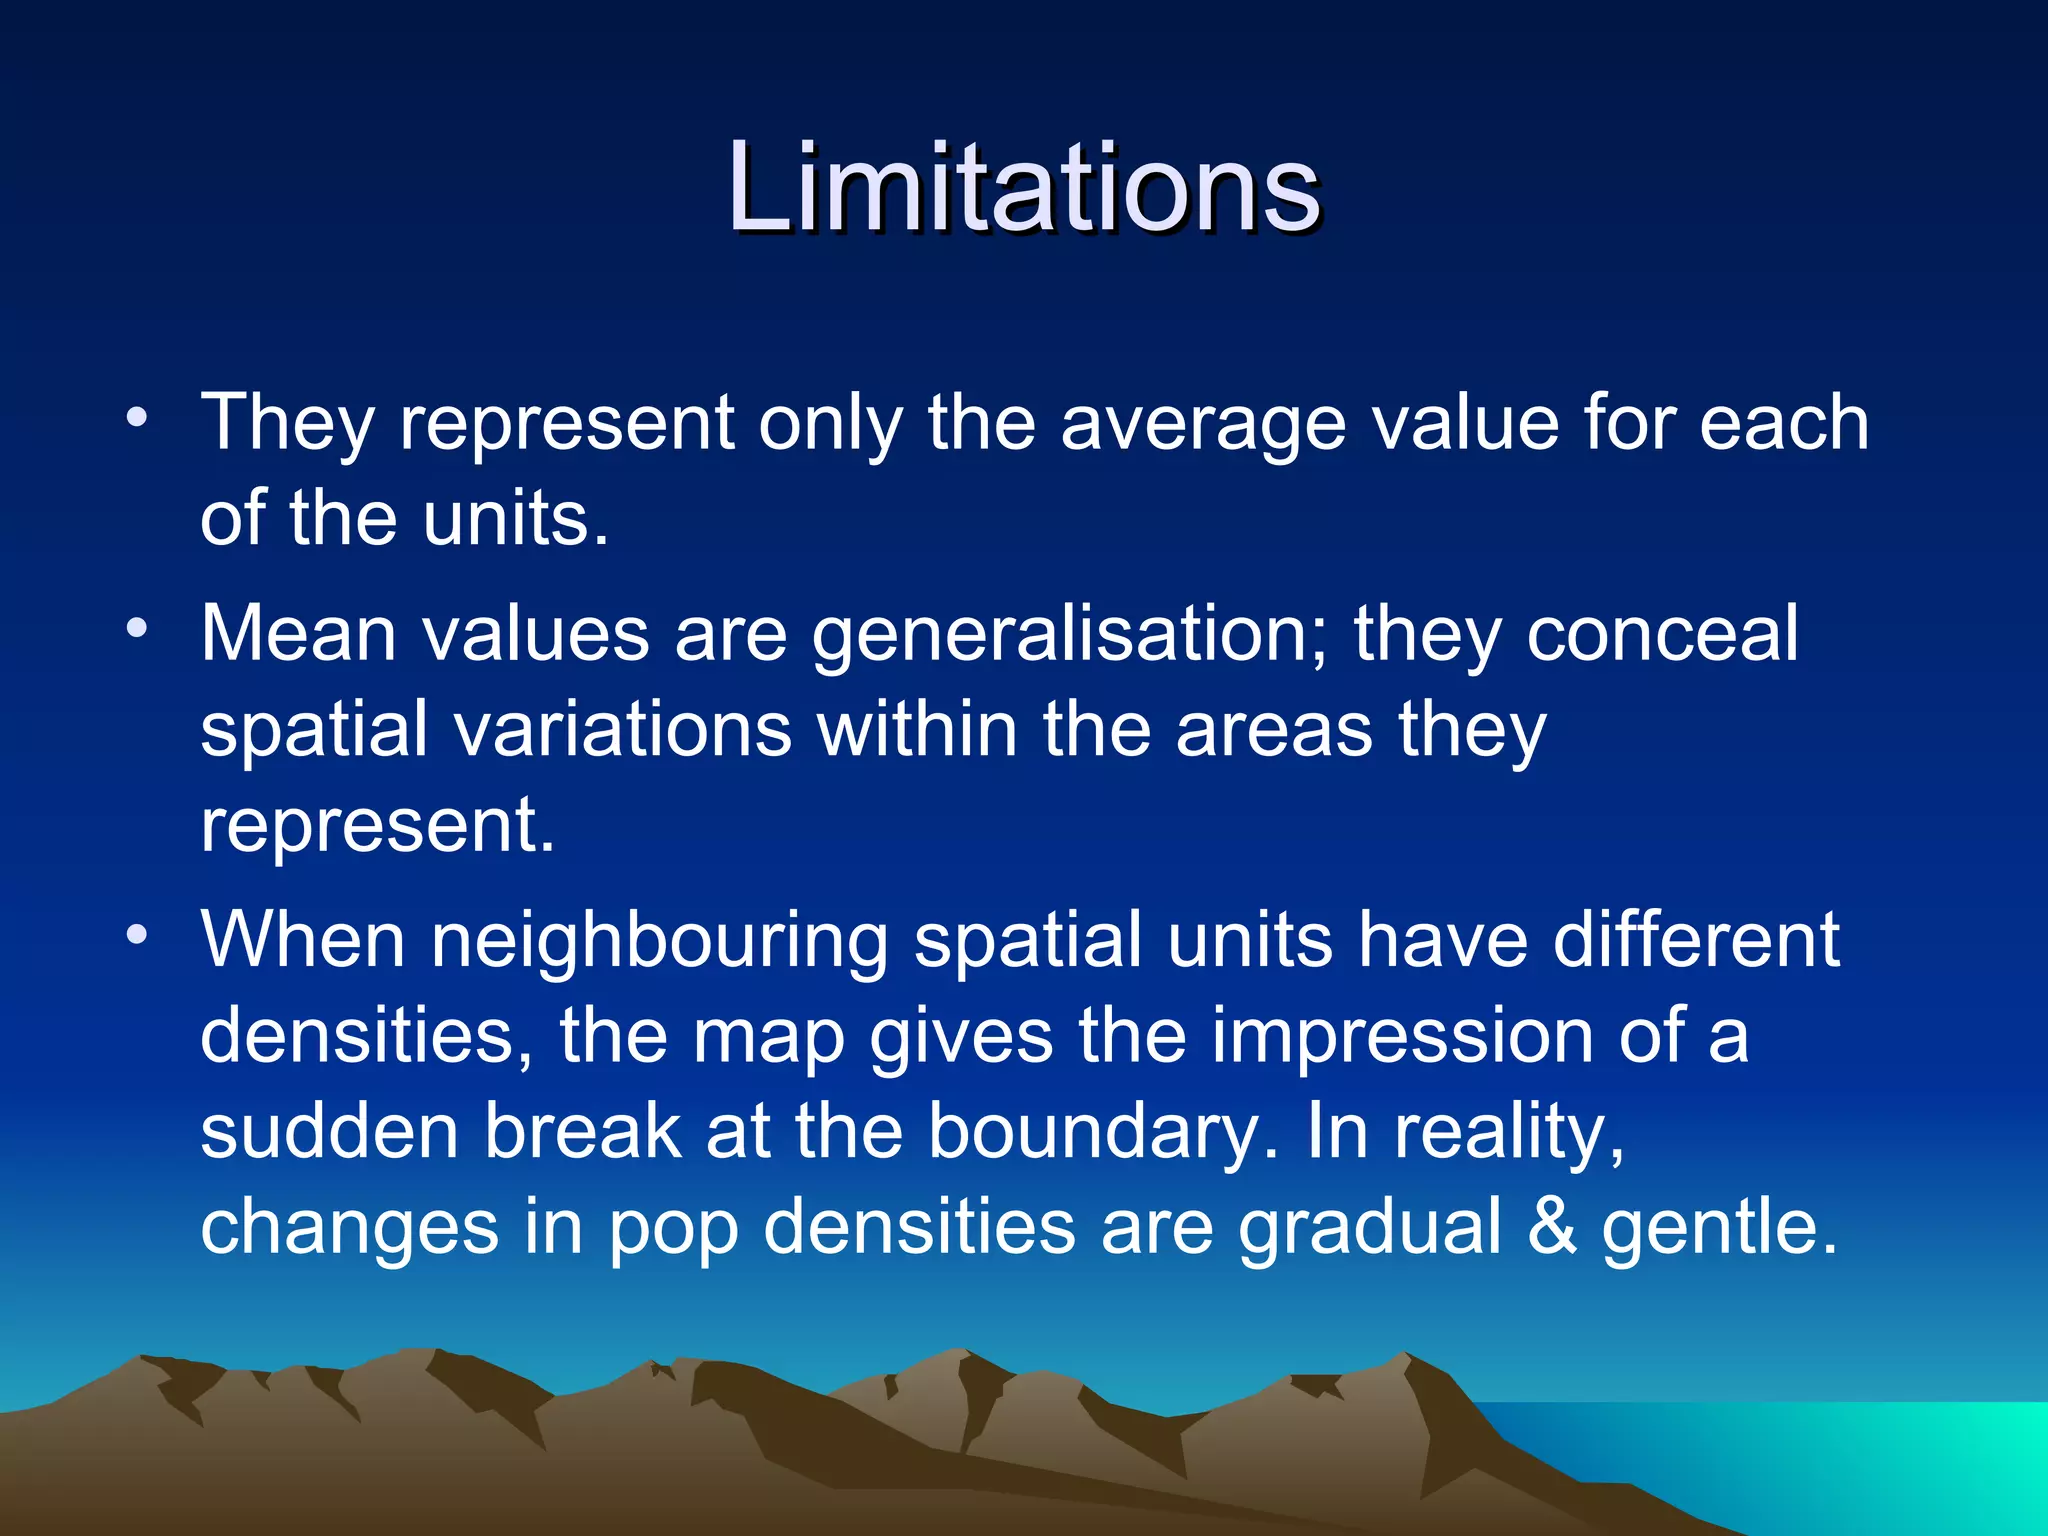
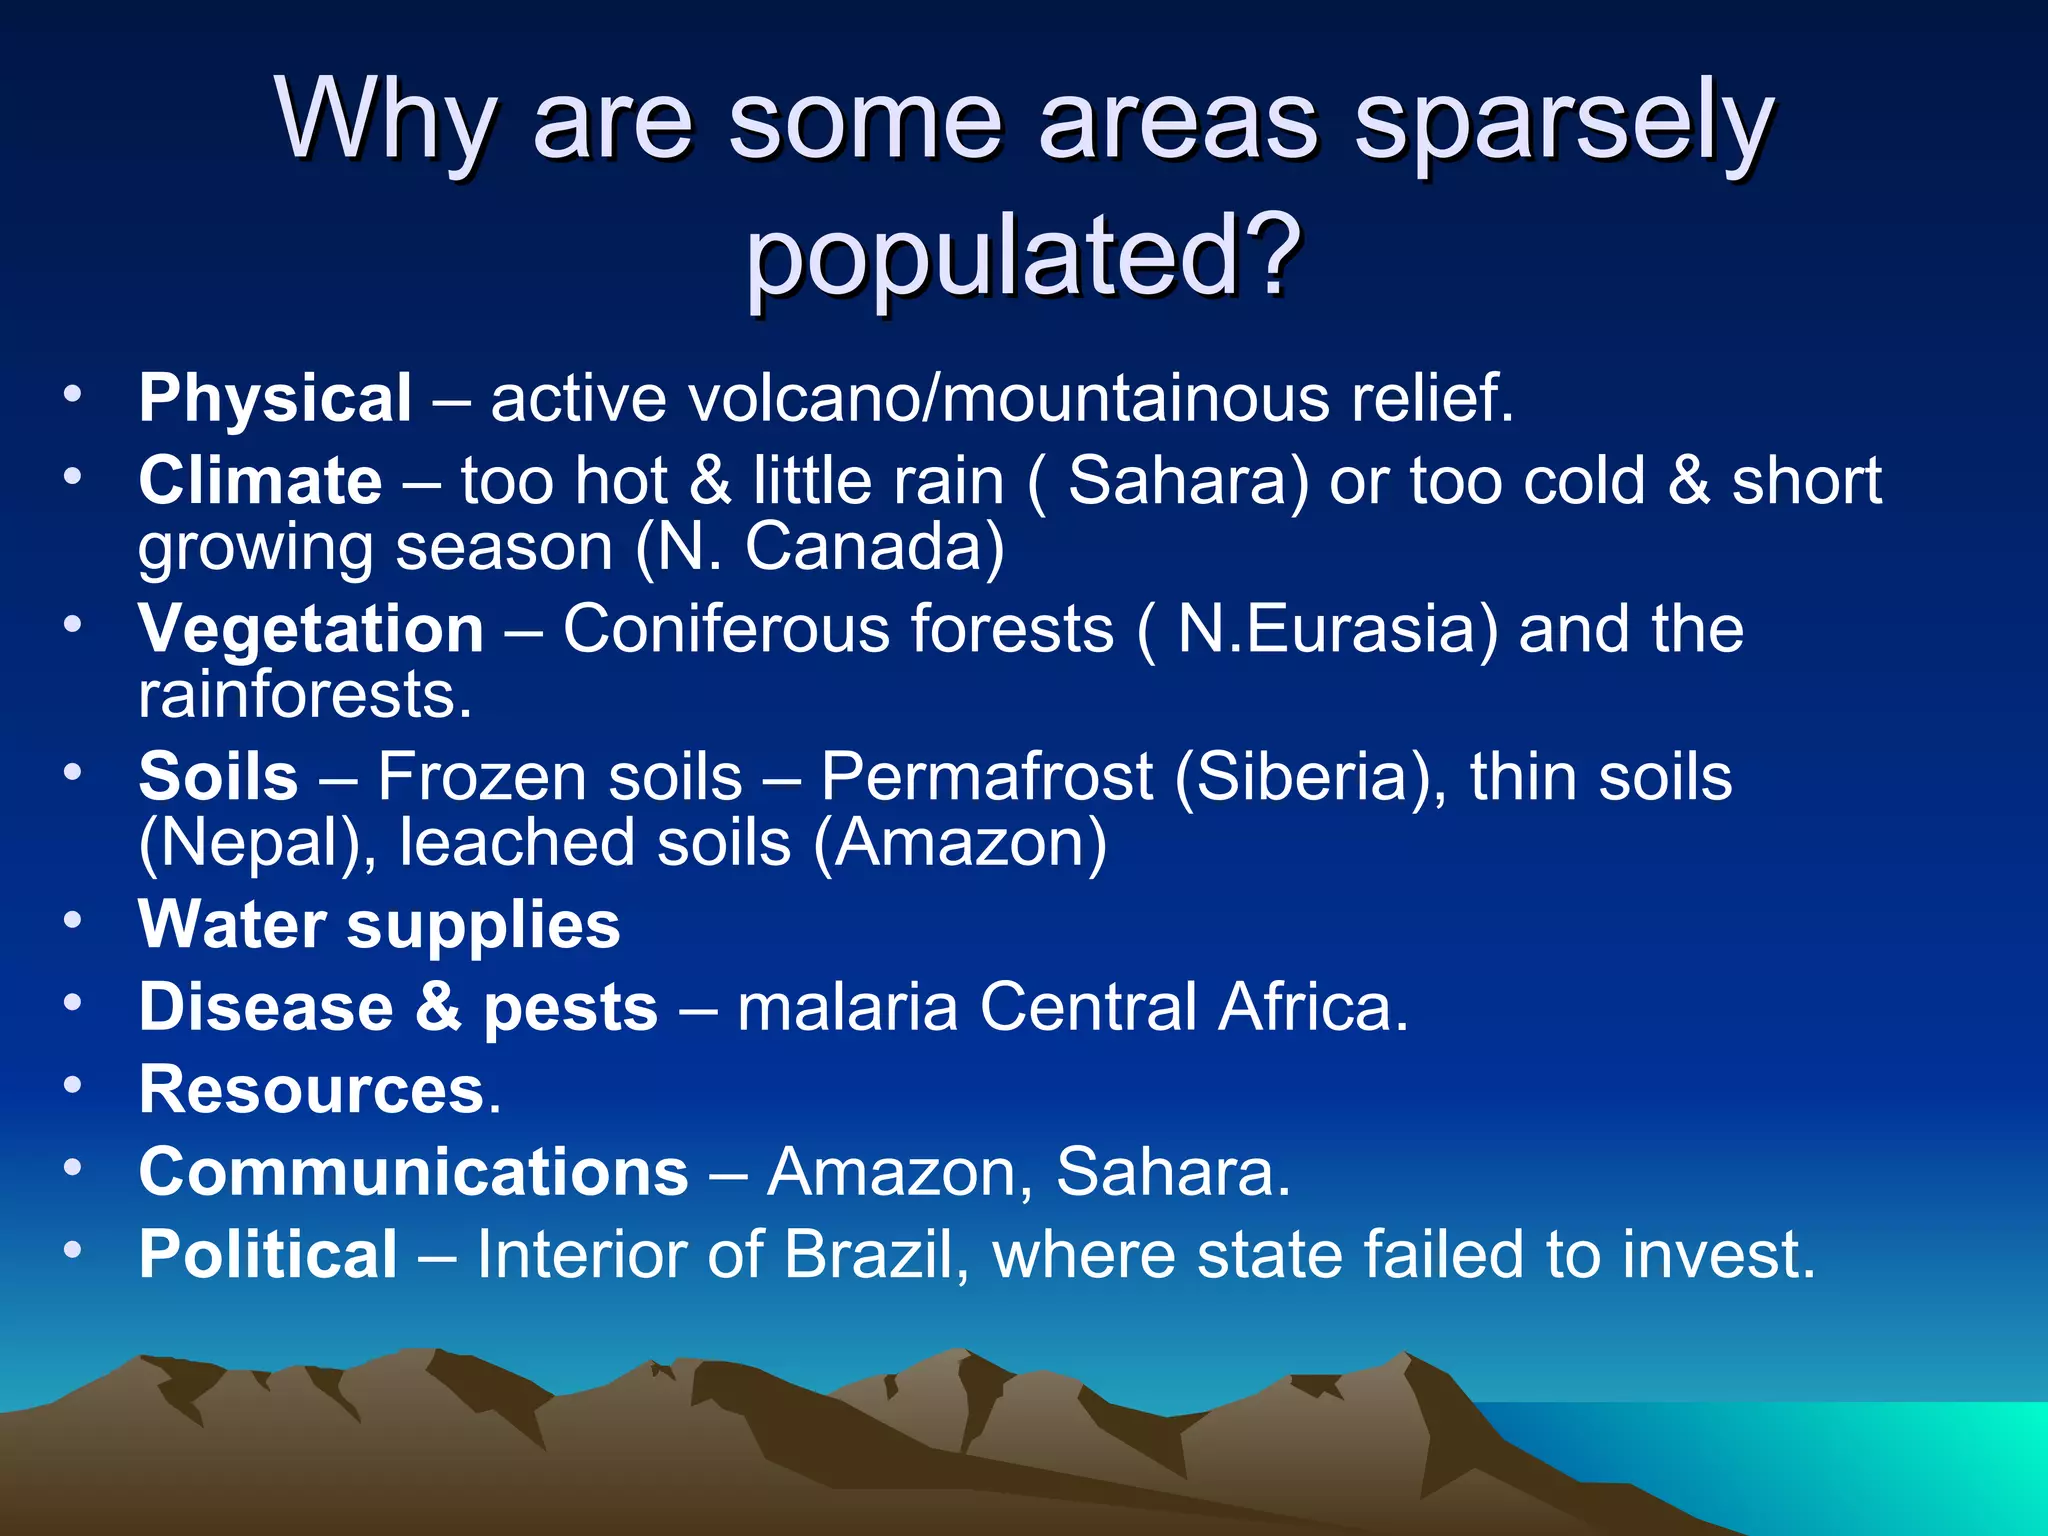
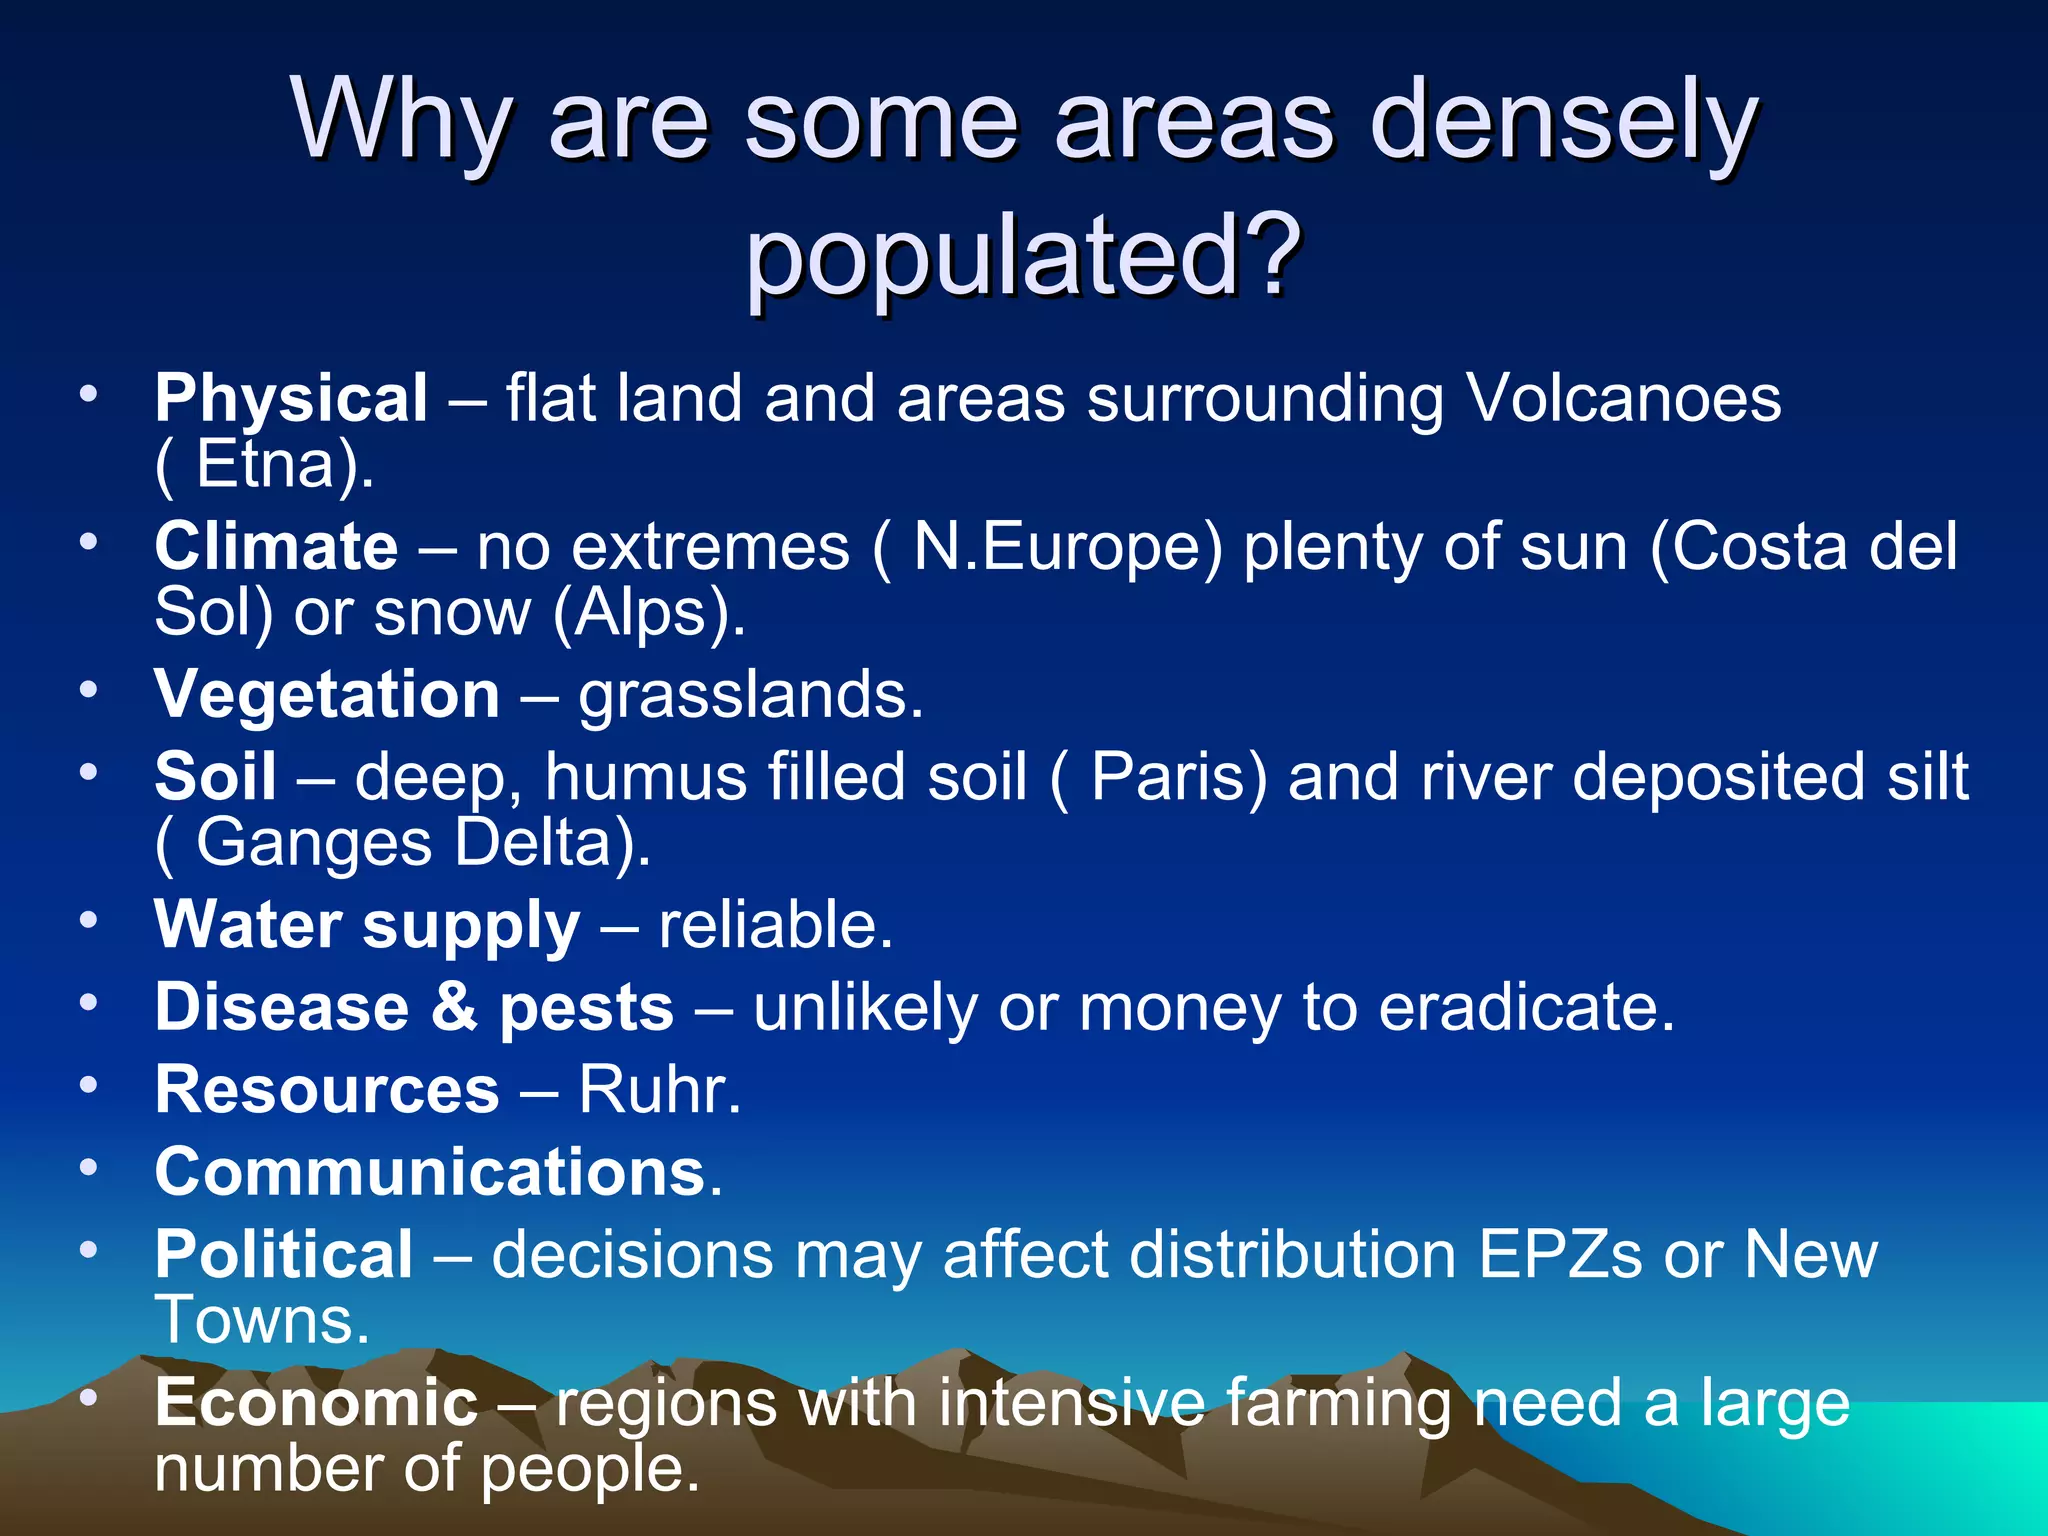
There are two main ways to map population distribution: showing where individuals are located or plotting population density by area. Population density maps the relationship between population numbers and land area using a choropleth method showing people per square kilometer. However, choropleth maps have limitations as they use average densities that can conceal variations within areas and give a sudden impression of changes between neighboring units. For example, Japan's average density understates concentrations in habitable lowlands. Physical, climatic, environmental and socioeconomic factors all influence why some areas have low or high population densities.


![Water Cycle[1] Power Point](https://cdn.slidesharecdn.com/ss_thumbnails/watercycle1power-point-1216950873012568-9-thumbnail.jpg?width=640&height=640&fit=bounds)


