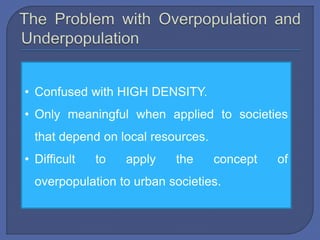
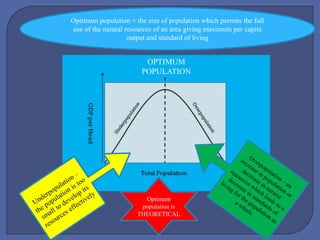
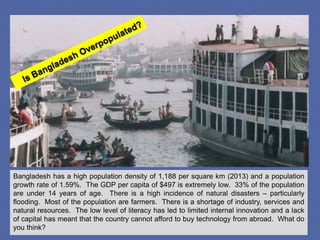
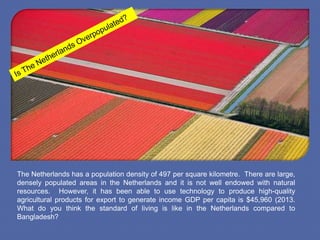
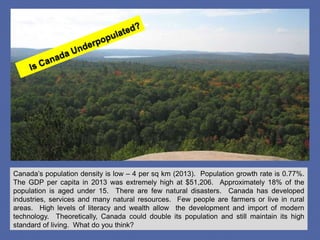
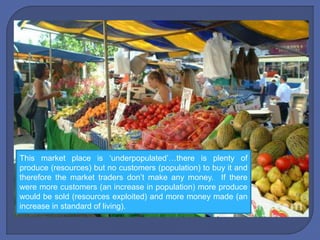
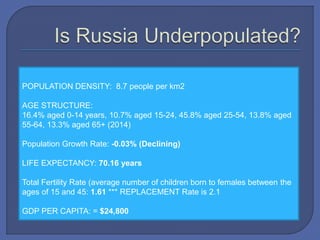
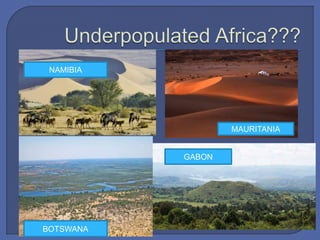
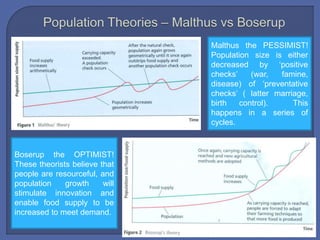
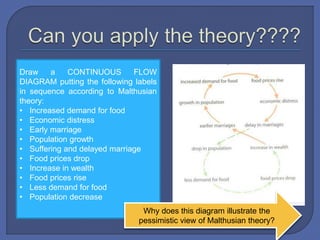
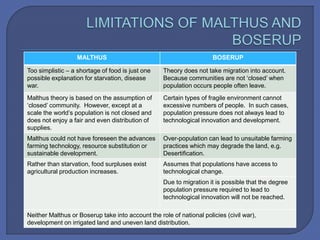
How does population
growth relate to these
concepts?
Is this country overpopulated or
underpopulated?
This is a photograph of Bogota in Columbia. It has
a population density of 39 per square km.
This is a photograph of Singapore –
population density of 7,486 per square km
• Confused with HIGH DENSITY.
• Only meaningful when applied to societies
that depend on local resources.
• Difficult to apply the concept of
overpopulation to urban societies.
 OPTIMUM POPULATION: The level of population which, through
production of goods and services, provides the highest average
standard of living.
 OVERPOPULATION: When there are too many people in an area
relative to the resources and the level of technology available.
 UNDERPOPULATION: The population cannot fully utilise the
resources available. An increase in population would lead to an
increase in standard of living.
 CARRYING CAPACITY: The largest population that a particular
area/environment can support.
 EXCESS CAPACITY: When carrying capacity exceeds
population number (per unit area).
 POPULATION PRESSURE: When population per unit area
exceeds the carrying capacity.
OPTIMUM
POPULATION
Optimum population = the size of population which permits the full
use of the natural resources of an area giving maximum per capita
output and standard of living
Optimum
population is
THEORETICAL
Bangladesh has a high population density of 1,188 per square km (2013) and a population
growth rate of 1.59%. The GDP per capita of $497 is extremely low. 33% of the population
are under 14 years of age. There is a high incidence of natural disasters – particularly
flooding. Most of the population are farmers. There is a shortage of industry, services and
natural resources. The low level of literacy has led to limited internal innovation and a lack
of capital has meant that the country cannot afford to buy technology from abroad. What do
you think?
The Netherlands has a population density of 497 per square kilometre. There are large,
densely populated areas in the Netherlands and it is not well endowed with natural
resources. However, it has been able to use technology to produce high-quality
agricultural products for export to generate income GDP per capita is $45,960 (2013.
What do you think the standard of living is like in the Netherlands compared to
Bangladesh?
Canada’s population density is low – 4 per sq km (2013). Population growth rate is 0.77%.
The GDP per capita in 2013 was extremely high at $51,206. Approximately 18% of the
population is aged under 15. There are few natural disasters. Canada has developed
industries, services and many natural resources. Few people are farmers or live in rural
areas. High levels of literacy and wealth allow the development and import of modern
technology. Theoretically, Canada could double its population and still maintain its high
standard of living. What do you think?
This market place is ‘underpopulated’…there is plenty of
produce (resources) but no customers (population) to buy it and
therefore the market traders don’t make any money. If there
were more customers (an increase in population) more produce
would be sold (resources exploited) and more money made (an
increase in standard of living).
POPULATION DENSITY: 8.7 people per km2
AGE STRUCTURE:
16.4% aged 0-14 years, 10.7% aged 15-24, 45.8% aged 25-54, 13.8% aged
55-64, 13.3% aged 65+ (2014)
Population Growth Rate: -0.03% (Declining)
LIFE EXPECTANCY: 70.16 years
Total Fertility Rate (average number of children born to females between the
ages of 15 and 45: 1.61 *** REPLACEMENT Rate is 2.1
GDP PER CAPITA: = $24,800
NAMIBIA
MAURITANIA
BOTSWANA
GABON
Problems
caused by
overpopulation
Social
Economic
Environmental
Political
Malthus the PESSIMIST!
Population size is either
decreased by ‘positive
checks’ (war, famine,
disease) of ‘preventative
checks’ ( latter marriage,
birth control). This
happens in a series of
cycles.
Boserup the OPTIMIST!
These theorists believe that
people are resourceful, and
population growth will
stimulate innovation and
enable food supply to be
increased to meet demand.
Draw a CONTINUOUS FLOW
DIAGRAM putting the following labels
in sequence according to Malthusian
theory:
• Increased demand for food
• Economic distress
• Early marriage
• Population growth
• Suffering and delayed marriage
• Food prices drop
• Increase in wealth
• Food prices rise
• Less demand for food
• Population decrease
Why does this diagram illustrate the
pessimistic view of Malthusian theory?
MALTHUS BOSERUP
Too simplistic – a shortage of food is just one
possible explanation for starvation, disease
war.
Theory does not take migration into account.
Because communities are not ‘closed’ when
population occurs people often leave.
Malthus theory is based on the assumption of
‘closed’ community. However, except at a
scale the world’s population is not closed and
does not enjoy a fair and even distribution of
supplies.
Certain types of fragile environment cannot
excessive numbers of people. In such cases,
population pressure does not always lead to
technological innovation and development.
Malthus could not have foreseen the advances
farming technology, resource substitution or
sustainable development.
Over-population can lead to unsuitable farming
practices which may degrade the land, e.g.
Desertification.
Rather than starvation, food surpluses exist
agricultural production increases.
Assumes that populations have access to
technological change.
Due to migration it is possible that the degree
population pressure required to lead to
technological innovation will not be reached.
Neither Malthus or Boserup take into account the role of national policies (civil war),
development on irrigated land and uneven land distribution.

Overpopulation and underpopulation

  • 1.
    How does population growthrelate to these concepts?
  • 2.
    Is this countryoverpopulated or underpopulated? This is a photograph of Bogota in Columbia. It has a population density of 39 per square km.
  • 3.
    This is aphotograph of Singapore – population density of 7,486 per square km
  • 4.
    • Confused withHIGH DENSITY. • Only meaningful when applied to societies that depend on local resources. • Difficult to apply the concept of overpopulation to urban societies.
  • 5.
     OPTIMUM POPULATION:The level of population which, through production of goods and services, provides the highest average standard of living.  OVERPOPULATION: When there are too many people in an area relative to the resources and the level of technology available.  UNDERPOPULATION: The population cannot fully utilise the resources available. An increase in population would lead to an increase in standard of living.  CARRYING CAPACITY: The largest population that a particular area/environment can support.  EXCESS CAPACITY: When carrying capacity exceeds population number (per unit area).  POPULATION PRESSURE: When population per unit area exceeds the carrying capacity.
  • 6.
    OPTIMUM POPULATION Optimum population =the size of population which permits the full use of the natural resources of an area giving maximum per capita output and standard of living Optimum population is THEORETICAL
  • 7.
    Bangladesh has ahigh population density of 1,188 per square km (2013) and a population growth rate of 1.59%. The GDP per capita of $497 is extremely low. 33% of the population are under 14 years of age. There is a high incidence of natural disasters – particularly flooding. Most of the population are farmers. There is a shortage of industry, services and natural resources. The low level of literacy has led to limited internal innovation and a lack of capital has meant that the country cannot afford to buy technology from abroad. What do you think?
  • 8.
    The Netherlands hasa population density of 497 per square kilometre. There are large, densely populated areas in the Netherlands and it is not well endowed with natural resources. However, it has been able to use technology to produce high-quality agricultural products for export to generate income GDP per capita is $45,960 (2013. What do you think the standard of living is like in the Netherlands compared to Bangladesh?
  • 9.
    Canada’s population densityis low – 4 per sq km (2013). Population growth rate is 0.77%. The GDP per capita in 2013 was extremely high at $51,206. Approximately 18% of the population is aged under 15. There are few natural disasters. Canada has developed industries, services and many natural resources. Few people are farmers or live in rural areas. High levels of literacy and wealth allow the development and import of modern technology. Theoretically, Canada could double its population and still maintain its high standard of living. What do you think?
  • 10.
    This market placeis ‘underpopulated’…there is plenty of produce (resources) but no customers (population) to buy it and therefore the market traders don’t make any money. If there were more customers (an increase in population) more produce would be sold (resources exploited) and more money made (an increase in standard of living).
  • 11.
    POPULATION DENSITY: 8.7people per km2 AGE STRUCTURE: 16.4% aged 0-14 years, 10.7% aged 15-24, 45.8% aged 25-54, 13.8% aged 55-64, 13.3% aged 65+ (2014) Population Growth Rate: -0.03% (Declining) LIFE EXPECTANCY: 70.16 years Total Fertility Rate (average number of children born to females between the ages of 15 and 45: 1.61 *** REPLACEMENT Rate is 2.1 GDP PER CAPITA: = $24,800
  • 12.
  • 13.
  • 14.
    Malthus the PESSIMIST! Populationsize is either decreased by ‘positive checks’ (war, famine, disease) of ‘preventative checks’ ( latter marriage, birth control). This happens in a series of cycles. Boserup the OPTIMIST! These theorists believe that people are resourceful, and population growth will stimulate innovation and enable food supply to be increased to meet demand.
  • 15.
    Draw a CONTINUOUSFLOW DIAGRAM putting the following labels in sequence according to Malthusian theory: • Increased demand for food • Economic distress • Early marriage • Population growth • Suffering and delayed marriage • Food prices drop • Increase in wealth • Food prices rise • Less demand for food • Population decrease Why does this diagram illustrate the pessimistic view of Malthusian theory?
  • 16.
    MALTHUS BOSERUP Too simplistic– a shortage of food is just one possible explanation for starvation, disease war. Theory does not take migration into account. Because communities are not ‘closed’ when population occurs people often leave. Malthus theory is based on the assumption of ‘closed’ community. However, except at a scale the world’s population is not closed and does not enjoy a fair and even distribution of supplies. Certain types of fragile environment cannot excessive numbers of people. In such cases, population pressure does not always lead to technological innovation and development. Malthus could not have foreseen the advances farming technology, resource substitution or sustainable development. Over-population can lead to unsuitable farming practices which may degrade the land, e.g. Desertification. Rather than starvation, food surpluses exist agricultural production increases. Assumes that populations have access to technological change. Due to migration it is possible that the degree population pressure required to lead to technological innovation will not be reached. Neither Malthus or Boserup take into account the role of national policies (civil war), development on irrigated land and uneven land distribution.

Editor's Notes

  • #5 High density no more suggests overpopulation than low density implies underpopulation e.g. Japan and the Netherlands have average densities in excess of 300 persons per km² and yet are some of the richest countries in the world. Singapore has a density of 6750 persons per km² but has a GDP per capita higher than Spain and New Zealand. A society based on subsistence agriculture must rely on local resources such as soil, water, wildlife and timber. In the absence of technological change, population growth will put pressure on local resources which may result in declining crop yields, food shortages and land degradation. Such a society could be thought of as overpopulated. In an urban society population densities have no relationship to local resources. The resources needed to sustain these populations are gathered globally and imported. So their impact on environments and resources is real enough, but too spread out to be clearly defined. The outcome is societies living at extreme high densities with high standards of living and enjoying rising levels of resource use.
  • #8 Clearly Bangladesh is overpopulated – what will the standard of living be like?
  • #9 Even though the Netherlands has a lack of natural resources, because the country has a well developed economy it is able to generate the income it needs to buy the resources that it requires.
  • #10 Compare the population density figures of the 3 examples: Bangladesh 1,123 per sq km, Netherlands 395 per sq km and Canada 3.67 per sq km. Canada has by far the lowest figure. Looking at the figures there is a clear indication that Canada is underpopulated, but why don’t more people live there? Areas of Canada that are inhospitable etc. The key here though is that although Canada is statistically underpopulated this is actually a benefit to the country as it allows there to be a higher standard of living for its inhabitants. It does not need to increase its population in order for living standards to improve. This would not be the case in an LEDC as it wouldn’t have the technology to allow it to maximise the resource potential of the country.
  • #11 Underpopulation is sometimes defined as when a country’s population has declined too much to support its current economic system. This is the case in somewhere like Russia. Declining population is an issue because it means that the workforce is not being replaced and so there is a loss of tax revenue and a high dependency ratio. Refer back to the case study that students completed when looking at components of population change (example of pro-natalist policy). Does Russia have the characteristics of underpopulation?
  • #12 (Photo is Lake Baikal, Siberia) Is population decline more of an issue for Russia, rather than underpopulation…or are they the same thing? Are there any other examples of underpopulation? Population Density 8.7 people per km2 16.4% aged 0-14 years, 10.7% aged 15-24, 45.8% aged 25-54, 13.8% aged 55-64, 13.3% aged 65+ (2014) PGR = -0.03% Life expectancy = 70.16 years TFR = 1.61 GDP = $24,800
  • #13 These are 4 of the least densely populated countries in Africa. Namibia 2.61, Mauritania 3.20, Botswana 3.55 and Gabon 5.89 (UK is 246). Find out the age structure, PGR, life expectancy, TFR and GDP per capita for each country. Does this information indicate that that these countries are underpopulated? Why/why not? E.g. Namibia (the least densely populated country in Africa). GDP per capita = $5693, very youthful population (31.7% aged 0-14, 23.1% aged 15-24, 35.9% aged 25-54, 4.8% aged 55-64 and 4.4% aged 65+), life expectancy = 51.85 years. BUT PGR is only 0.67% (the UK is approximately 0.6%) and TFR is 2.25 (only just above replacement level).
  • #14 Watch video linked from slide (quite a long one!) and get ideas for each of the headings. Social – conflict (ethnic), lack of housing, pressure on education and medical care Economic – lack of jobs, pressure on infrastructure, reliance on aid Environmental – increased pollution, pressure on resources, desertification due to pressure to farm on marginal land, deforestation Political – unstable governments, pressure to solve problems can lead to extreme policies
  • #15 Article on moodle to go with this (Geog Review).
  • #16 Once the negative checks kick in a population falls back down to a level that can be sustained by food production the cycle starts again (early marriage to replace those that died in the famine). This is why it is PESSIMISTIC.