The document discusses key topics related to world population including:
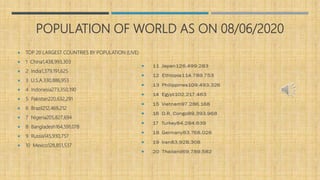
1. The current world population is 7.8 billion as of 2020 and is unevenly distributed across the world.
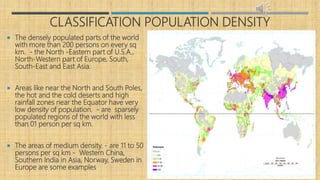
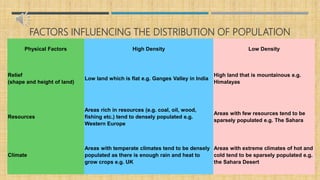
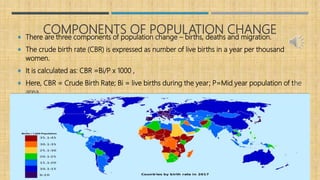
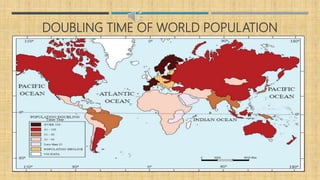
2. Population density varies based on factors like climate, resources, and level of development. densely populated areas have over 200 people per square km while sparsely populated areas have under 1 person per square km.
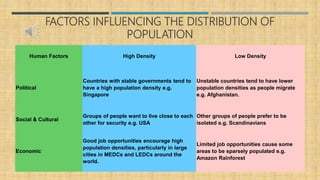
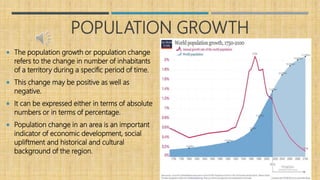
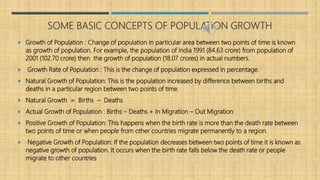
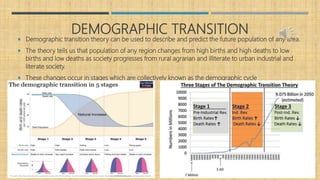
3. Population growth is influenced by birth rates, death rates, and migration patterns. Most countries have experienced a demographic transition from high birth/death rates to low birth/death rates as development increased.

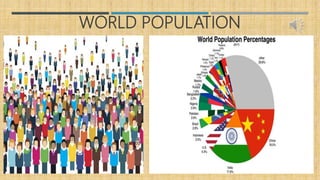
!["WORLD POPULATION"
7.8 Billion (2020)
The current world population is 7.8 billion as of June 2020 [1] according to the most recent United
Nations estimates elaborated by Worldometer.
The term "World Population" refers to the human population (the total number of humans currently
living) of the world.](https://image.slidesharecdn.com/theworldpopulationdistributiondensityandgrowth-200827065649/85/The-world-population-distribution-density-and-growth-5-320.jpg)