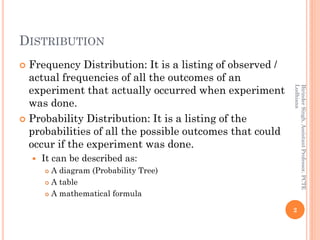
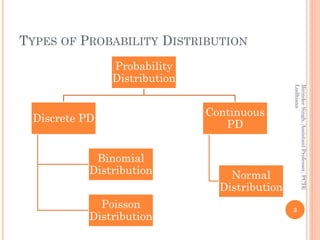
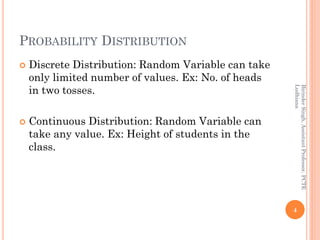
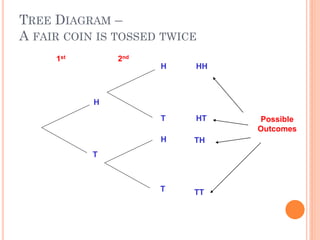
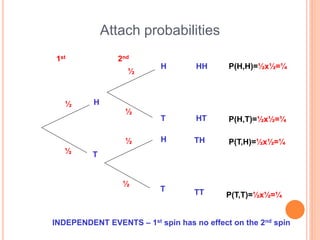
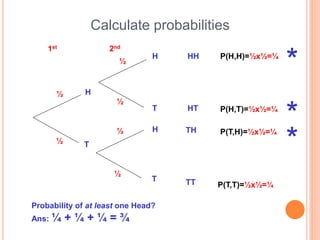
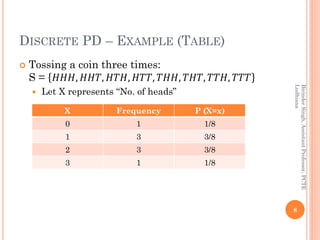
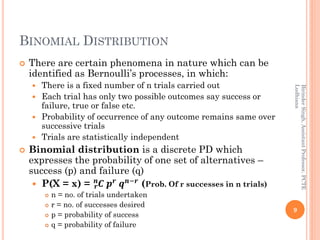
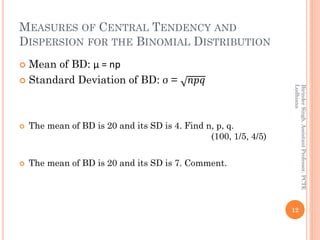
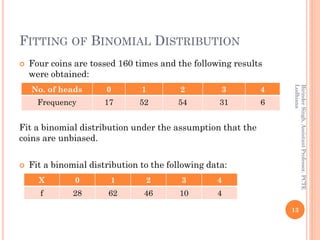
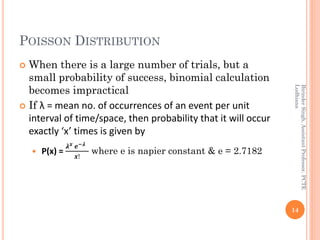
PROBABILITY DISTRIBUTIONS
BINOMIAL, POISSON, NORMAL
DISTRIBUTION
 Frequency Distribution: It is a listing of observed /
actual frequencies of all the outcomes of an
experiment that actually occurred when experiment
was done.
 Probability Distribution: It is a listing of the
probabilities of all the possible outcomes that could
occur if the experiment was done.
 It can be described as:
 A diagram (Probability Tree)
 A table
 A mathematical formula
2
BirinderSingh,AssistantProfessor,PCTE
Ludhiana
TYPES OF PROBABILITY DISTRIBUTION
Probability
Distribution
Discrete PD
Binomial
Distribution
Poisson
Distribution
Continuous
PD
Normal
Distribution
3
BirinderSingh,AssistantProfessor,PCTE
Ludhiana
PROBABILITY DISTRIBUTION
 Discrete Distribution: Random Variable can take
only limited number of values. Ex: No. of heads
in two tosses.
 Continuous Distribution: Random Variable can
take any value. Ex: Height of students in the
class.
4
BirinderSingh,AssistantProfessor,PCTE
Ludhiana
H
H
H
T
T
T
HH
HT
TH
TT
2nd1st
Possible
Outcomes
TREE DIAGRAM –
A FAIR COIN IS TOSSED TWICE
Attach probabilities
H
H
H
T
T
T
HH
HT
TH
TT
2nd1st
½
½
½
½
½
½
P(H,H)=½x½=¼
P(H,T)=½x½=¼
P(T,H)=½x½=¼
P(T,T)=½x½=¼
INDEPENDENT EVENTS – 1st spin has no effect on the 2nd spin
Calculate probabilities
H
H
H
T
T
T
HH
HT
TH
TT
2nd1st
½
½
½
½
½
½
P(H,H)=½x½=¼
P(H,T)=½x½=¼
P(T,H)=½x½=¼
P(T,T)=½x½=¼
Probability of at least one Head?
Ans: ¼ + ¼ + ¼ = ¾
*
*
*
DISCRETE PD – EXAMPLE (TABLE)
 Tossing a coin three times:
S = 𝐻𝐻𝐻, 𝐻𝐻𝑇, 𝐻𝑇𝐻, 𝐻𝑇𝑇, 𝑇𝐻𝐻, 𝑇𝐻𝑇, 𝑇𝑇𝐻, 𝑇𝑇𝑇
 Let X represents “No. of heads”
8
BirinderSingh,AssistantProfessor,PCTE
Ludhiana
X Frequency P (X=x)
0 1 1/8
1 3 3/8
2 3 3/8
3 1 1/8
BINOMIAL DISTRIBUTION
 There are certain phenomena in nature which can be
identified as Bernoulli’s processes, in which:
 There is a fixed number of n trials carried out
 Each trial has only two possible outcomes say success or
failure, true or false etc.
 Probability of occurrence of any outcome remains same over
successive trials
 Trials are statistically independent
 Binomial distribution is a discrete PD which
expresses the probability of one set of alternatives –
success (p) and failure (q)
 P(X = x) = 𝑪𝒓
𝒏
𝒑 𝒓
𝒒 𝒏−𝒓
(Prob. Of r successes in n trials)
 n = no. of trials undertaken
 r = no. of successes desired
 p = probability of success
 q = probability of failure
9
BirinderSingh,AssistantProfessor,PCTE
Ludhiana
PRACTICE QUESTIONS – BD
 Four coins are tossed simultaneously. What is the probability
of getting:
 No head 1/16
 No tail 1/16
 Two heads 3/8
 The probability of a bomb hitting a target is 1/5. Two bombs are
enough to destroy a bridge. If six bombs are fired at the bridge,
find the probability that the bridge is destroyed. (0.345)
 If 8 ships out of 10 ships arrive safely. Find the probability that
at least one would arrive safely out of 5 ships selected at
random. (0.999)
10
BirinderSingh,AssistantProfessor,PCTE
Ludhiana
PRACTICE QUESTIONS – BD
 A pair of dice is thrown 7 times. If getting a total of 7 is
considered as success, find the probability of getting:
 No success (5/6)7
 6 successes 35. (1/6)7
 At least 6 successes 36. (1/6)7
 Eight-tenths of the pumps were correctly filled. Find the
probability of getting exactly three of six pumps correctly filled.
(0.082)
11
BirinderSingh,AssistantProfessor,PCTE
Ludhiana
MEASURES OF CENTRAL TENDENCY AND
DISPERSION FOR THE BINOMIAL DISTRIBUTION
 Mean of BD: µ = np
 Standard Deviation of BD: σ = 𝑛𝑝𝑞
 The mean of BD is 20 and its SD is 4. Find n, p, q.
(100, 1/5, 4/5)
 The mean of BD is 20 and its SD is 7. Comment.
12
BirinderSingh,AssistantProfessor,PCTE
Ludhiana
FITTING OF BINOMIAL DISTRIBUTION
 Four coins are tossed 160 times and the following results
were obtained:
Fit a binomial distribution under the assumption that the
coins are unbiased.
 Fit a binomial distribution to the following data:
13
BirinderSingh,AssistantProfessor,PCTE
Ludhiana
No. of heads 0 1 2 3 4
Frequency 17 52 54 31 6
X 0 1 2 3 4
f 28 62 46 10 4
POISSON DISTRIBUTION
 When there is a large number of trials, but a
small probability of success, binomial calculation
becomes impractical
 If λ = mean no. of occurrences of an event per unit
interval of time/space, then probability that it will occur
exactly ‘x’ times is given by
 P(x) =
𝝀 𝒙 𝒆−𝝀
𝒙!
where e is napier constant & e = 2.7182
14
BirinderSingh,AssistantProfessor,PCTE
Ludhiana
PRACTICE PROBLEMS – POISSON
DISTRIBUTION
 On a road crossing, records show that on an average, 5 accidents
occur per month. What is the probability that 0, 1, 2, 3, 4, 5 accidents
occur in a month? (0.0067, 0.0335, 0.08425, 0.14042, 0.17552, 0.17552)
 In case, probability of greater than 3 accidents per month exceeds 0.7, then
road must be widened. Should the road be widened? (Yes)
 If on an average 2 calls arrive at a telephone switchboard per minute, what is
the probability that exactly 5 calls will arrive during a randomly selected 3
minute interval? (0.1606)
 It is given that 2% of the screws are defective. Use PD to find the probability
that a packet of 100 screws contains:
 No defective screws (0.135)
 One defective screw (0.270)
 Two or more defective screw (0.595) 15
BirinderSingh,AssistantProfessor,PCTE
Ludhiana
CHARACTERISTICS OF POISSON
DISTRIBUTION
 It is a discrete distribution
 Occurrences are statistically independent
 Mean no. of occurrences in a unit of time is
proportional to size of unit (if 5 in one year, 10 in 2
years etc.)
 Mean of PD is λ = np
 Standard Deviation of PD is 𝜆 = 𝑛𝑝
 It is always right skewed.
 PD is a good approximation to BD when n > or = 20
and p< or = 0.05
16
BirinderSingh,AssistantProfessor,PCTE
Ludhiana
NORMAL DISTRIBUTION
 It is a continuous PD i.e. random variable can take on any
value within a given range. Ex: Height, Weight, Marks etc.
 Developed by eighteenth century mathematician – astronomer
Karl Gauss, so also called Gaussian Distribution.
 It is symmetrical, unimodal (one peak).
 Since it is symmetrical, its mean, median and mode all
coincides i.e. all three are same.
 The tails are asymptotic to horizontal axis i.e. curve goes to
infinity without touching horizontal axis.
 X axis represents random variable like height, weight etc.
 Y axis represents its probability density function.
 Area under the curve tells the probability.
 The total area under the curve is 1 (or 100%)
 Mean = µ, SD = σ 17
BirinderSingh,AssistantProfessor,PCTE
Ludhiana
DEFINING A NORMAL DISTRIBUTION
 Only two parameters are considered: Mean &
Standard Deviation
 Same Mean, Different Standard Deviations
 Same SD, Different Means
 Different Mean & Different Standard Deviations
18
BirinderSingh,AssistantProfessor,PCTE
Ludhiana
AREA UNDER THE NORMAL CURVE
43210-1-2-3-4
0.00
0.10
0.20
0.30
0.40
Standard Normal Distribution
Standard Score (z)
.34
.135
.025
.50
68-95-99.7 RULE
68% of
the data
95.5% of the data
99.7% of the data
AREA UNDER THE CURVE
 The mean ± 1 standard deviation covers approx.
68% of the area under the curve
 The mean ± 2 standard deviation covers approx.
95.5% of the area under the curve
 The mean ± 3 standard deviation covers 99.7% of
the area under the curve
21
BirinderSingh,AssistantProfessor,PCTE
Ludhiana
STANDARD NORMAL PD
 In standard Normal PD, Mean = 0, SD = 1
 Z =
𝑥 − 𝜇
𝜎
 Z = No. of std. deviations from x to mean. Also called Z Score
 x = value of RV
22
BirinderSingh,AssistantProfessor,PCTE
Ludhiana
PRACTICE PROBLEMS – NORMAL
DISTRIBUTION
 Mean height of gurkhas is 147 cm with SD of 3 cm. What is
the probability of:
 Height being greater than 152 cm. 4.75%
 Height between 140 and 150 cm. 83.14%
 Mean demand of an oil is 1000 ltr per month with SD of 250
ltr.
 If 1200 ltrs are stocked, What is the satisfaction level? 78%
 For an assurance of 95%, what stock must be kept? 1411.25 ltr
 Nancy keeps bank balance on an average at Rs. 5000 with SD
of Rs. 1000. What is the probability that her account will have
balance of :
 Greater than Rs. 7000 0.0228
 Between Rs. 5000 and Rs. 6000
23
BirinderSingh,AssistantProfessor,PCTE
Ludhiana

Probability Distributions

  • 1.
  • 2.
    DISTRIBUTION  Frequency Distribution:It is a listing of observed / actual frequencies of all the outcomes of an experiment that actually occurred when experiment was done.  Probability Distribution: It is a listing of the probabilities of all the possible outcomes that could occur if the experiment was done.  It can be described as:  A diagram (Probability Tree)  A table  A mathematical formula 2 BirinderSingh,AssistantProfessor,PCTE Ludhiana
  • 3.
    TYPES OF PROBABILITYDISTRIBUTION Probability Distribution Discrete PD Binomial Distribution Poisson Distribution Continuous PD Normal Distribution 3 BirinderSingh,AssistantProfessor,PCTE Ludhiana
  • 4.
    PROBABILITY DISTRIBUTION  DiscreteDistribution: Random Variable can take only limited number of values. Ex: No. of heads in two tosses.  Continuous Distribution: Random Variable can take any value. Ex: Height of students in the class. 4 BirinderSingh,AssistantProfessor,PCTE Ludhiana
  • 5.
  • 6.
  • 7.
  • 8.
    DISCRETE PD –EXAMPLE (TABLE)  Tossing a coin three times: S = 𝐻𝐻𝐻, 𝐻𝐻𝑇, 𝐻𝑇𝐻, 𝐻𝑇𝑇, 𝑇𝐻𝐻, 𝑇𝐻𝑇, 𝑇𝑇𝐻, 𝑇𝑇𝑇  Let X represents “No. of heads” 8 BirinderSingh,AssistantProfessor,PCTE Ludhiana X Frequency P (X=x) 0 1 1/8 1 3 3/8 2 3 3/8 3 1 1/8
  • 9.
    BINOMIAL DISTRIBUTION  Thereare certain phenomena in nature which can be identified as Bernoulli’s processes, in which:  There is a fixed number of n trials carried out  Each trial has only two possible outcomes say success or failure, true or false etc.  Probability of occurrence of any outcome remains same over successive trials  Trials are statistically independent  Binomial distribution is a discrete PD which expresses the probability of one set of alternatives – success (p) and failure (q)  P(X = x) = 𝑪𝒓 𝒏 𝒑 𝒓 𝒒 𝒏−𝒓 (Prob. Of r successes in n trials)  n = no. of trials undertaken  r = no. of successes desired  p = probability of success  q = probability of failure 9 BirinderSingh,AssistantProfessor,PCTE Ludhiana
  • 10.
    PRACTICE QUESTIONS –BD  Four coins are tossed simultaneously. What is the probability of getting:  No head 1/16  No tail 1/16  Two heads 3/8  The probability of a bomb hitting a target is 1/5. Two bombs are enough to destroy a bridge. If six bombs are fired at the bridge, find the probability that the bridge is destroyed. (0.345)  If 8 ships out of 10 ships arrive safely. Find the probability that at least one would arrive safely out of 5 ships selected at random. (0.999) 10 BirinderSingh,AssistantProfessor,PCTE Ludhiana
  • 11.
    PRACTICE QUESTIONS –BD  A pair of dice is thrown 7 times. If getting a total of 7 is considered as success, find the probability of getting:  No success (5/6)7  6 successes 35. (1/6)7  At least 6 successes 36. (1/6)7  Eight-tenths of the pumps were correctly filled. Find the probability of getting exactly three of six pumps correctly filled. (0.082) 11 BirinderSingh,AssistantProfessor,PCTE Ludhiana
  • 12.
    MEASURES OF CENTRALTENDENCY AND DISPERSION FOR THE BINOMIAL DISTRIBUTION  Mean of BD: µ = np  Standard Deviation of BD: σ = 𝑛𝑝𝑞  The mean of BD is 20 and its SD is 4. Find n, p, q. (100, 1/5, 4/5)  The mean of BD is 20 and its SD is 7. Comment. 12 BirinderSingh,AssistantProfessor,PCTE Ludhiana
  • 13.
    FITTING OF BINOMIALDISTRIBUTION  Four coins are tossed 160 times and the following results were obtained: Fit a binomial distribution under the assumption that the coins are unbiased.  Fit a binomial distribution to the following data: 13 BirinderSingh,AssistantProfessor,PCTE Ludhiana No. of heads 0 1 2 3 4 Frequency 17 52 54 31 6 X 0 1 2 3 4 f 28 62 46 10 4
  • 14.
    POISSON DISTRIBUTION  Whenthere is a large number of trials, but a small probability of success, binomial calculation becomes impractical  If λ = mean no. of occurrences of an event per unit interval of time/space, then probability that it will occur exactly ‘x’ times is given by  P(x) = 𝝀 𝒙 𝒆−𝝀 𝒙! where e is napier constant & e = 2.7182 14 BirinderSingh,AssistantProfessor,PCTE Ludhiana
  • 15.
    PRACTICE PROBLEMS –POISSON DISTRIBUTION  On a road crossing, records show that on an average, 5 accidents occur per month. What is the probability that 0, 1, 2, 3, 4, 5 accidents occur in a month? (0.0067, 0.0335, 0.08425, 0.14042, 0.17552, 0.17552)  In case, probability of greater than 3 accidents per month exceeds 0.7, then road must be widened. Should the road be widened? (Yes)  If on an average 2 calls arrive at a telephone switchboard per minute, what is the probability that exactly 5 calls will arrive during a randomly selected 3 minute interval? (0.1606)  It is given that 2% of the screws are defective. Use PD to find the probability that a packet of 100 screws contains:  No defective screws (0.135)  One defective screw (0.270)  Two or more defective screw (0.595) 15 BirinderSingh,AssistantProfessor,PCTE Ludhiana
  • 16.
    CHARACTERISTICS OF POISSON DISTRIBUTION It is a discrete distribution  Occurrences are statistically independent  Mean no. of occurrences in a unit of time is proportional to size of unit (if 5 in one year, 10 in 2 years etc.)  Mean of PD is λ = np  Standard Deviation of PD is 𝜆 = 𝑛𝑝  It is always right skewed.  PD is a good approximation to BD when n > or = 20 and p< or = 0.05 16 BirinderSingh,AssistantProfessor,PCTE Ludhiana
  • 17.
    NORMAL DISTRIBUTION  Itis a continuous PD i.e. random variable can take on any value within a given range. Ex: Height, Weight, Marks etc.  Developed by eighteenth century mathematician – astronomer Karl Gauss, so also called Gaussian Distribution.  It is symmetrical, unimodal (one peak).  Since it is symmetrical, its mean, median and mode all coincides i.e. all three are same.  The tails are asymptotic to horizontal axis i.e. curve goes to infinity without touching horizontal axis.  X axis represents random variable like height, weight etc.  Y axis represents its probability density function.  Area under the curve tells the probability.  The total area under the curve is 1 (or 100%)  Mean = µ, SD = σ 17 BirinderSingh,AssistantProfessor,PCTE Ludhiana
  • 18.
    DEFINING A NORMALDISTRIBUTION  Only two parameters are considered: Mean & Standard Deviation  Same Mean, Different Standard Deviations  Same SD, Different Means  Different Mean & Different Standard Deviations 18 BirinderSingh,AssistantProfessor,PCTE Ludhiana
  • 19.
    AREA UNDER THENORMAL CURVE 43210-1-2-3-4 0.00 0.10 0.20 0.30 0.40 Standard Normal Distribution Standard Score (z) .34 .135 .025 .50
  • 20.
    68-95-99.7 RULE 68% of thedata 95.5% of the data 99.7% of the data
  • 21.
    AREA UNDER THECURVE  The mean ± 1 standard deviation covers approx. 68% of the area under the curve  The mean ± 2 standard deviation covers approx. 95.5% of the area under the curve  The mean ± 3 standard deviation covers 99.7% of the area under the curve 21 BirinderSingh,AssistantProfessor,PCTE Ludhiana
  • 22.
    STANDARD NORMAL PD In standard Normal PD, Mean = 0, SD = 1  Z = 𝑥 − 𝜇 𝜎  Z = No. of std. deviations from x to mean. Also called Z Score  x = value of RV 22 BirinderSingh,AssistantProfessor,PCTE Ludhiana
  • 23.
    PRACTICE PROBLEMS –NORMAL DISTRIBUTION  Mean height of gurkhas is 147 cm with SD of 3 cm. What is the probability of:  Height being greater than 152 cm. 4.75%  Height between 140 and 150 cm. 83.14%  Mean demand of an oil is 1000 ltr per month with SD of 250 ltr.  If 1200 ltrs are stocked, What is the satisfaction level? 78%  For an assurance of 95%, what stock must be kept? 1411.25 ltr  Nancy keeps bank balance on an average at Rs. 5000 with SD of Rs. 1000. What is the probability that her account will have balance of :  Greater than Rs. 7000 0.0228  Between Rs. 5000 and Rs. 6000 23 BirinderSingh,AssistantProfessor,PCTE Ludhiana