Download to read offline


![CONT….
b) At least two bulbs are defective:
Probability that at least two bulb are defective means 𝑟 = 2,3,4,5 … .100
As, Total Probability = 1.
Also, 𝑃 𝑥 ≥ 2 = [𝑃 𝑥 = 2 + 𝑃 𝑥 = 3 + ⋯ + 𝑃(𝑥 = 100]
𝑃 𝑥 ≥ 2 = 1 − [𝑃 𝑥 = 0 + 𝑃(𝑥 = 1)]
𝑃 𝑥 ≥ 2 = 1 − [
𝑒−220
0!
+
𝑒−221
1!
] = 0.541
Probability that at least two bulbs are defective is 0.541](https://image.slidesharecdn.com/poissonsdistribution-200429065332/75/Poisson-s-distribution-6-2048.jpg)

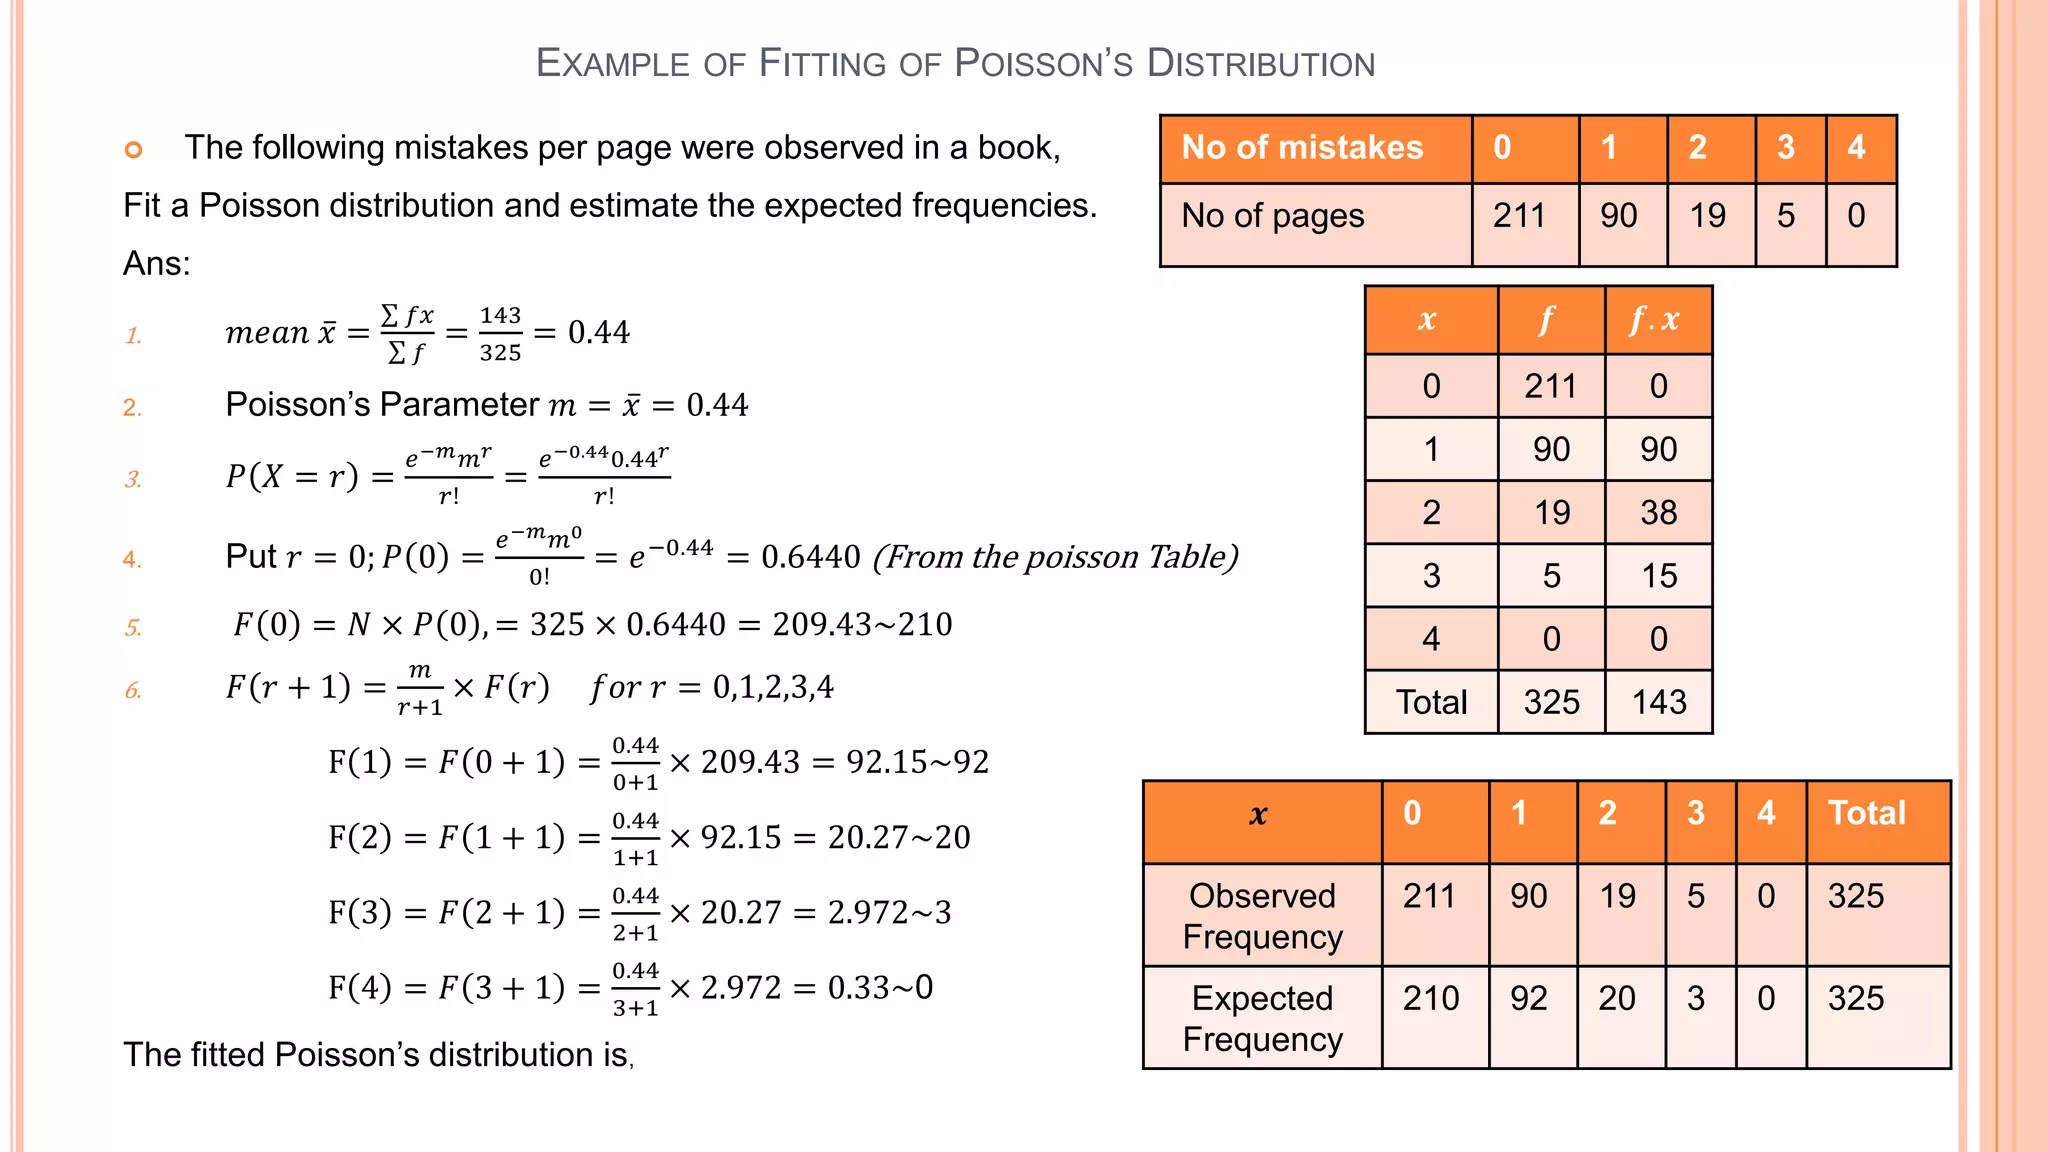


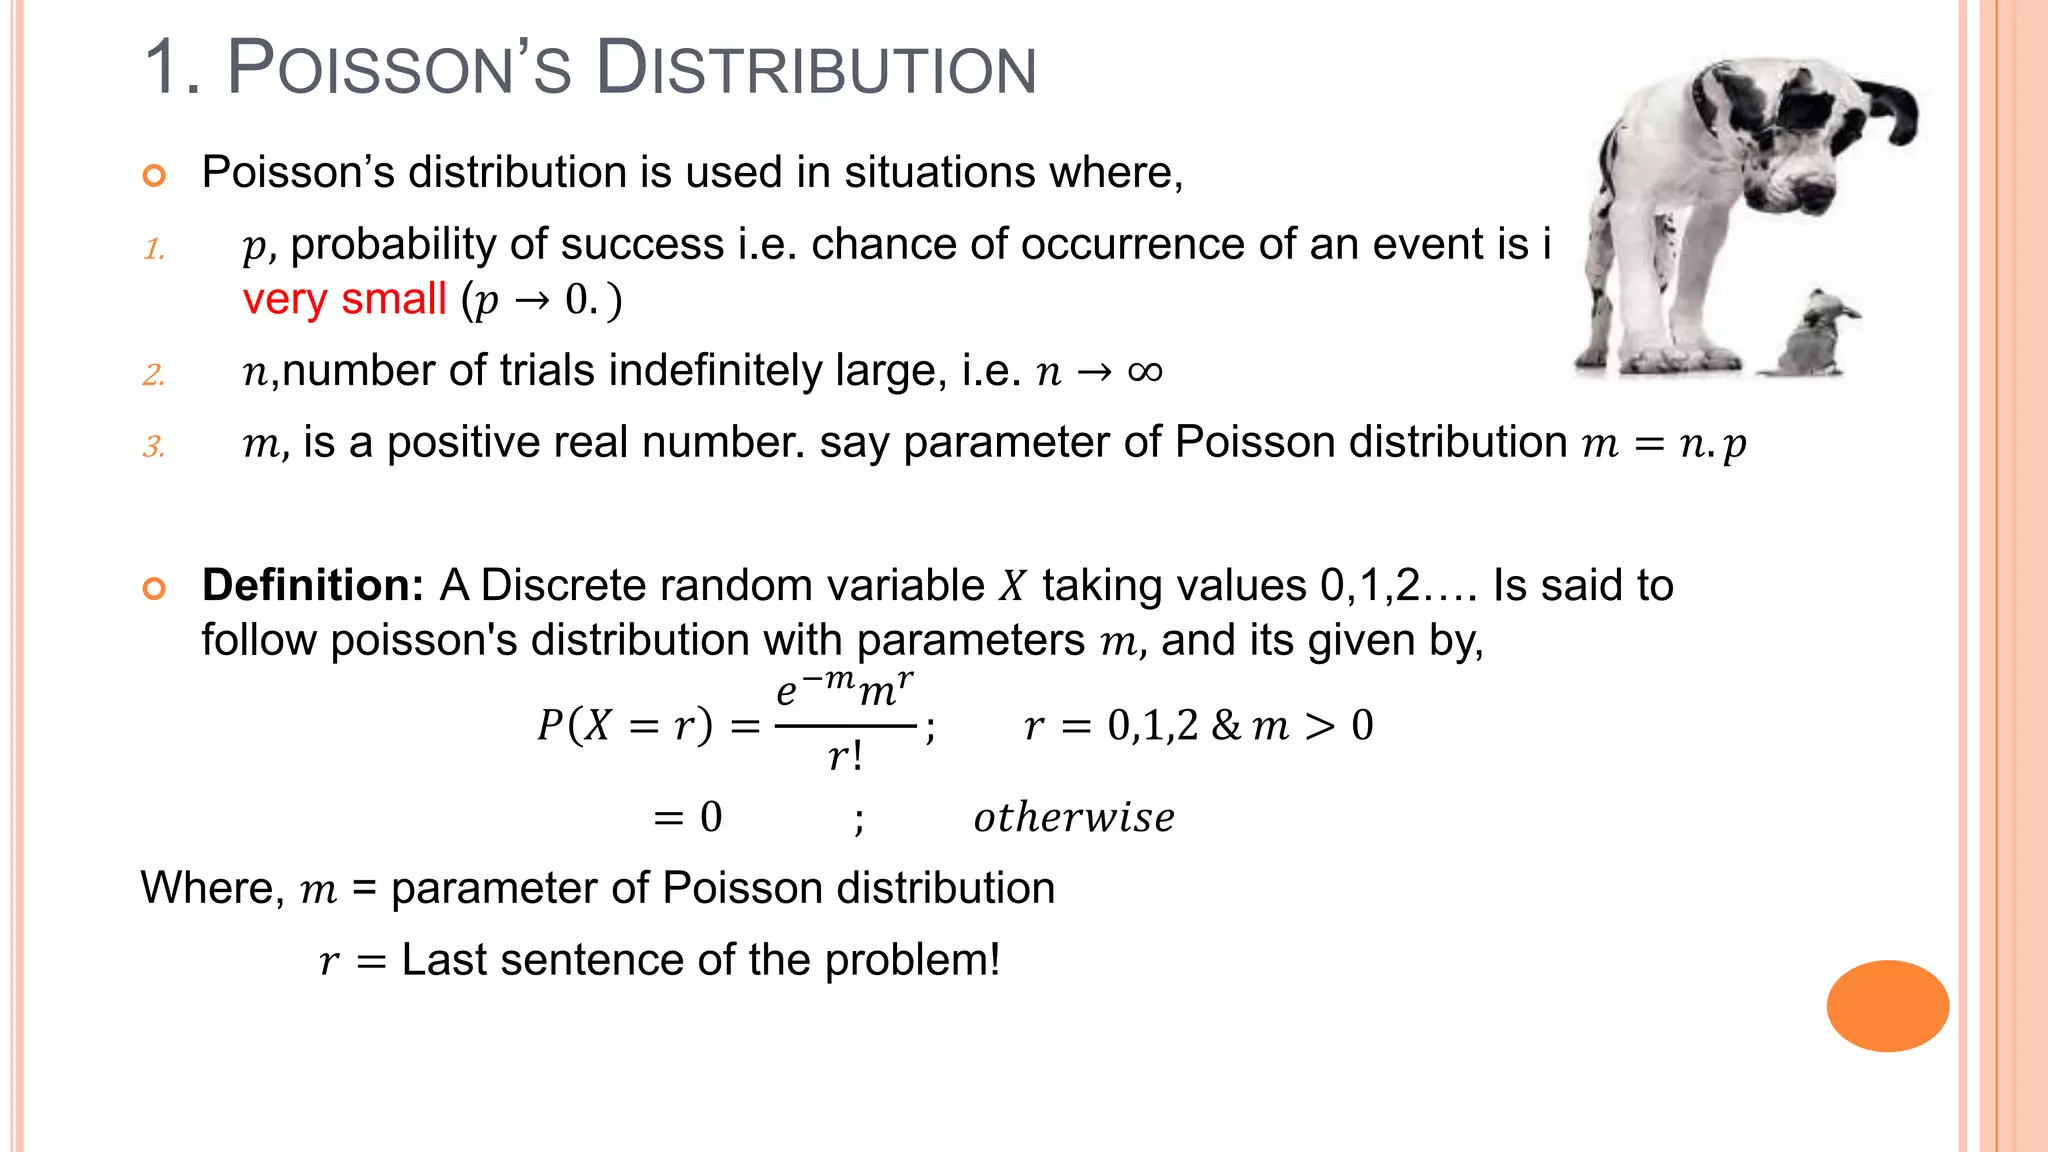
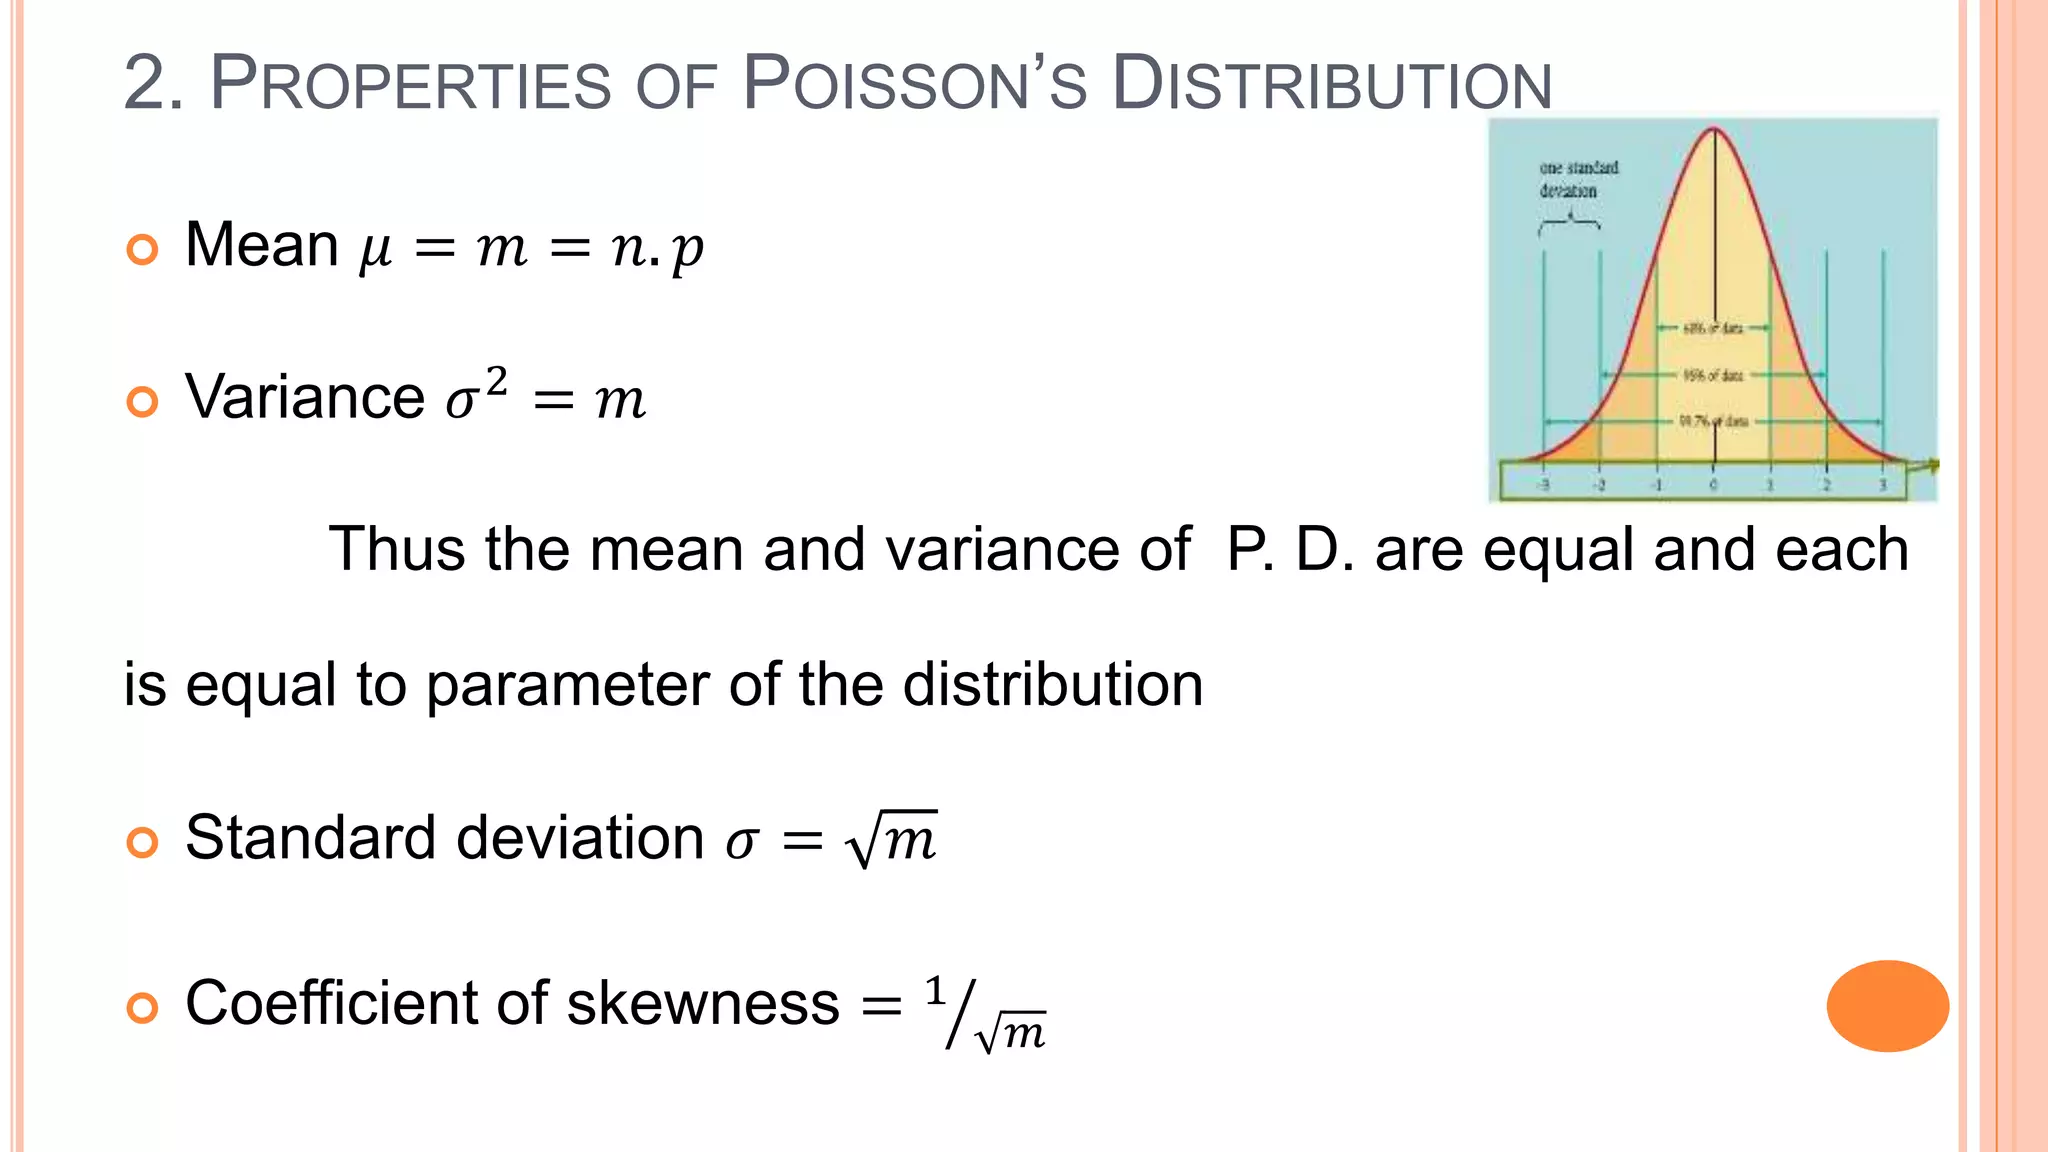
The document discusses Poisson's distribution, outlining its definition, properties, and applications in various fields. It provides a mathematical formulation for the distribution, examples of its usage in probability calculations, and a method for fitting the distribution to observed data. Additionally, it highlights real-world scenarios in which Poisson's distribution is applicable, such as counting defective items and analyzing event occurrences.