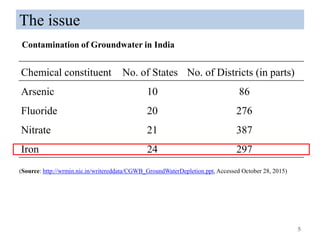
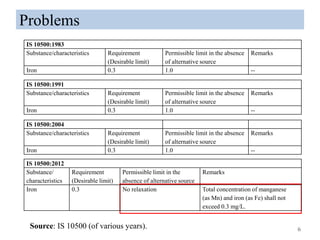
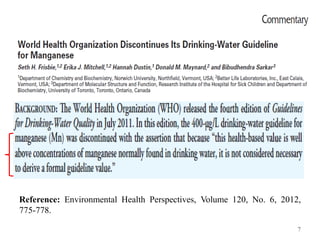
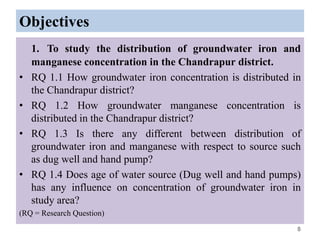
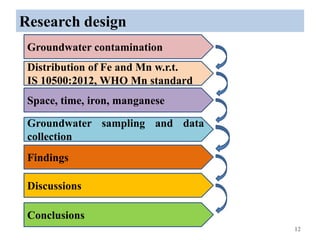
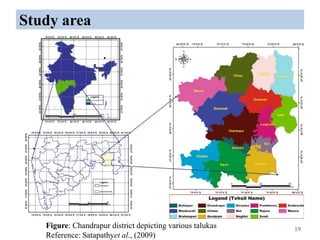
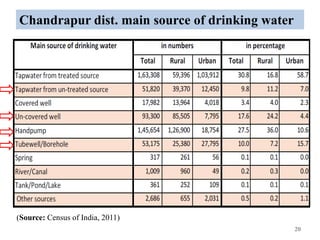
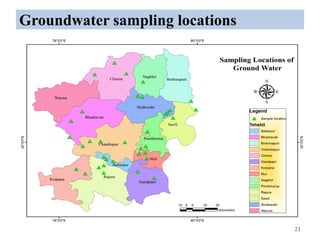
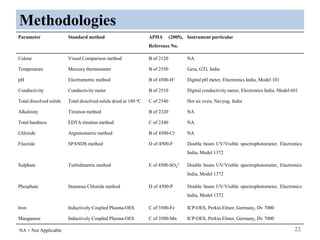
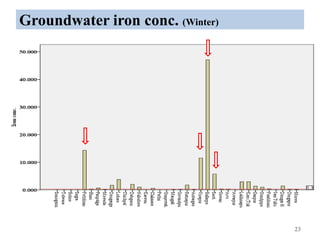
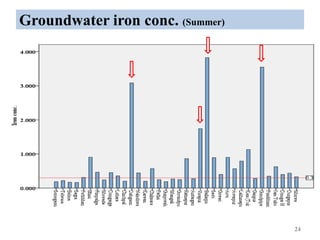
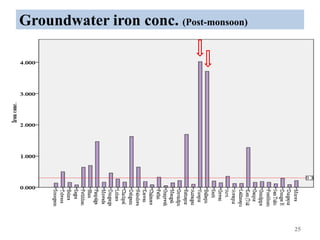
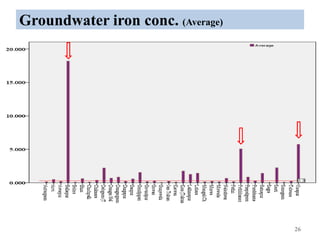
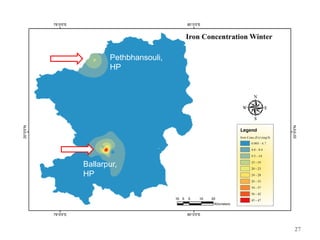
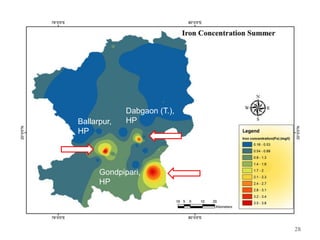
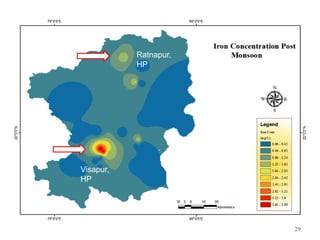
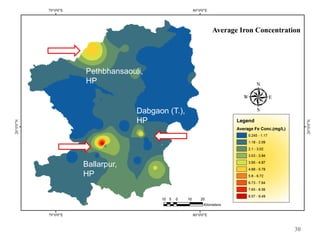
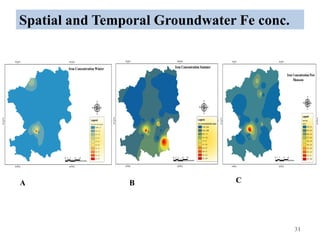
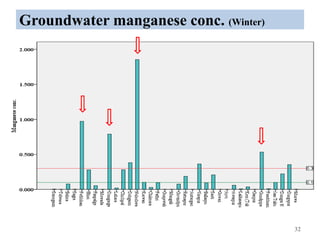
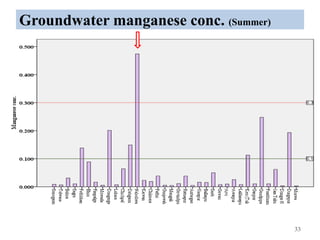
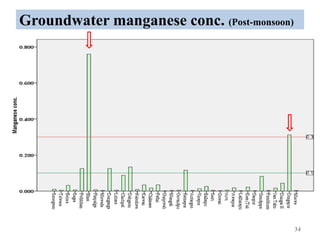
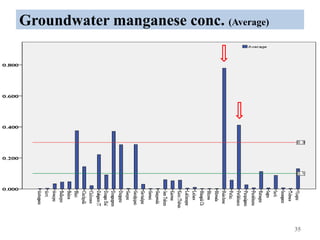
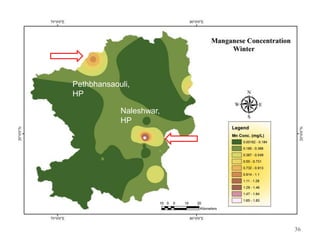
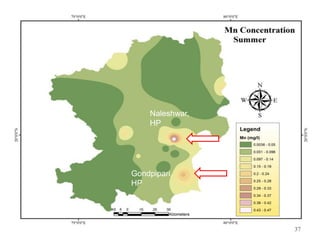
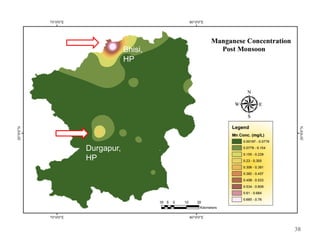
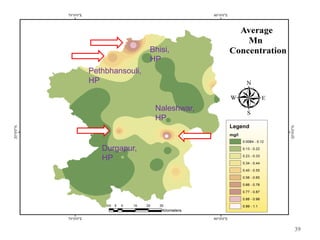
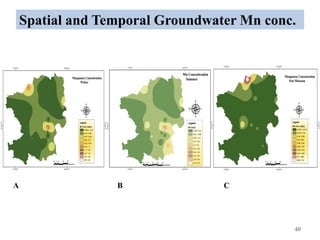
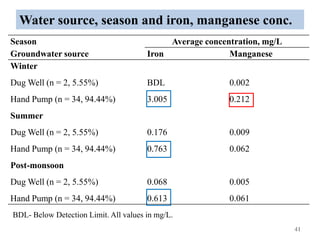
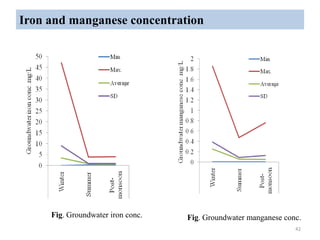
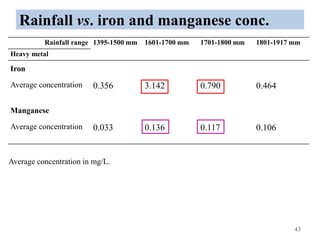
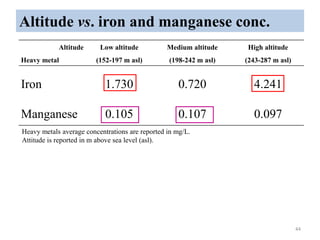
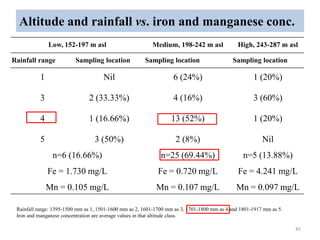
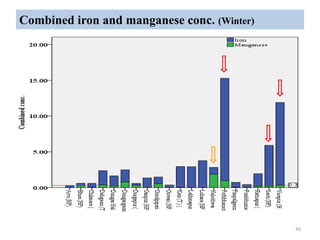
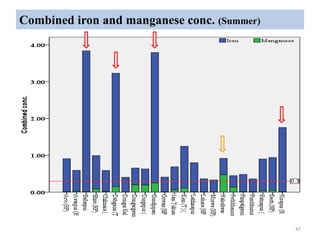
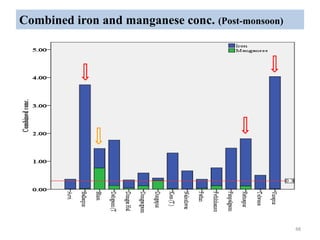
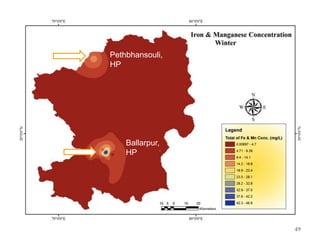
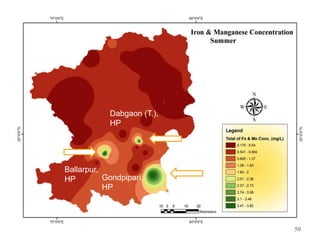
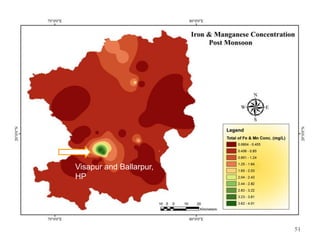
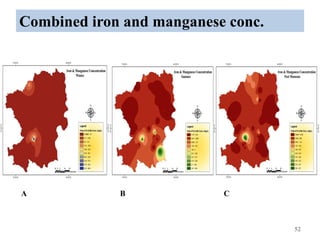
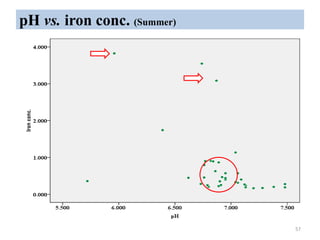
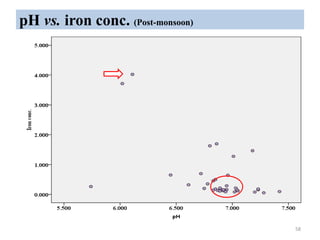
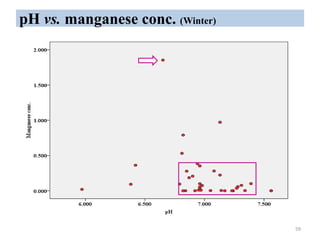
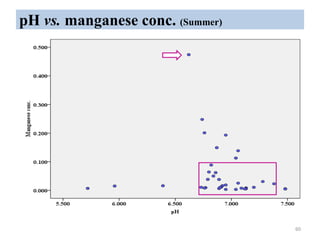
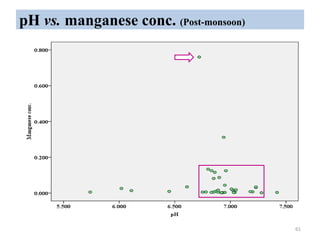
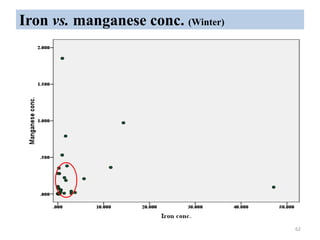
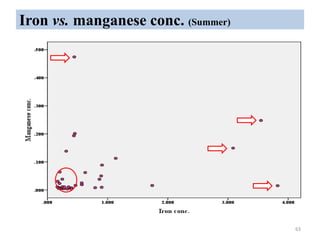
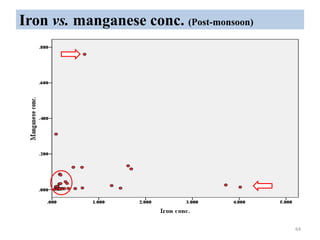
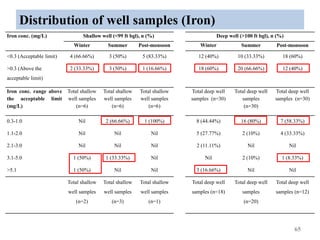
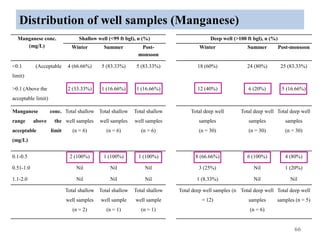
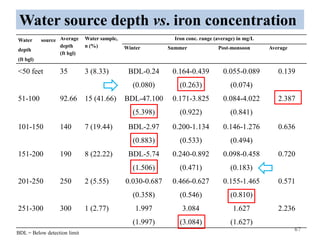
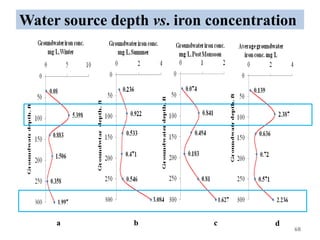
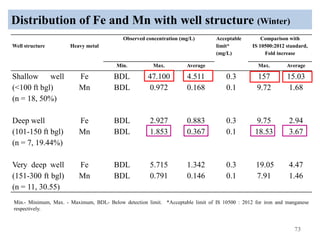
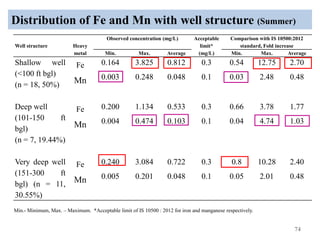
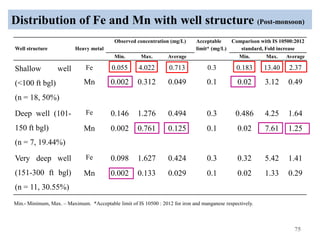
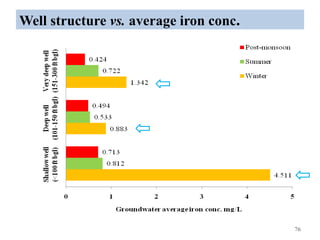
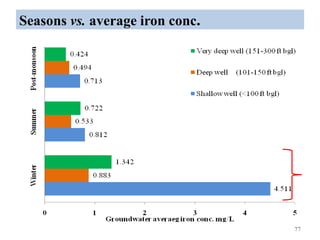
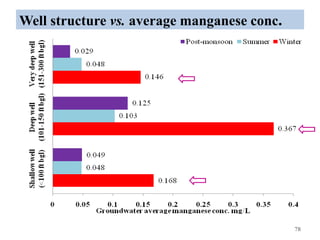
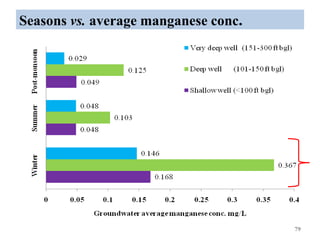
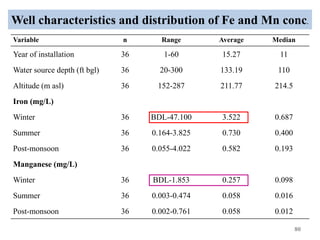
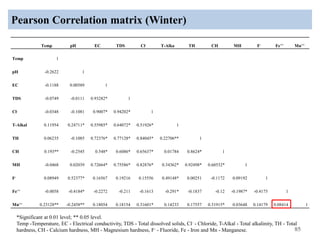
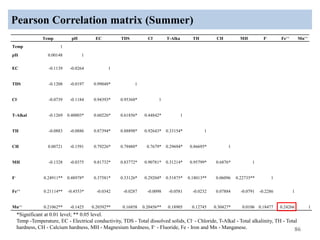
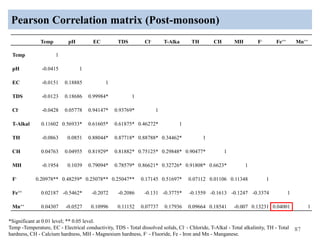
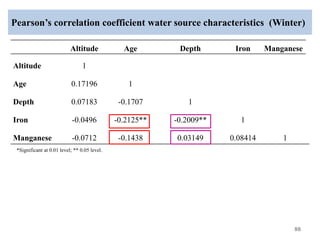
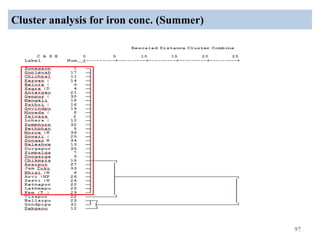
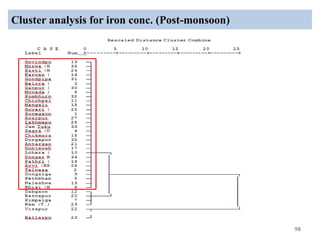
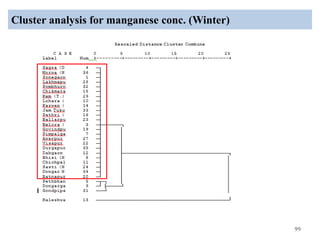
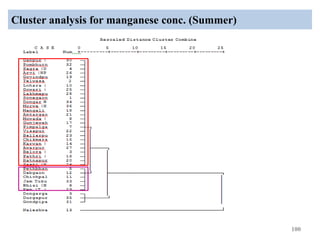
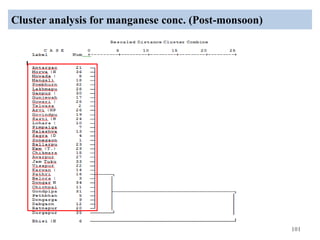
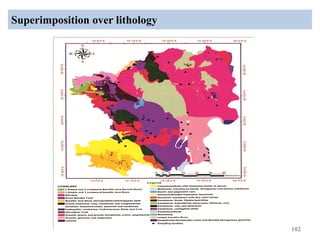
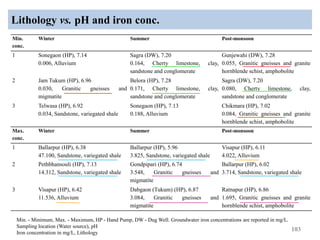
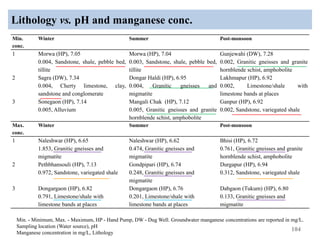
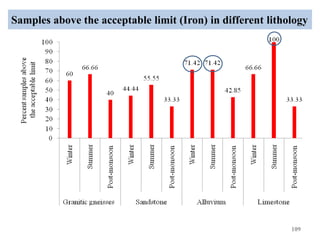
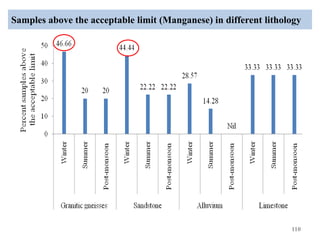
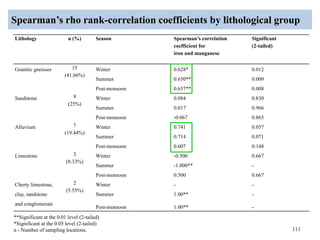
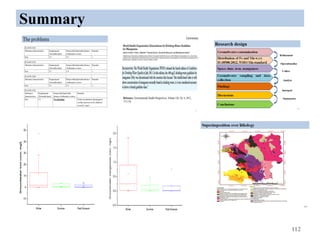
The thesis examines the spatial and temporal distribution of iron and manganese in groundwater in Chandrapur District, Maharashtra. The study aims to understand the distribution of iron and manganese with respect to source type, depth, season and other factors. It also aims to identify plausible sources of iron and manganese in groundwater. The methodology involves literature review, sampling groundwater from identified locations, analyzing iron and manganese concentrations, and interpreting the data. Key findings show seasonal and spatial variations in iron and manganese levels, with some sources exceeding Indian drinking water standards. Depth, rainfall, and altitude also influence concentration levels. The study helps characterize groundwater quality in the district and identify sources of contamination.
•Initial (reconnaissance) assessment….
♦Basic knowledge of geological and environmental conditions
♦Review of previous investigation results
♦Measurements of water levels
♦Sampling & preliminary assessment of water quality
This document provides an overview of various groundwater exploration methods, including surface and subsurface techniques. Surface methods involve minimal facilities and include geomorphological analysis of landforms, geological and structural mapping, soil and vegetation analysis, remote sensing, and surface geophysical methods like electrical resistivity and seismic surveys. Subsurface methods like borehole logging and test drilling provide direct observations but are more expensive. Together, a multi-method approach can be used to explore groundwater resources and locate potential zones for development.
identification of ground water potential zones using gis and remote sensingtp jayamohan
This document summarizes a study that mapped groundwater potential zones in the Muvattupuzha block of Kerala, India using GIS and remote sensing. Key factors like geology, geomorphology, lineaments, drainage density, rainfall, land use, slope and soils were analyzed as layers in GIS. Weighted overlay analysis was used to delineate excellent, moderate and poor groundwater potential zones. Validation with field data found good correlation. The study aims to aid groundwater development and management to address water scarcity in the region.
Application of RS and GIS in Groundwater Prospects ZonationVishwanath Awati
This document discusses using remote sensing and GIS techniques to map groundwater prospects zones. It presents a case study of applying these methods in Bata Valley, Himachal Pradesh, India. The methodology involves developing thematic maps of factors like geology, land use, and water levels. These maps are then overlaid and analyzed in GIS to identify zones of good, moderate, or poor groundwater potential. The study concludes these techniques can effectively map groundwater prospects and inform management plans.
This document provides an introduction and overview of groundwater modeling. It discusses why groundwater modeling is needed for effective groundwater management. It outlines the modeling process, including developing a conceptual model, selecting governing equations, model design, calibration, validation, and using the model for prediction. It describes different types of mathematical models, including analytical, finite difference, and finite element models. It emphasizes that a modeling protocol should establish the modeling purpose and ensure the conceptual model adequately represents the system behavior. The document stresses the importance of calibration, verification, and sensitivity analysis to evaluate a model's ability to reproduce measured conditions and the effects of uncertainty.
APPLICATIONS OF REMOTE SENSING AND GIS IN WATERSHED MANAGEMENTSriram Chakravarthy
This document discusses watershed management and the role of remote sensing and GIS applications. It begins with defining a watershed and the watershed approach. It then discusses watershed characterization, prioritization, development activities, and monitoring. Remote sensing provides synoptic data to map natural resources within watersheds. GIS is used to integrate spatial data for watershed delineation and analysis. The goal of watershed management is sustainable development through activities like water conservation, afforestation, and improving livelihoods.
Spatial analysis of groundwater quality using GIS systemPavan Grandhi
To analyze systematically for physio-chemical parameters such as pH, Total Hardness, Electrical Conductivity and Chemical Oxygen Demand (COD).
Generate Ground Water Quality Map based in Jnanabharathi ward no.129, Bangalore, Karnataka state, India
Ground water Arsenic Contamination in IndiaDr Sayan Das
Extent, related research and remedication meassures
Chemistry of arsenic, Use of arsenic, reference value , Oxidation method, Ion exchange method, Membrane method
This document outlines groundwater management strategies for municipal officials. It notes that while the region receives abundant precipitation, local overuse and water quality problems are still possible if left unmanaged. It then describes a model groundwater protection ordinance that has been adopted by several Dutchess County towns. The ordinance establishes development standards and best practices to safeguard both groundwater quantity and quality. These include regulating certain land uses, prohibiting new underground fuel tanks, guidance for cluster subdivisions, and more rigorous pumping test requirements. The model aims to preserve aquifer and stream flows while also addressing issues like pharmaceutical contamination and climate change impacts. Towns can adopt this law or planning boards can apply its guidance under the State Environmental Quality Review Act.
This presentation deals with the recent advancement in the field of ground water sampling and analysis technique and water born survey as well as Indian scenario to interpret.
Remote sensing application in monitoring and management of soil, water and ai...Jayvir Solanki
Remote sensing uses satellite or aircraft sensors to monitor the environment without direct contact. It can monitor soil, water, and air pollution over large areas in a timely manner. Satellite imagery is used to monitor air quality by detecting pollutants and aerosols. Water quality is monitored by measuring changes in the spectral signature of surface water caused by substances like sediments, algae, and thermal releases. Remote sensing provides synoptic views of large areas but has limitations like spectral interference and inability to distinguish low concentrations of pollutants. It is a useful tool for environmental monitoring when used in conjunction with field data.
IDENTIFICATION OF GROUNDWATER POTENTIAL ZONES USING REMOTE SENSING AND GEOGRA...IAEME Publication
The document describes a study that used remote sensing and GIS techniques to identify groundwater potential zones in the Konakaluva sub-basin of India. Various thematic maps were generated from satellite imagery and other data sources. These maps were overlaid and assigned weights based on their influence on groundwater occurrence. Soil data was given the highest weight of 40%, while land use/cover and drainage density were also significant at 25% and 10%, respectively. An integrated groundwater potential zones map was produced that classified areas as very good, good, fair, moderate or poor potential zones based on the overlay analysis. The results can help with better planning and management of groundwater resources in the study area.
Groundwater pollution occurs when pollutants make their way into groundwater and contaminate it. A pollutant plume spreads through an aquifer, intersecting with groundwater wells or daylighting into surface water. Pollution can come from septic systems, landfills, wastewater treatment plants, petrol stations, agriculture, and naturally occurring contaminants. Protecting groundwater requires preventing pollution through monitoring aquifers and landfills, replacing old fuel tanks, and strictly regulating toxic waste disposal.
The document discusses hydraulic conductivity, which measures the ability of a material like soil or rock to transmit fluids through pores and fractures under an applied hydraulic gradient. It describes hydraulic conductivity as being important for calculating groundwater movement rates and outlines experimental and empirical methods for determining it in the field or laboratory, such as constant head tests, falling head tests, or correlations with soil properties. Hydraulic conductivity is the constant in Darcy's Law and is defined as the volume of water that will move through a porous medium per unit time under a unit hydraulic gradient through a unit area measured perpendicular to flow.
Remote sensing and GIS techniques can contribute significantly to groundwater modeling efforts. Remote sensing provides spatial data on land cover, vegetation, rainfall, and terrain that are important model inputs. GIS allows integration of diverse data layers, conceptualization of recharge/discharge areas, and output visualization. However, remote sensing has limitations, such as an inability to directly measure groundwater levels or recharge. Overall, combining remote sensing, GIS, and field data can improve conceptual models and produce more accurate modeling results for groundwater management.
The document provides an outline for a presentation on the SWAT (Soil and Water Assessment Tool) hydrological model. It begins with an introduction to hydrological modeling and the development and utilities of the SWAT model. It describes the data requirements, model framework, and step-by-step procedure to run the model. A case study applying the SWAT model to the Simly Dam watershed in Pakistan is summarized. The limitations and future developments of the SWAT model are briefly discussed, followed by references.
This document discusses the importance of groundwater regime monitoring for groundwater management. It defines groundwater regime monitoring as collecting water level measurements from observation wells at regular time intervals to provide quantitative and qualitative information about groundwater. The key points are:
1) Groundwater monitoring is required to understand changes in groundwater quantity and quality over time due to slow hydrologic processes, and to design effective groundwater management programs.
2) A monitoring network is established with representative wells measured for water levels and quality quarterly.
3) Water level and quality data are analyzed statistically and spatially to identify trends and relationships helping groundwater management.
4) Challenges include data loss, high costs, and difficulty
The document discusses how topographic maps in India are organized and identified using a hierarchical system of map sheets with different scales. Topographic maps are divided into million sheet sections at 1:1,000,000 scale, degree sheets at 1:250,000 scale, toposheets at 1:50,000 scale, and further subdivided toposheets at 1:25,000 scale that are identified by letters and numbers corresponding to their location and scale. This system allows precise identification of location for any place shown on topographic maps in India.
Heavy metal pollution in soil and its mitigation aspect by Dr. Tarik MitranDr. Tarik Mitran
Heavy metal pollution in soil is a serious problem. Some key points:
- Heavy metals like lead, cadmium, arsenic, chromium, and mercury are toxic even in small amounts and can accumulate in the food chain.
- Sources of heavy metal pollution include industrial, agricultural, and mining activities which release these metals into the environment.
- Heavy metals can be taken up by plants and crops irrigated with contaminated water, accumulating in plant tissues and eventually entering the food chain. This poses risks to human and animal health.
- Remediating contaminated soils requires understanding the chemical processes by which heavy metals move and change form in the soil-water-air system over time. Mitigation strategies aim to reduce
The document is a project report presentation on assessing groundwater quality in Raichur Taluk, Karnataka, India. It includes sections on introduction, literature review, study area and data collection, water quality assessment parameters, and conclusions. 21 sampling locations in and around Raichur Taluk were tested for various water quality parameters including pH, turbidity, electrical conductivity, total dissolved solids, total hardness, calcium hardness, magnesium hardness, alkalinity, fluoride, sulphate, chloride, and acidity. The results found that most parameters were within acceptable limits according to drinking water standards, however some locations had higher levels of parameters like fluoride, sulphate and chloride.
The document discusses soil sampling procedures and methods. It describes different types of soil sampling including disturbed sampling, undisturbed sampling, random sampling, grid sampling, zone sampling, and topographic/geographic unit sampling. It provides details on sampling depths and tools for different field types such as vegetables, field crops, and orchards. Finally, it lists common soil sampling tools including shovels, augers, split-spoon samplers, and shelby tube samplers.
Water quality mapping for solapur district using gisadsulprashantr
The document outlines a GIS project to map water quality in Solapur District, India. It discusses collecting groundwater quality data from 2007-2009, calculating a Water Quality Index (WQI) based on parameters like pH, hardness, nitrates, and mapping the results in a GIS. The methodology includes georeferencing maps, creating shapefiles, entering attribute data, performing spatial queries to analyze tehsils with high or low nitrates, and generating output maps and charts of WQI, nitrates, and water quality classifications. The results found one tehsil had excellent water quality based on WQI and that agricultural runoff is a major contributor to nitrate contamination.
This document discusses the use of geographic information systems (GIS) in water resource management and assessment. It provides examples of GIS applications in watershed management, groundwater assessment, flood management, and water quality studies. It then describes a case study that developed a GIS-based decision support system to assess watershed runoff in the Kk3 Macro Watershed in India. Key steps included delineating sub-watersheds, creating soil and land use maps, determining hydrologic response units, computing runoff, and generating thematic runoff maps. The system allows users to update rainfall data and evaluate variations in spatial runoff distribution over time.
Surface Water modelling using Remote SensingArk Arjun
1) The document discusses remote sensing and runoff estimation using the SCS curve number method. Remote sensing involves obtaining information about objects through non-contact sensors.
2) Runoff estimation is the first step in water management. The SCS-CN method estimates runoff as a function of land use, soil type, and rainfall.
3) The study area's topographic maps, rainfall data, land use maps, and soil data were collected and used to classify land cover, model rainfall-runoff, and estimate runoff volume using the SCS-CN method.
This document summarizes a study assessing the surface water quality of Perumbakkam Lake in Kanchipuram district, South India using Geographic Information Systems (GIS). 15 water samples were collected from locations around the lake and analyzed for physicochemical parameters like pH, alkalinity, hardness, chlorides, TDS, fluoride, iron, and ammonia. The results were mapped spatially using GIS to analyze the spatial variation in water quality. Most parameters were within permissible limits except for high TDS levels at some locations, possibly due to industrial and domestic waste discharge. The study aims to help monitor water quality and identify sources of pollution impacting the lake.
Impact of Climate Change on Groundwater ResourcesC. P. Kumar
This document summarizes the impact of climate change on groundwater resources. It discusses how climate change can affect factors like precipitation, temperature, and evapotranspiration, which then impact groundwater recharge and levels. Higher temperatures and variability in rainfall from climate change could mean more fluctuations in groundwater levels and potential saline intrusion in coastal aquifers. Quantifying the full impact on groundwater requires downscaling climate models and coupling them with hydrological models to estimate changes in groundwater recharge over time. Key concerns are potential decreases in groundwater supplies and quality issues, as groundwater serves as a major global source of potable water.
Impact of Iron and Steel Industry on Ground Water Quality of Tungabhadra Rive...IJARIIT
Bellary district has 25 % of India's Iron ore reserves and is well known for its rich iron and manganese ore
reserves. Iron ore deposits in Bellary district are widespread and have been a backbone to industrial development in the region.
The environmental impact of large scale mining activities includes soil erosion, formation of sinkholes, loss of biodiversity,
and contamination of soil, groundwater and surface water by chemicals from mining processes.In this paper, efforts have been
made to assess the quality of Tunga - Bhadra river water extensive survey and laboratory analysis which would give the
information about ‘Impacts on reservoir water quality’ due to the Iron and steel industry. Also an attempt has made for
controlling the groundwater pollution, which would serve as a basis to evolve suitable management strategy for the District.
Therefore there is a significant changes in values of different parameters of ground water sources indicate the influence of
industrial wastes on ground water.
This study examined water quality in a small residential wetland in Spokane, Washington. Water samples were taken from sites along the drainage gradient leading to the wetland and within the wetland. Concentrations of ions like magnesium and sodium increased from upstream to within the wetland, likely due to evapoconcentration. While concentrations of major ions accumulated in the wetland, concentrations of potential heavy metals like lead and zinc remained below EPA aquatic life standards. The results indicate the wetland shows no evidence of geochemical hazards from surrounding anthropogenic activities like vehicle traffic or land use.
Separation, characterization and leaching behaviors of heavy metals in contam...Alexander Decker
The document summarizes a study on the characterization and leaching behaviors of heavy metals in contaminated river sediments. Sequential extraction tests found that heavy metal concentrations exceeded sediment quality standards. Acidic washing and chelation extraction treatments were then tested to remove heavy metals. Acid washing with 2N HCl for 120 minutes achieved the highest removal rates of 70-90% for different heavy metals. Chelation extraction with 0.5M citric acid for 120 minutes removed 36.69% of copper, while 0.5M EDTA for 120 minutes removed 45.83% of lead and 0.5M malic acid for 120 minutes removed 62.1% of zinc. The study concludes that acid washing and chelation agent extraction
Separation, characterization and leaching behaviors of heavy metals in contam...Alexander Decker
This document discusses a study on the separation, characterization, and leaching behaviors of heavy metals in contaminated river sediments. The study involved analyzing sediment samples from rivers in central Taiwan to understand the concentration and chemical forms of heavy metals present, including copper, lead, zinc, nickel, and chromium. Sequential extraction tests showed most metals exceeded sediment quality standards. Acid washing experiments found heavy metal removal efficiencies were highest for nickel, zinc, lead, copper, and chromium when washed with HCl for 120 minutes. Results indicate some metals exist in residual forms in sediments but become more exchangeable after washing, increasing bioavailability.
Environmental Qualitative assessment of rivers sedimentsGJESM Publication
In this study, the concentrations of heavy metals (Ca, Zn, Cu, Fe, Mn, Ni) in thesediment of Shavoor River in Khuzestan Province in Iran has been investigated. After the library studies and field studies, six samples of water
and sediment were taken from the river in order to evaluate heavy metal pollution in sediments. To determine the
geochemical phases of metals in sediment samples the 5-step method was used for chemical separation. For quantitative assessment of the severity of contamination in the sediments, the geochemical indicators such as enriched factor (EF) and the accumulation index (Igeo) were used. Also, the statistical analyses including methods such as correlation analysis cluster analysis the (CA), were conducted.The results of the experiments showed that the organic matter deposited varies
with the average of 2.49 and ranges between 1.95% and 3.43%. Samples showed concentrations of metals such as calcium, iron, manganese, copper and nickel at all the sampling points were below the global average, whereas the concentration of copper was slightly higher than the global scale. Enriched factor (EF) was calculated for the elements revealed that heavy metals are classified as non-infected. The Geo-accumulation Index showed that the studied elements were uninfected peers. Based on the results of multivariate statistical analysis it was concluded that metals such as manganese, copper, iron, nickel and zinc are mainly natural and calcium metal is likely to have an organic origin.
Assessment of heavy metal pollution index for groundwater around Jharia coalf...Innspub Net
Assessment of the seasonal variations of the groundwater with respect to heavy metals contamination. For this purpose, 29 groundwater samples were collected and analyzed for heavy metals such as cadmium, copper, iron, manganese, lead and zinc of Jharia coalfield region. In majority of the samples, the analyzed heavy metals are well within the desirable limits and water is potable for drinking purposes. However, concentration of the Fe and Mn exceeding the desirable limits in many groundwater samples in both the seasons. The HPI of groundwater was found 9.94 in pre-monsoon season and 5.24 in post-monsoon season. The HPI values of the samples within study area are found below the critical pollution index (100) in both the seasons, which shows that the groundwater was not polluted with respect of heavy metals.
A study of Heavy Metal Pollution in Groundwater of Malwa Region of Punjab, In...IJERA Editor
Among the different types of pollution, heavy metal pollution has become one of the major environmental issues in India. A number of studies show that high level of heavy metal exposure is a frequent cause of permanent intellectual and developmental disabilities. In this present study, the AAS method is used to determine the various heavy metal concentrations for 240 samples of Groundwater distributed in eight districts in Malwa Region of Punjab. The concentration values were compared with Standard Values given by BIS. The results showed that the maximum percentage of groundwater samples of Malwa region is beyond the permissible limits and that’s why not fit for drinking purposes and other domestic activities due to the presence of various heavy metals . The overall groundwater quality of Punjab for Arsenic, lead, Iron, Cobalt, Chromium, zinc and Mercury can also be detected and compared with BIS standards. The aim of this particular study was to investigate the distribution of Heavy metals in groundwater of Malwa Region of Punjab and its greater risks to public health. The results were compared with the recommended standards for drinking water of BIS to know the existing status and trend. Overall, water quality was found as unsatisfactory for drinking purposes in all the samples.
1) The document analyzes the physico-chemical parameters of groundwater samples collected from 10 locations in the Sangrampur Tehsil region of Buldana District, Maharashtra, India.
2) Testing found that most parameters were within acceptable levels for drinking water according to Indian standards, though a few locations showed higher levels of turbidity, COD, calcium, and magnesium after the monsoon season.
3) Overall groundwater quality was deemed not harmful for human use, but some parameters exceeded limits at individual locations possibly due to nearby industrial, mining or sewage influences, indicating increased human impact on water quality.
This document summarizes a study that assessed heavy metal contamination in sediments of the River Ravi in Pakistan. Sediment samples were collected from 19 stations along the river and its tributaries. The study found:
1) Heavy metal concentrations varied significantly between sampling stations and ranged from 0.99-3.17 μg/g for cadmium, 4.60-57.40 μg/g for chromium, 2.22-18.53 μg/g for cobalt, and 3.38-159.79 μg/g for copper.
2) The highest copper concentration was found in Taj Company nulla tributary sediments, while the lowest cadmium level was observed at Lahore Siphon.
A study of Heavy Metal Pollution in Groundwater of Malwa Region of Punjab, In...IJERA Editor
Among the different types of pollution, heavy metal pollution has become one of the major environmental issues in India. A number of studies show that high level of heavy metal exposure is a frequent cause of permanent intellectual and developmental disabilities. In this present study, the AAS method is used to determine the various heavy metal concentrations for 240 samples of Groundwater distributed in eight districts in Malwa Region of Punjab. The concentration values were compared with Standard Values given by BIS. The results showed that the maximum percentage of groundwater samples of Malwa region is beyond the permissible limits and that’s why not fit for drinking purposes and other domestic activities due to the presence of various heavy metals . The overall groundwater quality of Punjab for Arsenic, lead, Iron, Cobalt, Chromium, zinc and Mercury can also be detected and compared with BIS standards. The aim of this particular study was to investigate the distribution of Heavy metals in groundwater of Malwa Region of Punjab and its greater risks to public health. The results were compared with the recommended standards for drinking water of BIS to know the existing status and trend. Overall, water quality was found as unsatisfactory for drinking purposes in all the samples
Trace Metals Concentration in Shallow Well Water in Enugu Metropolispaperpublications3
Abstract: This work assesses the concentration of heavy metals in Enugu Municipal well-water considering the fact that some Enugu inhabitants depend on well-water as their major source of water supply. Water from twenty four (24) different hand dug wells from six locations were investigated for Zn, Cu, Pb, Mn, Cd, and Fe using Atomic Absorption Spectroscopy (AAS). The result of the study expressed as the means and standard deviations were compared to WHO and EU standards for drinking water, and it was found that well waters from Iva-Valley and Uwani areas suffer from Cd and Mn pollution. The remaining four locations (Emene, Asata, Abakpa Nike and Achara Layout) were all free from Cd and Mn pollution. Cu, Zn, Fe and Pb concentrations were either completely absent or below world threshold limits at all the locations.
Studies of Hydrogeochemical in Groundwater Quality around Chakghat Area, Rew...IJMER
This document summarizes a study of groundwater quality around Chakghat, Rewa District, Madhya Pradesh, India. 25 groundwater samples were collected and analyzed for various parameters. The water quality was found to be suitable for drinking according to WHO and ISI standards, though some samples exceeded limits for hardness, fluoride, and total dissolved solids. For irrigation purposes, the sodium adsorption ratio and other parameters indicated the groundwater was generally of good quality with low sodium hazard. The study provides useful information about groundwater resources in the region.
The document summarizes a study that assessed heavy metal pollution in the Panchganga River in India and biomagnification of heavy metals in molluscs. The study found alarming levels of heavy metal contamination in the river, with some metal concentrations exceeding legal limits. Several heavy metals accumulated in high levels in the tissues of mollusc species collected from the river. Continuous monitoring is needed to limit further pollution in the river, which affects the health of the entire river ecosystem.
International Journal of Engineering and Science Invention (IJESI) is an international journal intended for professionals and researchers in all fields of computer science and electronics. IJESI publishes research articles and reviews within the whole field Engineering Science and Technology, new teaching methods, assessment, validation and the impact of new technologies and it will continue to provide information on the latest trends and developments in this ever-expanding subject. The publications of papers are selected through double peer reviewed to ensure originality, relevance, and readability. The articles published in our journal can be accessed online.
This document summarizes a study on microbial metal cycling and bioaccumulation in roadside soils and streams. The study aims to establish relationships between urbanization and pollutant concentrations in a local stream ecosystem. Researchers analyzed metal concentrations in insects, soils, and sediments from different zones of a creek. They also investigated microbial oxidation and reduction of antimony species from roadside soils and isolated bacterial strains to study metabolic pathways. Preliminary results found higher arsenic and lead levels in downstream insects and trace antimony reduction by soils microbes. The study provides background on metal pollution impacts and aims to further examine seasonal shifts and microbial antimony processing.
The quality of any body of surface or ground water
is a function of either both natural influences and human
influences. Without human influences water quality would be
determined by the weathering of bedrock minerals, by the
atmospheric processes of evaporation, transpiration and the
deposition of dust and salt by wind, by the natural leaching of
organic matter and nutrients from soil, by hydrological factors
that lead to runoff, and by biological processes within the aquatic
environment that can alter the physical and chemical
composition of water. Declining water quality has become a
global issue of concern as human populations griesrow, industrial
and agricultural activities expand, and climate change threatens
to cause major alterations to the hydrological cycle.
11.ground water quality assessment of nagercoil townAlexander Decker
The document analyzes the physico-chemical characteristics of water samples collected from 15 hand pumps in 3 towns in Nagercoil, India. Testing found that pH, total alkalinity, hardness, nitrate, sodium, potassium, iron and phosphate levels were above permissible limits in some samples. The study concludes that higher levels of dissolved constituents were found due to greater interaction of groundwater with geological materials.
Ground water quality assessment of nagercoil townAlexander Decker
This document summarizes a study analyzing the physico-chemical characteristics of water samples collected from 15 hand pumps in Nagercoil Town, Tamil Nadu, India. The study found that the pH of the water samples was slightly acidic, and that total alkalinity, total hardness, nitrate, sodium, potassium, iron and phosphate levels were above permissible limits. The document provides details on the materials and methods used to collect and analyze the water samples. It discusses the results, noting that hardness, total dissolved solids, chloride, fluoride, and nitrate levels exceeded guidelines in some locations. The conclusion states that higher dissolved constituents were found due to interaction with geological materials.
This document summarizes a workshop on improving freshwater monitoring frameworks in northwest India. It discusses current groundwater quality monitoring efforts and gaps. Key issues include increased pollution levels, falling water levels, and a lack of comprehensive and high-resolution spatial monitoring of parameters like heavy metals. The document outlines the need to better understand recharge processes, water quality impacts, and the properties of groundwater systems through improved monitoring protocols. Case studies from the region are proposed to help address questions around these issues and make recommendations to improve water resource management.
International Journal of Engineering Research and Applications (IJERA) is an open access online peer reviewed international journal that publishes research and review articles in the fields of Computer Science, Neural Networks, Electrical Engineering, Software Engineering, Information Technology, Mechanical Engineering, Chemical Engineering, Plastic Engineering, Food Technology, Textile Engineering, Nano Technology & science, Power Electronics, Electronics & Communication Engineering, Computational mathematics, Image processing, Civil Engineering, Structural Engineering, Environmental Engineering, VLSI Testing & Low Power VLSI Design etc.
Similar to PhD Viva presentation /PhD thesis defense/Environmental Science thesis presentation (20)
This document discusses various pollution control methods such as scientific, technological, managerial, policy, legislation, and economic approaches. It also describes Indonesia's PROPER program which rates industrial polluters based on their environmental performance and discloses these ratings publicly. The program rated 187 plants for water pollution in its initial implementation in 1995. Finally, the document discusses the Polluter Pays Principle, noting that the Dutch implemented charges for pollution emissions in 1970 after many of their waterways became biologically dead due to organic waste pollution from industry and households. This led industries and all sectors of society to pay for their estimated pollution discharges.
This document discusses several applications of ecological engineering, including invasive species management, coastal zone management, and shoreline erosion management. For invasive species, it describes types like alien and hybrid species and control methods like restoration, habitat protection, biological control using natural predators, and physical removal. Coastal zone management involves restoring sea grasses and coral reefs, wastewater treatment, and collaboration among stakeholders. Shoreline erosion management discusses causes of erosion and techniques like placing riprap, sand, trees and vegetation to dissipate wave energy and stabilize shorelines.
Ecological engineering draws on natural processes to address environmental problems. It relies on principles like:
1) Energy signatures that determine ecosystem structure and function, such as sunlight or organic matter inputs.
2) Self-organization through ecological succession as species colonize and evolve based on available resources.
3) Preadaptation of species that are adapted to the intended ecosystem conditions, accelerating development.
Wetlands are an example where the microbial communities in the water and substrate break down pollutants through natural treatment processes like sedimentation, filtration, and biochemical reactions. Different wetland designs like free-water surface, horizontal subsurface flow, or vertical flow can be used to treat wastewater depending
Occupational Health of Sanitation Workers Chandrapur CityRahul Kamble
The document summarizes a study on the occupational health of sanitation workers in Chandrapur City, India. It finds that street sweepers suffer mainly from musculoskeletal and respiratory problems due to dust exposure. Sewage workers experience musculoskeletal issues and gastrointestinal illnesses from bacteria in sewage, as well as exposure to harmful gases. Solid waste collectors reported musculoskeletal injuries from lifting waste. The study recommends providing protective equipment, mechanizing hazardous work, regular medical checkups, education on safety procedures, and health insurance for these workers.
This document discusses various methods for managing biomedical and e-waste, including autoclaving, hydroclaving, microwave, plasma treatment, and solar radiation. Autoclaving uses steam at high temperatures to sterilize waste but only partially reduces volumes and cannot treat all waste types. Hydroclaving similarly uses steam but allows for internal agitation and fragmentation for higher sterilization. Microwave heating penetrates waste internally while eliminating liquid and gaseous emissions. Plasma treatment converts waste into useful byproducts using high-temperature plasma. Solar radiation uses reflected sunlight to disinfect waste in a heated metal box. The document also lists strategies for e-waste management like reduction, reuse, recycling, and conventional landfilling or
This document discusses solid and hazardous waste management, with a focus on methods of collection, transfer stations, and landfilling. It provides details on:
1. Factors that affect the rate of solid waste generation such as location, season, culture, and public attitudes.
2. Proper handling and separation of solid waste to prevent pollution, including covering waste, containing stormwater runoff, and labeling hazardous materials.
3. The need for transfer stations between collection and long-distance transportation to optimize vehicle usage and minimize transportation time. Transfer stations can be either level or split-level designs.
4. Sanitary landfilling as a disposal method where waste is compacted and covered daily to avoid nu
The document discusses several environmental innovations including:
1) On-board carbon capture for vehicles that stores carbon emissions on board until disposal to reduce transportation sector emissions.
2) Developing geothermal power stations using water from abandoned mines to generate green energy for heating and cooling.
3) Using reusable polymer beads in washing machines instead of water to significantly reduce water usage for laundry.
4) Harnessing wind power to extract water from air through cooling and condensation, producing potable water in arid areas.
This document discusses several examples of sustainable innovations:
- Free public transport was implemented in Tallinn, Estonia to encourage less car usage and reduce emissions, benefiting residents.
- Floating houses use expandable polystyrene to provide foundations for structures in flood-prone areas vulnerable to sea level rise.
- More sustainable building materials include bricks containing renewable resources like straw and using sheep's wool insulation instead of petroleum-based products.
- Technological innovations aim to improve solar cell efficiency and reduce costs, such as using nanoflakes to convert more solar energy to electricity.
The document discusses eco-innovation and environmental issues. It defines eco-innovation as the creation of goods, processes, systems, and procedures that satisfy human needs with minimal use of natural resources and release of toxins. It describes the goals, barriers, drivers, and benefits of eco-innovation. The document also discusses eco-efficiency, eco-industry, types of innovations like product and process innovations, and tools for measuring innovation like surveys, patent analysis, and analysis of digital and documentary sources.
This document defines radiation pollution and discusses its sources, classifications, effects, units of measurement, and methods of disposal and control. It addresses both natural and anthropogenic sources of radiation pollution, as well as ionizing and non-ionizing types. Examples of effects include direct and indirect effects on living organisms. Historical events involving radiation pollution like Chernobyl and methods used to manage radioactive waste are also outlined.
This document discusses various topics related to water pollution including sources of water pollution, types of water pollution that can occur in different water bodies, causes of water pollution both natural and man-made, and effects of water pollution. It provides details on how water pollution can contaminate groundwater, surface water, lakes, rivers and oceans. Some key effects mentioned are water pollution leading to epidemics and diseases as well as the collapse of aquatic systems. The document concludes with discussing water management strategies like rainwater harvesting, reuse of waste, and industrial water management techniques.
This document discusses oil pollution, including its sources, effects, and control measures. It notes that oil pollution endangers aquatic life and coastal environments. Major sources include cargo tanker washing, oil spills during transport, bilge dumping, and accidents. Effects range from reduced oxygen in water, harm to marine ecosystems and wildlife, and human health impacts. Control methods encompass physical removal techniques like skimming, as well as chemical dispersion and biological degradation using microorganisms. The overall document aims to raise awareness about oil pollution and the need to protect ocean environments.
This document discusses various types of air pollution such as smoke, smog, and the chemical reactions involved in their formation. It provides details on notable air pollution episodes in locations like Meuse Valley, Donora PA, Poza Rica, and London in 1952 where thick smog caused by coal combustion led to thousands of excess deaths. The 1952 London smog episode and other smog events in Los Angeles are described in more depth, highlighting the atmospheric conditions like temperature inversions that caused pollutants to become trapped and the health impacts on people.
This document discusses carbon monoxide (CO), including its properties, sources, and effects on human health and the environment. It notes that CO is a colorless, odorless gas produced through natural processes and human activities like burning fossil fuels. In humans, CO reduces the blood's ability to carry oxygen by forming carboxyhemoglobin. Exposure to CO can be harmful even at low concentrations. The document also mentions carbon dioxide (CO2) as a greenhouse gas increasing due to fossil fuel combustion and deforestation. It identifies the eight major air pollutants regulated by the EPA.
This document classifies and describes the main types of air pollutants: particulate matter, sulphur dioxide, oxides of nitrogen, and hydrocarbons. It notes that particulate matter comes from various natural sources as well as human activities. Sulphur dioxide is formed through combustion of sulphur-bearing materials and coal combustion accounts for most anthropogenic SO2. Oxides of nitrogen are produced at higher temperatures and result from natural bacterial processes as well as combustion of fuels. Hydrocarbons are emitted by trees and domestic animals, while automobiles and petroleum combustion are significant anthropogenic sources.
This document discusses air pollution and its causes. It begins with an introduction on the importance of air and outlines the composition of clean air, which is primarily nitrogen, oxygen, and trace amounts of other gases. It then defines air pollution according to the WHO as substances introduced by human activity that harm health, environment, or property. Major sources of air pollutants are identified as natural sources initially, but now also include the burning of fossil fuels. Air pollutants are classified based on their source, physical state, chemical reactions, and mobility within the atmosphere. In closing, the document provides a historical background on early regulations of air pollution from coal burning in London.
Ecology is defined as the science that studies the interactions between organisms and their environment. The term comes from the Greek words "oikos" meaning house or habitation, and "logos" meaning discourse or study. It deals with how organisms live in their environments and interact with biotic factors like other living things as well as abiotic factors such as climate. Ecosystems form through the complex interactions between biotic and abiotic components, with energy flowing in one direction and biogeochemical cycles regulating chemicals. Ecology has many applications and branches including applied ecology, population ecology, limnology, and human ecology.
Presented by The Global Peatlands Assessment: Mapping, Policy, and Action at GLF Peatlands 2024 - The Global Peatlands Assessment: Mapping, Policy, and Action
Epcon is One of the World's leading Manufacturing Companies.EpconLP
Epcon is One of the World's leading Manufacturing Companies. With over 4000 installations worldwide, EPCON has been pioneering new techniques since 1977 that have become industry standards now. Founded in 1977, Epcon has grown from a one-man operation to a global leader in developing and manufacturing innovative air pollution control technology and industrial heating equipment.
Improving the viability of probiotics by encapsulation methods for developmen...Open Access Research Paper
The popularity of functional foods among scientists and common people has been increasing day by day. Awareness and modernization make the consumer think better regarding food and nutrition. Now a day’s individual knows very well about the relation between food consumption and disease prevalence. Humans have a diversity of microbes in the gut that together form the gut microflora. Probiotics are the health-promoting live microbial cells improve host health through gut and brain connection and fighting against harmful bacteria. Bifidobacterium and Lactobacillus are the two bacterial genera which are considered to be probiotic. These good bacteria are facing challenges of viability. There are so many factors such as sensitivity to heat, pH, acidity, osmotic effect, mechanical shear, chemical components, freezing and storage time as well which affects the viability of probiotics in the dairy food matrix as well as in the gut. Multiple efforts have been done in the past and ongoing in present for these beneficial microbial population stability until their destination in the gut. One of a useful technique known as microencapsulation makes the probiotic effective in the diversified conditions and maintain these microbe’s community to the optimum level for achieving targeted benefits. Dairy products are found to be an ideal vehicle for probiotic incorporation. It has been seen that the encapsulated microbial cells show higher viability than the free cells in different processing and storage conditions as well as against bile salts in the gut. They make the food functional when incorporated, without affecting the product sensory characteristics.
Microbial characterisation and identification, and potability of River Kuywa ...Open Access Research Paper
Water contamination is one of the major causes of water borne diseases worldwide. In Kenya, approximately 43% of people lack access to potable water due to human contamination. River Kuywa water is currently experiencing contamination due to human activities. Its water is widely used for domestic, agricultural, industrial and recreational purposes. This study aimed at characterizing bacteria and fungi in river Kuywa water. Water samples were randomly collected from four sites of the river: site A (Matisi), site B (Ngwelo), site C (Nzoia water pump) and site D (Chalicha), during the dry season (January-March 2018) and wet season (April-July 2018) and were transported to Maseno University Microbiology and plant pathology laboratory for analysis. The characterization and identification of bacteria and fungi were carried out using standard microbiological techniques. Nine bacterial genera and three fungi were identified from Kuywa river water. Clostridium spp., Staphylococcus spp., Enterobacter spp., Streptococcus spp., E. coli, Klebsiella spp., Shigella spp., Proteus spp. and Salmonella spp. Fungi were Fusarium oxysporum, Aspergillus flavus complex and Penicillium species. Wet season recorded highest bacterial and fungal counts (6.61-7.66 and 3.83-6.75cfu/ml) respectively. The results indicated that the river Kuywa water is polluted and therefore unsafe for human consumption before treatment. It is therefore recommended that the communities to ensure that they boil water especially for drinking.
Kinetic studies on malachite green dye adsorption from aqueous solutions by A...Open Access Research Paper
Water polluted by dyestuffs compounds is a global threat to health and the environment; accordingly, we prepared a green novel sorbent chemical and Physical system from an algae, chitosan and chitosan nanoparticle and impregnated with algae with chitosan nanocomposite for the sorption of Malachite green dye from water. The algae with chitosan nanocomposite by a simple method and used as a recyclable and effective adsorbent for the removal of malachite green dye from aqueous solutions. Algae, chitosan, chitosan nanoparticle and algae with chitosan nanocomposite were characterized using different physicochemical methods. The functional groups and chemical compounds found in algae, chitosan, chitosan algae, chitosan nanoparticle, and chitosan nanoparticle with algae were identified using FTIR, SEM, and TGADTA/DTG techniques. The optimal adsorption conditions, different dosages, pH and Temperature the amount of algae with chitosan nanocomposite were determined. At optimized conditions and the batch equilibrium studies more than 99% of the dye was removed. The adsorption process data matched well kinetics showed that the reaction order for dye varied with pseudo-first order and pseudo-second order. Furthermore, the maximum adsorption capacity of the algae with chitosan nanocomposite toward malachite green dye reached as high as 15.5mg/g, respectively. Finally, multiple times reusing of algae with chitosan nanocomposite and removing dye from a real wastewater has made it a promising and attractive option for further practical applications.
Evolving Lifecycles with High Resolution Site Characterization (HRSC) and 3-D...Joshua Orris
The incorporation of a 3DCSM and completion of HRSC provided a tool for enhanced, data-driven, decisions to support a change in remediation closure strategies. Currently, an approved pilot study has been obtained to shut-down the remediation systems (ISCO, P&T) and conduct a hydraulic study under non-pumping conditions. A separate micro-biological bench scale treatability study was competed that yielded positive results for an emerging innovative technology. As a result, a field pilot study has commenced with results expected in nine-twelve months. With the results of the hydraulic study, field pilot studies and an updated risk assessment leading site monitoring optimization cost lifecycle savings upwards of $15MM towards an alternatively evolved best available technology remediation closure strategy.
RoHS stands for Restriction of Hazardous Substances, which is also known as t...vijaykumar292010
RoHS stands for Restriction of Hazardous Substances, which is also known as the Directive 2002/95/EC. It includes the restrictions for the use of certain hazardous substances in electrical and electronic equipment. RoHS is a WEEE (Waste of Electrical and Electronic Equipment).
Optimizing Post Remediation Groundwater Performance with Enhanced Microbiolog...Joshua Orris
Results of geophysics and pneumatic injection pilot tests during 2003 – 2007 yielded significant positive results for injection delivery design and contaminant mass treatment, resulting in permanent shut-down of an existing groundwater Pump & Treat system.
Accessible source areas were subsequently removed (2011) by soil excavation and treated with the placement of Emulsified Vegetable Oil EVO and zero-valent iron ZVI to accelerate treatment of impacted groundwater in overburden and weathered fractured bedrock. Post pilot test and post remediation groundwater monitoring has included analyses of CVOCs, organic fatty acids, dissolved gases and QuantArray® -Chlor to quantify key microorganisms (e.g., Dehalococcoides, Dehalobacter, etc.) and functional genes (e.g., vinyl chloride reductase, methane monooxygenase, etc.) to assess potential for reductive dechlorination and aerobic cometabolism of CVOCs.
In 2022, the first commercial application of MetaArray™ was performed at the site. MetaArray™ utilizes statistical analysis, such as principal component analysis and multivariate analysis to provide evidence that reductive dechlorination is active or even that it is slowing. This creates actionable data allowing users to save money by making important site management decisions earlier.
The results of the MetaArray™ analysis’ support vector machine (SVM) identified groundwater monitoring wells with a 80% confidence that were characterized as either Limited for Reductive Decholorination or had a High Reductive Reduction Dechlorination potential. The results of MetaArray™ will be used to further optimize the site’s post remediation monitoring program for monitored natural attenuation.
1. Spatial and Temporal Distribution of Groundwater
Iron and Manganese in the Chandrapur District of
Maharashtra and their Plausible Sources
Open Viva-Voce Test of the Ph.D. Thesis
Student: Rahul Krishna Kamble
Supervisor: Dr M G Thakare
Gondwana University, Gadchiroli, Maharashtra
Tuesday the February 27, 2018
2. Overview
• The issue
• Problems
• Gaps in the previous studies
• Methodology
• Findings
• Conclusions
• Questions and Answers
2
3. Introduction
• Water is indispensible part of human life.
• Over one billion people lack access to clean
safe water worldwide (Bresline, 2007; NAS,
2009).
• In India 200 million people do not have access
to clean drinking water (Datta, 2008).
3
4. • Without safe drinking water near dwellings,
the health and livelihood of families can be
severely affected (MacDonald et al., 2005;
United Nations, 2000).
• Groundwater exploitation is generally
considered as the only realistic option for
meeting dispersed rural water demand
(MacDonald et al., 2005).
4
5. The issue
5
Chemical constituent No. of States No. of Districts (in parts)
Arsenic 10 86
Fluoride 20 276
Nitrate 21 387
Iron 24 297
(Source: http://wrmin.nic.in/writereddata/CGWB_GroundWaterDepletion.ppt, Accessed October 28, 2015)
Contamination of Groundwater in India
6. Problems
6
IS 10500:1983
Substance/characteristics Requirement
(Desirable limit)
Permissible limit in the absence
of alternative source
Remarks
Iron 0.3 1.0 --
IS 10500:1991
Substance/characteristics Requirement
(Desirable limit)
Permissible limit in the absence
of alternative source
Remarks
Iron 0.3 1.0 --
IS 10500:2004
Substance/characteristics Requirement
(Desirable limit)
Permissible limit in the absence
of alternative source
Remarks
Iron 0.3 1.0 --
IS 10500:2012
Substance/
characteristics
Requirement
(Desirable limit)
Permissible limit in the
absence of alternative source
Remarks
Iron 0.3 No relaxation Total concentration of manganese
(as Mn) and iron (as Fe) shall not
exceed 0.3 mg/L.
Source: IS 10500 (of various years).
8. Objectives
1. To study the distribution of groundwater iron and
manganese concentration in the Chandrapur district.
• RQ 1.1 How groundwater iron concentration is distributed in
the Chandrapur district?
• RQ 1.2 How groundwater manganese concentration is
distributed in the Chandrapur district?
• RQ 1.3 Is there any different between distribution of
groundwater iron and manganese with respect to source such
as dug well and hand pump?
• RQ 1.4 Does age of water source (Dug well and hand pumps)
has any influence on concentration of groundwater iron in
study area?
(RQ = Research Question)
8
9. 2. To study the correlation with depth and distribution of
groundwater iron and manganese.
• RQ 2.1 How concentration of iron is correlated with depth of
water table?
• RQ 2.2 How concentration of manganese is correlated with
depth of water table?
• RQ 2.3 Is there any seasonal influence on concentration of
these heavy metals with respect to depth of water source?
• RQ 2.4 Which water source had higher concentration of these
two heavy metals?
• RQ 2.5 Is the concentration of iron in groundwater is
dependent on depth of the aquifer?
• RQ 2.6 Is the concentration of manganese in groundwater is
dependent on depth of the aquifer?
9
10. 3. To assess impacts of seasonal variation on distribution of
groundwater iron and manganese.
• RQ 3.1 Does different seasons of a year (summer, post-
monsoon and winter) have influence on groundwater iron and
manganese concentration?
• RQ 3.2 In which season maximum and minimum
concentration of these two heavy metals was observed?
• RQ 3.3 Is there any relation between groundwater depth,
season and concentration of these two heavy metals?
• RQ 3.4 Are other water quality parameters had influence on
groundwater iron and manganese concentration?
• RQ 3.5 What is the observation on comparison of these two
heavy metals concentration with Indian Standards for drinking
water?
10
11. 4. To assign plausible sources of iron and manganese in
groundwater.
• RQ 4.1 What can be plausible source(s) for presence of iron
concentration in groundwater?
• RQ 4.2 What can be plausible source(s) for presence of
manganese concentration in groundwater?
11
13. Approach
– Literature survey.
– Identification of sampling locations.
– Water sampling from the identified locations.
– Determination of Fe and Mn conc. from
groundwater samples.
– Distribution of these metals w.r.t. various
aspects.
– Interpretation of data.
– Thesis writing.
13
14. Significance of study
• Seasonal distribution of groundwater Fe and Mn.
• Distribution of groundwater Fe w.r.t. IS 10500:2012.
• Distribution of groundwater Mn w.r.t. WHO standard.
• Below ground level distribution of these two heavy
metals.
• Health threat assessment by ingestion of this water.
• Plausible sources for presence of these heavy metals.
14
15. Literature review
• National and international studies.
• Water contaminants studies were carried out.
• Iron and manganese attracted attention in last
few years.
• Groundwater iron was studied with aesthetic
aspect.
• Selected studies with health aspects for Mn.
• Spatial and temporal distribution was lacking.
• Only some studies for plausible sources.
15
16. Literature review (Cont…)
International studies (Selected)
Joode et al., (2016); Kovacevik (2016); Li et al.,
(2016), Palmucci et al., (2016), Siegal et al., (2015),
Bacquart et al., (2015), Begum et al., (2015), Huang
et al., (2015); etc.
National studies (Selected)
Dwivedi and Vankar (2014); Harish Raju (2014);
Sankar et al., (2014); Savita Kumari et al., (2014);
etc. reported groundwater iron and manganese
concentrations from different study areas.
16
17. Literature review (Cont…)
Health based aspects
• Khan et al., (2013b) ingestion of high level of
iron causes heart diseases, diabetes, thyroid
etc.
• Huang (2003) stated hepatitis B or C infection,
malignant tumour, colorectal tumors, liver,
lung, stomach, kidney diseases etc.
• Hafeman et al., (2007) reported infants
exposed to water manganese (>0.4 mg/L) leads
to elevated mortality risk in first year of life.
17
18. Gaps in previous studies
•No study was carried out pertaining to groundwater
iron and manganese from the Chandrapur district.
•Spatial and temporal distribution was lacking.
•Studies with respect to IS 10500:2012 (Second
Revision) and WHO standard were not carried out.
•Plausible sources of these two heavy metals were
not reported.
18
22. Methodologies
22
Parameter Standard method APHA (2005),
Reference No.
Instrument particular
Colour Visual Comparison method B of 2120 NA
Temperature Mercury thermometer B of 2550 Gera, GTI, India
pH Electrometric method B of 4500-H+ Digital pH meter, Electronics India, Model 101
Conductivity Conductivity meter B of 2510 Digital conductivity meter, Electronics India, Model 601
Total dissolved solids Total dissolved solids dried at 180 oC C of 2540 Hot air oven, Navyug, India
Alkalinity Titration method B of 2320 NA
Total hardness EDTA titration method C of 2340 NA
Chloride Argentometric method B of 4500-Cl- NA
Fluoride SPANDS method D of 4500-F- Double beam UV/Visible spectrophotometer, Electronics
India, Model 1372
Sulphate Turbidimetric method E of 4500-SO4
2- Double beam UV/Visible spectrophotometer, Electronics
India, Model 1372
Phosphate Stannous Chloride method D of 4500-P Double beam UV/Visible spectrophotometer, Electronics
India, Model 1372
Iron Inductively Coupled Plasma-OES C of 3500-Fe ICP-OES, Perkin Elmer, Germany, Dv 7000
Manganese Inductively Coupled Plasma-OES C of 3500-Mn ICP-OES, Perkin Elmer, Germany, Dv 7000
NA = Not Applicable
41. Water source, season and iron, manganese conc.
41
BDL- Below Detection Limit. All values in mg/L.
Season
Groundwater source
Average concentration, mg/L
Iron Manganese
Winter
Dug Well (n = 2, 5.55%) BDL 0.002
Hand Pump (n = 34, 94.44%) 3.005 0.212
Summer
Dug Well (n = 2, 5.55%) 0.176 0.009
Hand Pump (n = 34, 94.44%) 0.763 0.062
Post-monsoon
Dug Well (n = 2, 5.55%) 0.068 0.005
Hand Pump (n = 34, 94.44%) 0.613 0.061
42. Iron and manganese concentration
42
Fig. Groundwater iron conc. Fig. Groundwater manganese conc.
43. Rainfall vs. iron and manganese conc.
43
Rainfall range 1395-1500 mm 1601-1700 mm 1701-1800 mm 1801-1917 mm
Heavy metal
Iron
Average concentration 0.356 3.142 0.790 0.464
Manganese
Average concentration 0.033 0.136 0.117 0.106
Average concentration in mg/L.
44. Altitude vs. iron and manganese conc.
44
Altitude
Heavy metal
Low altitude
(152-197 m asl)
Medium altitude
(198-242 m asl)
High altitude
(243-287 m asl)
Iron 1.730 0.720 4.241
Manganese 0.105 0.107 0.097
Heavy metals average concentrations are reported in mg/L.
Attitude is reported in m above sea level (asl).
45. Altitude and rainfall vs. iron and manganese conc.
45
Rainfall range: 1395-1500 mm as 1, 1501-1600 mm as 2, 1601-1700 mm as 3, 1701-1800 mm as 4 and 1801-1917 mm as 5.
Iron and manganese concentration are average values in that altitude class.
Low, 152-197 m asl Medium, 198-242 m asl High, 243-287 m asl
Rainfall range Sampling location Sampling location Sampling location
1 Nil 6 (24%) 1 (20%)
3 2 (33.33%) 4 (16%) 3 (60%)
4 1 (16.66%) 13 (52%) 1 (20%)
5 3 (50%) 2 (8%) Nil
n=6 (16.66%) n=25 (69.44%) n=5 (13.88%)
Fe = 1.730 mg/L
Mn = 0.105 mg/L
Fe = 0.720 mg/L
Mn = 0.107 mg/L
Fe = 4.241 mg/L
Mn = 0.097 mg/L
53. Average iron and manganese conc. ratio
53
Average iron manganese conc.
ratio scale
Sampling location
(Percentage)
<10.00 13 (36.11%)
10.01 to 50.00 12 (33.33%)
50.01 to 100.00 5 (13.88%)
100.01 to 200.00 4 (11.11%)
200.01 to 400.00 1 (2.77%)
400.01 to 450.00 1 (2.77%)
54. Summary of average iron and manganese conc. ratio
54
Particular Detail
Minimum 0.86 (Chichpalli, HP)
Maximum 404.73 (Ballarpur, HP)
Average 48.58
Standard deviation (±) 78.34
Variance 6137.88
Skewness 3.15
Kurtosis 12.08
65. Distribution of well samples (Iron)
65
Iron conc. (mg/L) Shallow well (<99 ft bgl), n (%) Deep well (>100 ft bgl), n (%)
Winter Summer Post-monsoon Winter Summer Post-monsoon
<0.3 (Acceptable limit) 4 (66.66%) 3 (50%) 5 (83.33%) 12 (40%) 10 (33.33%) 18 (60%)
>0.3 (Above the
acceptable limit)
2 (33.33%) 3 (50%) 1 (16.66%) 18 (60%) 20 (66.66%) 12 (40%)
Iron conc. range above
the acceptable limit
(mg/L)
Total shallow
well samples
(n=6)
Total shallow
well samples
(n=6)
Total shallow
well samples
(n=6)
Total deep well
samples (n=30)
Total deep well
samples
(n=30)
Total deep well
samples (n=30)
0.3-1.0 Nil 2 (66.66%) 1 (100%) 8 (44.44%) 16 (80%) 7 (58.33%)
1.1-2.0 Nil Nil Nil 5 (27.77%) 2 (10%) 4 (33.33%)
2.1-3.0 Nil Nil Nil 2 (11.11%) Nil Nil
3.1-5.0 1 (50%) 1 (33.33%) Nil Nil 2 (10%) 1 (8.33%)
>5.1 1 (50%) Nil Nil 3 (16.66%) Nil Nil
Total shallow
well samples
(n=2)
Total shallow
well samples
(n=3)
Total shallow
well samples
(n=1)
Total deep well
samples (n=18)
Total deep well
samples
(n=20)
Total deep well
samples (n=12)
66. Distribution of well samples (Manganese)
66
Manganese conc.
(mg/L)
Shallow well (<99 ft bgl), n (%) Deep well (>100 ft bgl), n (%)
Winter Summer Post-
monsoon
Winter Summer Post-monsoon
<0.1 (Acceptable
limit)
4 (66.66%) 5 (83.33%) 5 (83.33%) 18 (60%) 24 (80%) 25 (83.33%)
>0.1 (Above the
acceptable limit)
2 (33.33%) 1 (16.66%) 1 (16.66%) 12 (40%) 6 (20%) 5 (16.66%)
Manganese conc.
range above the
acceptable limit
(mg/L)
Total shallow
well samples
(n = 6)
Total shallow
well samples
(n = 6)
Total shallow
well samples
(n = 6)
Total deep well
samples
(n = 30)
Total deep well
samples
(n = 30)
Total deep well
samples
(n = 30)
0.1-0.5 2 (100%) 1 (100%) 1 (100%) 8 (66.66%) 6 (100%) 4 (80%)
0.51-1.0 Nil Nil Nil 3 (25%) Nil 1 (20%)
1.1-2.0 Nil Nil Nil 1 (8.33%) Nil Nil
Total shallow
well samples
(n = 2)
Total shallow
well sample
(n = 1)
Total shallow
well sample
(n = 1)
Total deep well samples (n
= 12)
Total deep well
samples
(n = 6)
Total deep well
samples (n = 5)
67. 67
Water source depth vs. iron concentration
Water source
depth
(ft bgl)
Average
depth
(ft bgl)
Water sample,
n (%)
Iron conc. range (average) in mg/L
Winter Summer Post-monsoon Average
<50 feet 35 3 (8.33) BDL-0.24
(0.080)
0.164-0.439
(0.263)
0.055-0.089
(0.074)
0.139
51-100 92.66 15 (41.66) BDL-47.100
(5.398)
0.171-3.825
(0.922)
0.084-4.022
(0.841)
2.387
101-150 140 7 (19.44) BDL-2.97
(0.883)
0.200-1.134
(0.533)
0.146-1.276
(0.494)
0.636
151-200 190 8 (22.22) BDL-5.74
(1.506)
0.240-0.892
(0.471)
0.098-0.458
(0.183)
0.720
201-250 250 2 (5.55) 0.030-0.687
(0.358)
0.466-0.627
(0.546)
0.155-1.465
(0.810)
0.571
251-300 300 1 (2.77) 1.997
(1.997)
3.084
(3.084)
1.627
(1.627)
2.236
BDL = Below detection limit
71. Iron, manganese conc. distribution on BIS
71
Heavy
metal
Season
IS 10500:2012 Observed concentration (mg/L) Number of sampling location (%)
Acceptable
limit (mg/L)
Permissible
limit (mg/L)
Min. Mix. Average Within the
acceptable limit
Above the
permissible
limit
Iron
Winter 0.3 No
relaxation
BDL 47.100 3.522 16 (44.44%) 20 (55.55%)
Summer 0.164 3.825 0.730 13 (36.11%) 23 (63.88%)
Post-
monsoon
0.055 4.022 0.582 23 (63.88%) 13 (36.11%)
Manganese
Winter 0.1 0.3 BDL 1.853 0.257 22 (61.11%) 7 (19.44%)
Summer 0.003 0.474 0.058 29 (80.55%) 1 (2.77%)
Post-
monsoon
0.002 0.761 0.058 30 (83.33%) 2 (5.55%)
Min.- Minimum, Max. - Maximum, BDL - Below detection limit. BIS into consideration is IS 10500:2012.
72. Fe and Mn distribution on BIS combinations
72
Values of iron and manganese concentrations are reported in mg/L. BIS into consideration is IS 10500:2012.
0.3 mg/L is acceptable limit of iron and 0.1 mg/L is acceptable limit of manganese.
Column 1 Column 2 Column 3 Column 4 Column 5 Column 6
Season Fe <0.3
Mn <0.1
Fe <0.3
Mn >0.1
Fe >0.3
Mn <0.1
Fe >0.3
Mn >0.1
Iron, manganese or both above the
respective acceptable limit
Number of sampling location (%)
Winter 12 (33.33%) 4 (11.11%) 10 (27.77%) 10 (27.77%) n=24, 66.65%
Summer 13 (36.11%) Nil 16 (44.44%) 7 (19.44%) n=23, 63.88%
Post-
monsoon
22 (61.11%) 1 (2.77%) 8 (22.22%) 5 (13.88%) n=14, 38.87%
73. Distribution of Fe and Mn with well structure (Winter)
73
Well structure Heavy metal
Observed concentration (mg/L) Acceptable
limit*
(mg/L)
Comparison with
IS 10500:2012 standard,
Fold increase
Min. Max. Average Max. Average
Shallow well
(<100 ft bgl)
(n = 18, 50%)
Fe BDL 47.100 4.511 0.3 157 15.03
Mn BDL 0.972 0.168 0.1 9.72 1.68
Deep well
(101-150 ft bgl)
(n = 7, 19.44%)
Fe BDL 2.927 0.883 0.3 9.75 2.94
Mn BDL 1.853 0.367 0.1 18.53 3.67
Very deep well
(151-300 ft bgl)
(n = 11, 30.55)
Fe BDL 5.715 1.342 0.3 19.05 4.47
Mn BDL 0.791 0.146 0.1 7.91 1.46
Min.- Minimum, Max. - Maximum, BDL- Below detection limit. *Acceptable limit of IS 10500 : 2012 for iron and manganese
respectively.
74. Distribution of Fe and Mn with well structure (Summer)
74
Min.- Minimum, Max. – Maximum. *Acceptable limit of IS 10500 : 2012 for iron and manganese respectively.
Well structure Heavy
metal
Observed concentration (mg/L) Acceptable
limit*
(mg/L)
Comparison with IS 10500:2012
standard, Fold increase
Min. Max. Average Min. Max. Average
Shallow well
(<100 ft bgl)
(n = 18, 50%)
Fe 0.164 3.825 0.812 0.3 0.54 12.75 2.70
Mn 0.003 0.248 0.048 0.1 0.03 2.48 0.48
Deep well
(101-150 ft
bgl)
(n = 7, 19.44%)
Fe 0.200 1.134 0.533 0.3 0.66 3.78 1.77
Mn 0.004 0.474 0.103 0.1 0.04 4.74 1.03
Very deep well
(151-300 ft
bgl) (n = 11,
30.55%)
Fe 0.240 3.084 0.722 0.3 0.8 10.28 2.40
Mn 0.005 0.201 0.048 0.1 0.05 2.01 0.48
75. Distribution of Fe and Mn with well structure (Post-monsoon)
75
Min.- Minimum, Max. – Maximum. *Acceptable limit of IS 10500 : 2012 for iron and manganese respectively.
Well structure Heavy metal
Observed concentration (mg/L) Acceptable
limit* (mg/L)
Comparison with IS 10500:2012
standard, Fold increase
Min. Max. Average Min. Max. Average
Shallow well
(<100 ft bgl)
(n = 18, 50%)
Fe 0.055 4.022 0.713 0.3 0.183 13.40 2.37
Mn 0.002 0.312 0.049 0.1 0.02 3.12 0.49
Deep well (101-
150 ft bgl)
(n = 7, 19.44%)
Fe 0.146 1.276 0.494 0.3 0.486 4.25 1.64
Mn 0.002 0.761 0.125 0.1 0.02 7.61 1.25
Very deep well
(151-300 ft bgl)
(n = 11, 30.55%)
Fe 0.098 1.627 0.424 0.3 0.32 5.42 1.41
Mn 0.002 0.133 0.029 0.1 0.02 1.33 0.29
80. Well characteristics and distribution of Fe and Mn conc.
80
Variable n Range Average Median
Year of installation 36 1-60 15.27 11
Water source depth (ft bgl) 36 20-300 133.19 110
Altitude (m asl) 36 152-287 211.77 214.5
Iron (mg/L)
Winter 36 BDL-47.100 3.522 0.687
Summer 36 0.164-3.825 0.730 0.400
Post-monsoon 36 0.055-4.022 0.582 0.193
Manganese (mg/L)
Winter 36 BDL-1.853 0.257 0.098
Summer 36 0.003-0.474 0.058 0.016
Post-monsoon 36 0.002-0.761 0.058 0.012
81. Iron conc. categorisation on WHO, JECFA, IOM
81
n - Number of sampling locations. Average values are reported in mg/L.
*WHO (2006) aesthetic cut-off and IS 10500: 2012, Acceptable limit for iron (0.3 mg/L).
†JECFA provisional maximum tolerable daily intake for iron in water (WHO 1984, 2004).
‡Per litre equivalent of the Institute of Medicine (IOM) recommended tolerable upper intake level of 45 mg iron/day for daily iron
intake for adults (excluding iron supplements) assuming 2 L/day water consumption (Otten et al., 2006; WHO, 2006).
Iron conc. category Winter Summer Post-monsoon
n (%) Average n (%) Average n (%) Average
Minimal
0.0-<0.3* mg/L
16
(44.44%)
0.100 13
(36.11%)
0.222 23
(63.88%)
0.154
Elevated
0.3-2.0† mg/L
13
(36.11%)
0.980 20
(55.55%)
0.647 11
(30.55%)
0.880
High
>2.0-22.5‡
mg/L
6
(16.66%)
6.860 3
(8.33%)
3.485 2
(5.55%)
3.868
Very high
>22.5 mg/L
1
(2.77%)
47.100 -- -- -- --
82. Chronic daily intake and Hazard quotient
• Chronic daily intake (CDI) = C x DI/BW
where, C = Concentration of iron
DI = Daily intake of water in L (2 L/day)
BW = Body weight (72 kg) (Chrostowski, 1994
and USEPA, 1992).
• Hazard quotient (HQ) = CDI/RfD
RfD = Reference dose (Gerba, 2001 and USEPA,
1994)
• Hazard Indexmean = HQFe + HQMn
82
83. Chronic daily intake and Hazard quotient
83
Heavy metal Statistics (in mg/L) CDI, mg/kg-day HQ RfD,
mg/kg-daya
Season
Iron
Winter Min BDL, Max 47.100, Average 3.52 BDL, 1.308, 0.098 BDL, 1.869, 0.14
0.7
Summer Min 0.164, Max 3.825, Average 0.73 0.005, 0.106, 0.020 0.007, 0.151, 0.028
Post-
monsoon
Min 0.055, Max 4.022, Average 0.58 0.002, 0.112, 0.016 0.003, 0.160, 0.022
Manganese
Winter Min BDL, Max 1.853, Average 0.25 BDL, 0.051, 0.007 BDL, 0.364, 0.05
0.14
Summer Min 0.003, Max 0.474, Average 0.058 0.0001, 0.0131, 0.0016 0.0007, 0.0936, 0.0114
Post-
monsoon
Min 0.002, Max 0.761, Average 0.058 0.0001, 0.0211, 0.0013 0.0007, 0.1500, 0.0092
CDI - Chronic Daily Intake, HQ - Hazard Quotient, RfD - Reference dose
Min - Minimum, Max – Maximum, BDL- Below detection limit.
aRfD (USEPA, 2005)
84. Chronic daily intake and Hazard quotient
• CDI was below reference dose (RfD) of
respective metal.
• Health risk of ingestion of groundwater may
be negligible.
• The order of heavy metal toxicity Fe>Mn.
• Hazard Index <1.00, groundwater ingestion
confirmed as being safe.
• However, synergism effect of other metals
needs to be considered.
84
88. Pearson’s correlation coefficient water source characteristics (Winter)
88
Altitude Age Depth Iron Manganese
Altitude 1
Age 0.17196 1
Depth 0.07183 -0.1707 1
Iron -0.0496 -0.2125** -0.2009** 1
Manganese -0.0712 -0.1438 0.03149 0.08414 1
*Significant at 0.01 level; ** 0.05 level.
89. Pearson’s correlation coefficient water source characteristics (Summer)
89
*Significant at 0.01 level; ** 0.05 level.
Altitude Age Depth Iron Manganese
Altitude 1
Age 0.17196 1
Depth 0.07183 -0.1707 1
Iron -0.1388 -0.2129** 0.08912 1
Manganese -0.0092 -0.118 0.05821 0.24266** 1
90. Pearson’s correlation coefficient water source characteristics (Post-
monsoon)
90
*Significant at 0.01 level; ** 0.05 level.
Altitude Age Depth Iron Manganese
Altitude 1
Age 0.17196 1
Depth 0.07183 -0.1707 1
Iron -0.373* -0.2392** -0.0129 1
Manganese 0.3173* -0.2686* -0.033 0.04001 1
91. Principle Component Analysis (Winter)
91
Compo
nent
Initial Eigen value Extraction sums of
squared loading
Rotation sums of
squared loadings
Groun
dwater
charac
teristic
Component
matrixa
Rotated
component
matrix
PC1 PC2 PC1 PC2
Total
%Varia
nce
Cumula
tive %
Total
%Vari
ance
Cumul
ative
%
Total
%Varia
nce
Cumul
ative
%
1
2.432 48.637 48.637 2.432 48.637 48.637 1.935 38.706 38.706
Fe -.248 .776 -.263 .771
2
1.264 25.271 73.908 1.264 25.271 73.908 1.760 35.202 73.908
Mn .437 .473 .428 .481
3 .683 13.662 87.570 pH -.108 -.831 -.091 -.833
4 .578 11.553 99.123 TDS .947 -.117 .949 -.098
5 .044 .877 100.000 Cl- .974 .007 .974 .026
Extraction method: Principal Component Analysis. Rotation method: Varimax with Kaiser Normalisation. a Rotation converged in 3
iterations.
92. Principle Component Analysis (Summer)
92
Extraction method: Principal Component Analysis. Rotation method: Varimax with Kaiser Normalisation. a Rotation converged in 3
iterations.
Com
pone
nt
Initial Eigen value Extraction sums of
squared loadings
Rotation sums of
squared loadings
Groundwa
ter
characteri
stics
Component
matrixa
Rotated
component
matrix
Total
%Varia
nce
Cumula
tive %
Total
%Varia
nce
Cumul
ative %
Total
%Varia
nce
Cumula
tive %
PC1 PC2 PC1 PC2
1
2.050 40.997 40.997 2.050 40.997 40.997 2.000 40.007 40.007
Fe .172 -.829 -.095 .841
2
1.537 30.749 71.746 1.537 30.749 71.746 1.587 31.740 71.746
Mn .411 -.393 .268 .502
3
.851 17.011 88.757
pH -.256 .746 -.011 -.788
4
.522 10.440 99.196
TDS .934 .297 .980 .009
5
.040 .804 100.000
Cl- .956 .227 .979 .082
93. Principle Component Analysis (Post-monsoon)
93
Extraction method: Principal Component Analysis. Rotation method: Varimax with Kaiser Normalisation.
a Rotation converged in 3 iterations.
Compo
nent
Initial Eigen value Extraction sums of
squared loadings
Rotation sums of
squared loadings
Ground
water
charact
eristics
Component
matrixa
Rotated
component
matrix
Total
%Varian
ce
Cumulat
ive %
Total
%Vari
ance
Cumul
ative
%
Total
%Vari
ance
Cumul
ative
%
PC1 PC2 PC1 PC2
1
2.103 42.057 42.057 2.103 42.057 42.057 1.952 39.036 39.036
Fe -.497 .709 -.102 -.860
2
1.429 28.588 70.645 1.429 28.588 70.645 1.580 31.610 70.645
Mn .117 .313 .251 -.221
3
.962 19.233 89.878
pH .444 -.751 .036 .872
4
.454 9.075 98.953
TDS .931 .308 .966 .169
5
.052 1.047 100.000
Cl- .882 .411 .972 .055
94. One way ANOVA (Iron)
94
df - Degree of freedom, F - F test, Sig. - Significant.
Heavy metal Source of variations Sum of squares df Mean square F Sig.
Iron Between groups 114.638 2 57.319 2.501 0.087
Within groups 2406.085 105 22.915
Total 2520.72 107
95. One way ANOVA (Manganese)
95
df - Degree of freedom, F - F test, Sig. - Significant.
Heavy metal Source of variation Sum of squares df Mean square F Sig.
Manganese Between groups 0.485 2 0.243 4.595 0.012
Within groups 5.547 105 0.053
Total 6.032 107
113. Conclusions
1. Spatial and temporal unsymmetrical
distribution of Fe and Mn conc. was observed.
2. Elevated iron conc. were observed at selected
sampling locations (e.g. Ballarpur, HP).
3. Average Fe and Mn conc. had influence of
water source type (dug well/hand pump).
4. Hand pump samples had more Fe and Mn
conc. as compared with dug well samples.
5. Fe conc. above IS std. was
summer>winter>post-monsoon.
113
114. Conclusions (Cont…)
6. Groundwater pH (acidic) influences Fe and
Mn conc. (maximum concentration).
7. Depth wise distribution of Fe and Mn conc.
was observed.
8. Well structure (Shallow, deep and very deep)
had influence on Fe and Mn conc.
distribution.
9. Fe and Mn conc. above the acceptable limits
of IS 10500:2012 was observed which too
had influence of seasons on it.
114
115. Conclusions (Cont…)
10.Age, altitude and depth (in general) of water
source had no correlation (r) with Fe and Mn
conc.
11.Rainfall contributes in distribution of Fe and
Mn conc.
12.Higher (243-287 m asl) and lower (152-197
m asl) altitude had elevated Fe conc.
13.Altitude and rainfall together contribute to
distribution of Fe; however, Mn does not get
affected by these.
115
116. Conclusions (Cont…)
14.In some sampling locations Mn conc. was
more than Fe conc. (e.g. Naleshwar, HP).
15.Mn conc. above WHO previous standard (0.4
mg/L) was observed in natural aquatic
environment.
16.At a given time in a well probability of both
the metals above the acceptable limit of
IS10500:2012 can be possible.
17.TDS and Cl- had seasonal influence on Fe and
Mn conc.
116
117. Conclusions (Cont…)
18.No correlation (r) was observed between Fe
and Mn conc. in aquatic environment.
19.Inhabitants were under no immediate or
remote health threat from ingestion of this
groundwater.
20.Fe and Mn conc. were from geogenic in
origin.
21.Major contributors for Fe conc. can be
sandstone>granitic gneisses>alluvium and for
Mn, granitic gneisses>sandstone=limestone.
117
118. Future studies
1. An extended investigation for other heavy
metals.
2. Health effects of groundwater Mn on school
children needs to be ascertain.
3. Does this elevated groundwater Fe had
contribution to blood iron level in women.
4. Attempt should be carried out for presence of
groundwater arsenic from the study area.
5. Groundwater Fe and Mn combined removal
technology needs to be developed.
118
119. Contributions in subject domain
1. Groundwater source depth had influence on
Fe and Mn conc.
2. At some sampling locations Mn>Fe.
3. In a well probability of both the metals above
the acceptable limit of IS 10500:2012 can be
possible.
4. Age of water source had no influence on Fe
and Mn conc.
119
120. Contributions in subject domain (Cont…)
5. Groundwater pH had influence on Fe and Mn
conc.
6. TDS and Cl- had seasonal influence on Fe and
Mn conc.
7. In natural aquatic environment Mn conc. of
>0.4 mg/L was observed (previous WHO
standard).
120
121. Contribution in subject domain (Cont…)
8. Shallow and deep well had reported variable
concentrations within and above the acceptable
limit of IS 10500:2012.
9. Shallow well in winter season had maximum Fe
conc.; whereas, deep well in winter season had
maximum Mn conc.
10.Combined concentration of Fe and Mn above the
new ‘remark’ standard of IS 10500:2012 was
observed from number of sampling locations.
121
122. Implications
1. For setting up of future policies w.r.t.
construction of dug wells and installation of
hand-pumps and bore-wells.
2. Findings can be useful for local and district
authorities for identifying ‘threat areas’ and
considerably ‘safe areas’.
3. To arrange an appropriate alternative source
of drinking water so as to reduce exposure of
school students to groundwater manganese.
122
123. Implications (Cont…)
4. Remedial technologies for removal of
groundwater iron and manganese together.
5. The water source (hand pump/dug well) can
be painted with red colour (or any other
suitable colour) as a mark of indication.
6. Future human settlement and development by
Town Planning Department.
7. Due importance to be given by Public Health
Department.
123
124. Recommendations
1. Inhabitants should be made aware of the
presence of these heavy metals.
2. Special indication mark in the form of colour
coding (colour painting) should be carried out
so as to identify these water sources.
3. Cost effective, environment friendly and easy
to adopt iron and manganese removal
technology (together) needs to be developed.
124
125. Recommendations (Cont…)
4. Future planning for groundwater extraction
source identification needs to be carried out
by taking into consideration water source
depth (ft bgl) and water source type (dug
well/hand pump).
5. Geology of the area needs to be given due
attention for future development of
settlements and extraction of groundwater.
125
126. Limitations
1. Only two heavy metals were studied.
2. Health impacts especially on children was not
assessed.
3. Combined removal technology for iron and
manganese was not attempted.
126
127. Publications
1. Kamble, R.K. and Thakare, M.G. Spatial distribution of
groundwater iron and manganese in Chandrapur district,
Central India. Gurukul International Multidisciplinary
Research Journal, 2016, IV (VI): 182-192 (Impact Factor
2.254).
2. Kamble, R.K. and Thakare, M.G. Spatio-Temporal
distribution of groundwater iron in Chandrapur district,
Central India. Gurukul International Multidisciplinary
Research Journal, 2016, III (VI): 253-266 (Impact Factor
2.254).
3. Kamble, R.K. and Thakare, M.G. Spatial distribution of
groundwater manganese in Chandrapur district, Central
India. SPM Students Research Magazine, 2016, 5 (1): 7-39.
127
128. Publications (Cont…)
4. Kamble, R.K. and Thakare, M.G. Spatial distribution of
iron in groundwater of Chandrapur district, Central India.
SPM Students Research Magazine, 2015, 4 (1): 51-66.
5. Kamble, R.K. and Thakare, M.G. Status and role of
manganese in the environment. International Journal of
Environment, 2014, 3 (3): 222-234.
6. Kamble, R.K., Thakare, M.G., Iron in the environment.
Indian Journal of Environmental Protection, 2013, 33 (11),
881-888.
128
129. References (From this presentation)
Bacquart, T., Frisbie, S., Mitchell, E., Grigg, L., Cole, C., Small, C., & Sarkar, B. (2015). Multiple inorganic
toxic substances containing the groundwater of Myingyan township, Myanmar: Arsenic, manganese,
fluoride, iron and uranium. Science of the Total Environment, 517, 232-245.
Begum, S., Shah, M.T., Muhammad, S., & Khan, S. (2015). Role of mafic and ultramafic rocks in drinking
water quality and its potential health risk assessment, northern Pakistan. Journal of Water and Health,
13(4), 1130-1142.
Bresline, E. (2007). Sustainable water supply in developing countries. Geological Society of America. Paper No.
194-1.
Datta, P.S. (2008). Water-A key driving force. Noida: Vigyan Prasar.
Dwivedi, A.K., & Vankar, P.S. (2014). Source identification study of heavy metal contamination in the industrial
hub of Unnao, India. Environmental Monitoring and Assessment, 186, 3531-3539.
Harish Raju, M. (2014). Studies on ground water quality in Vrishabhavathi river basin. Unpublished Ph.D.
thesis, Kuvempu University.
Huang, B., Li, Z., Chen, Z., Chen, G., Zhang, C., Huang, J.,... Zeng, G. (2015). Study and health risk assessment
of the occurrence of iron and manganese in groundwater at the terminal of the Xiangjiang river.
Environmental Science Pollution Research International, 22(24), 19912-19921.
Joode, W., Barbeau, B., Bouchard, M.F., Mora, A.M., Skytt, A., Cordoba, L.,... Mergler, D. (2016). Manganese
concentration in drinking water from villages near banana plantation with aerial mancozeb spraying in
Costa Rica: Results from the Infants’ Environmental Health Study (ISA). Environmental Pollution, 215,
247-257.
Kovacevik, B., Boev, B., Panova, V.Z., & Mitrev, S. (2016). Groundwater quality in alluvial and prolluvial areas
under the influenced of irrigated agricultural activities. Journal of Environmental Science and Health. Part
A Toxic/Hazardous Substances & Environmental Engineering, 51(14), 1197-1204.
129
130. References (From this presentation) (Cont…)
Li, T., Li, L., Song, H., Meng, L., Zhang, S., & Huang, G. (2016). Evaluation of groundwater pollution in a
mining area using analytical solution: A case study of the Yimin open-pit mine in China. Springerplus, 5,
392.
MacDonald, A., Davies, J. Calow, R., & Chilton, J. (2005). Developing groundwater: A guide to rural water
supply. Rugby: Practical Action Publishing Ltd. pp. 358. http://dx.doi.org/10.3362/9781780441290
(Accessed July 12, 2015).
NAS. (2008). National Academy of Science: Overview-safe drinking water is essential. http://www.drinking-
water.org/html/en/overview/cost.html (Accessed December 15, 2014).
Palmucci, W., Rusi, S., & Di Curzio, D. (2016). Mobilisation process responsible for iron and manganese
concentration of groundwater in central Adriatic Italy. Environmental Science and Pollution Research
International, 23(12), 11790-11805.
Sankar, M.S., Vega, M.A., Defoe, P.P., Kibria, M.G., Ford, S., Telfeyan, K.,...Datta, S. (2014). Elevated arsenic
and manganese in groundwater of Murshidabad, West Bengal, India. Science of the Total Environment, 488-
489, 570-579.
Savita Kumari, Singh, A.K., Verma, A.K., & Yaduvanshi, N.P.S. (2014). Assessment and spatial distribution of
groundwater quality in industrial area of Ghaziabad, India. Environmental Monitoring and Assessment, 186,
501-514.
Siegel, D.I., Smith, B., Perry, E., Bothun, R., & Hollingsworth, M. (2015). Pre-drilling water quality data of
groundwater prior to Shale gas drilling in the Appalachian basin: Analysis of the Chesapeake Energy
Corporation dataset. Applied Geochemistry, 63, 37-57.
United Nations. (2000). Millennium Development Goals on Water. Retrieved from
http://www.un.org/millenniumgoals/ (Accessed January 12, 2016).
130
131. Acknowledgements
• Hon’ble Shri Shantaramji Potdukhe Sir
• Hon’ble Dr N V Kalyankar Sir
• Hon’ble Prof G Ramakrishna Naidu Sir
• Other Respected Referees (Madam/Sir)
• Hon’ble Dr V S Ainchwar Sir
• Late Dr J A Sheikh Sir
• Dr R P Ingole Sir
• Dr M G Thakare Sir
• Staff members of Ph.D. cell, GU, Gadchiroli
• Staff members of Sardar Patel College, Chandrapur
131
132. Thank you
• Mr Bhupen Burman
• Ms Kavita S Raipurkar Madam
• Mr Prafulkumar P Vaidhya
• Dr Swapnil K Gudadhe
• Ms Naznin
• Ms Priyanka
• Ms Pooja
• Ms Farin
132
133. My Family
• Dr Krishna M Kamble
• Late Mrs Leela K Kamble
• Mrs Pradnya R Kamble
• Mr Amit K Kamble
• Ms Shweta K Kamble
133