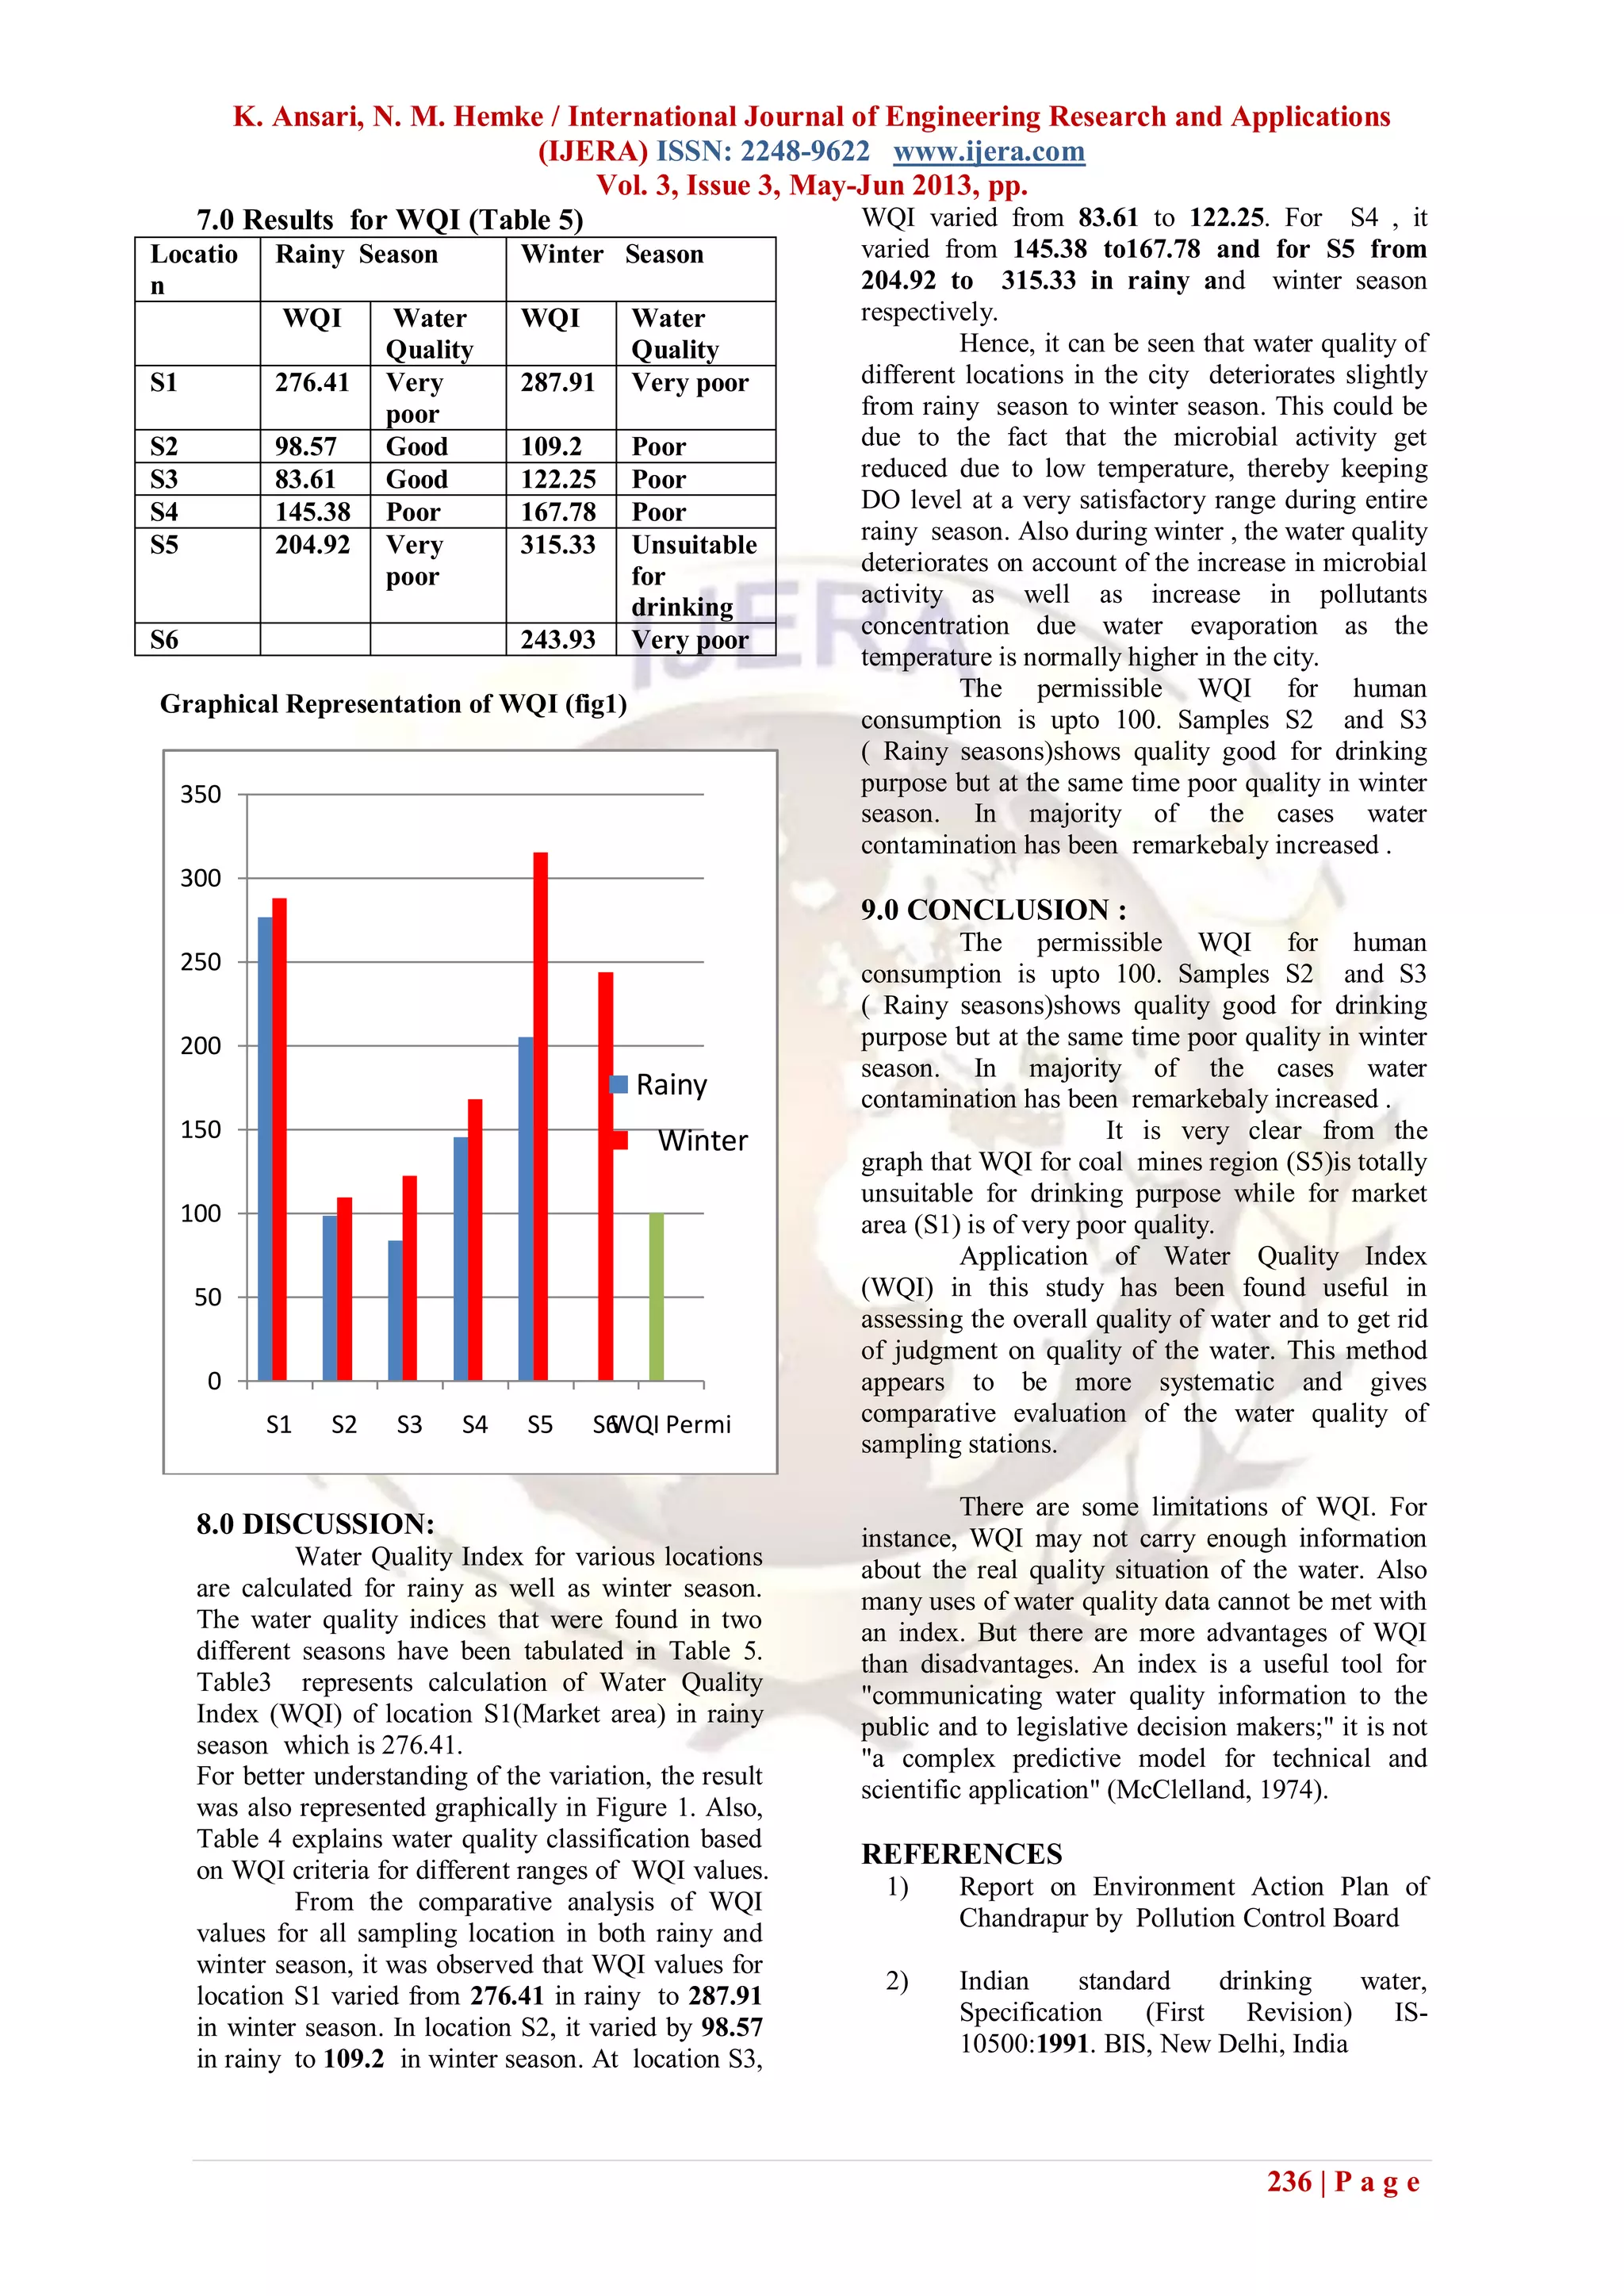
This document presents a study on assessing water quality in Chandrapur City, India using a Water Quality Index (WQI). Water samples were collected from 6 locations in the city during rainy and winter seasons. The samples were analyzed for 10 parameters and the WQI was calculated using a weighted arithmetic index method. The results found that most locations had WQI values indicating water quality from poor to unsuitable for drinking, and quality deteriorated from rainy to winter season due to increased microbial activity. The study demonstrated that WQI is useful for evaluating overall water quality and comparing different locations.
Unblocking The Main Thread Solving ANRs and Frozen Frames
An33233237
1. K. Ansari, N. M. Hemke / International Journal of Engineering Research and Applications
(IJERA) ISSN: 2248-9622 www.ijera.com
Vol. 3, Issue 3, May-Jun 2013, pp.233-237
233 | P a g e
Water Quality Index For Assessment Of Water Samples Of
Different Zones In Chandrapur City
K. Ansari 1
, N. M. Hemke2
1
Asst. Professor, Department of Civil Engineering, Yashwantrao Chavan College of Engineering, Nagpur
2
Research Scholar, Department of Civil Engineering, Yashwantrao Chavan College of Engineering, Nagpur
Abstract
The paper aims at determining the
suitability of ground water of different zones in
Chandrapur city with reference to index also
termed as Water Quality Index (WQI). The
objective of the index is to convert complex data
pertaining to water quality into the most
comprehensible and simple data that can be
understood by general public and policy makers
as a whole. The present work deals with
monitoring of variation of seasonal WQI of
selected locations of the city which is one of the
most polluted city in the country as far as water
and air pollutions are concerned. In the present
study, groundwater sample of rainy and winter
seasons of the selected different zones of the city
were taken for investigation and analysed for
various parameters with regard to drinking
water standards and assessed for their suitability
for human consumption.. After analysis it has
been observed that ground water quality of most
of the zones are not suitable for drinking water
and deteriorates from rainy to winter season due
to increase in microbial activity thereby
highlighting the major issue of drinking water
availability and measures to be adopted due to
growing industrialization and unhealthy human
activities.
Keywords: Ground water, Physico- Chemical
characteristics, Pollution, Water Quality Index
1.0 INTRODUCTION:
Ground water is one of the major resources
of the drinking water in Chandrapur city which is
one of the industrialized city of Maharashtra The
most potent threat to the quality of groundwater that
has emerged in our country is pollution. The main
source of pollution beneath the agricultural fields in
India is excessive use of fertilisers and pesticides,
which not only creep into plants and subsoil but in
groundwater as well. Another source is rapid
industrialization in and around the city which is the
index of modernization thereby leading to alteration
in the physical, chemical and biological properties
of ground water. The third source is due to
increased human activities (growing population)
giving rise to various water borne diseases causing
serious health problems.
In order to summarize water quality data in
understandable format , number of measures
(indices) have been devised. One such index is
Water Quality Index(WQI) which was first
mathematically developed by Horton as a means of
deriving a single value from numerous test
results .Similar to Ultra violet index or an air
quality index , it can inform us about the potential
threat to overall quality of water bodies. This index
also helps to compare the data between various
locations.
The different statistical methods were
followed for studying water quality data depending
on rank order of observations and factor analysis.
(Shoji et al; 1966, Harkin, 1974). In the past, WQI
method was adopted for evaluation of water quality
(Gupta et al, 2003 ;Avvannavar & Shrihari, 2007
A.Kumar & A.Dua,2009; V.S.Shrivastava et al;
2010).
2.0 PHYSIOGRAPHY:
Chandrapur is a mineral rich district with a
dense forest spread over 41.5 % of total land..
Physiographically, the district is situated in the
Wainganga and Wardha river basin. The city is
located in the eastern part of Maharashtra.It’s
geographical coordinates lies between 19.30’ N to
20.45’N Latitude and 78.46’E longitude.
2. K. Ansari, N. M. Hemke / International Journal of Engineering Research and Applications
(IJERA) ISSN: 2248-9622 www.ijera.com
Vol. 3, Issue 3, May-Jun 2013, pp.
234 | P a g e
3.0 GROUND WATER MONITORING
LOCATIONS (SAMPLING SITES) AND
THEIR SELECTION :
The sampling points are chosen to cover
the entire radius of 10 km of Chandrapur after
preliminary survey of the area, in order to get a
exact evaluation of water quality assessment in and
around Chandrapur city. The selection of sampling
sites are based on following criteria
Market area(S1) is the region where all activities
related to storage and selling of vegetables,
groceries, food products etc are carried out on daily
basis. It is the oldest part of the city and local people
consumes ground water as the drinking water
through hand pumps. Moreover due to open drain
system in this area, has led to the ground water
contamination and some parameters beyond
acceptable norms.
Residential area(S2) The Drinking water quality of
the Tukum area was analyzed for physico-chemical
parameters. As per IS –10500 sample exceeds limit
for chlorides concentration. Chlorination also needs
to be done prior to usage for drinking. The
Bacteriological analysis of groundwater samples
reveals that the water is not contaminated and can be
used for drinking purpose with proper treatment.
MIDC area (S3) is one of the area where there is
large concentration of various industries viz
chemical, sponge iron unit, Automobile
workshops,tiles industries etc. Based on available
minerals and abundant water, various industries
have been set up within and in the surrounding of
Chandrapur City. Some are within the municipal
limits and some in the various industrial zones in
MIDC areas.
Commercial area(S4) is the area where private
hospitals, restaurants, hotels, commercial complex
schools are set up which has open drainage system
and also lac improper sanitation.
Coal mines /Agri zone (S5) lies in the vicinity of
the town where mining activities are carried out and
this area also encompasses agricultural zone .The
ground water contamination is due to heavily
discharged mine water and Agricultural runoff and
improper agricultural practices.
Irai River(Datala Bridge) (S6)- The Irai river
flowing through the heart of the city is one of the
major source of water used for drinking mostly for
cattle , irrigation,agriculture and industrial purpose.
The water contamination is due to effluent discharge
from industries, fly ash disposal from power plant,
religious activities such as Idol immersion and other
rituals, bathing of cattles etc.
4.0 MATERIALS AND METHODS
4.1Sample Collection
Water samples were collected in pre-
cleaned sterilized polypropylene bottles with
necessary precaution from different sites. Samples
were collected in monsoon as well as winter seasons.
Various physico-chemical parameters are analysed
as given in standard manual of water and waste
water analysis .
The main aim of the study is to investigate
the physico-chemical characteristics of water
samples in Chandrapur city , because most of these
samples are located in the vicinity of the city.
Sample sites are described in Table 1.
Table1. Description of water sampling sites
4.2 Laboratory Analysis
The collected water samples analysed for ten
parameters in the lab as per standard procedures.
The pH was measured with pH meter.
Analysis of DO, alkalinity, chlorides, total
hardness, Dissolved Oxygen, B.O.D, turbidity,
MPN, fluoride, Iron were carried out in our
laboratory.
Reagents used for the present investigation as per
standards and double distilled water used for
preparing various solutions. All the reagents and
calorimetric solution were prepared and purified
according to standard method for the examination of
water .
Sampling
Code
Source Location
S1 Bore well Market area
S2 Bore well Residential area
S3 Bore well MIDC
S4 Bore well Commercial area
S5 Bore well Coal mines/Agri
zone
S6 Irai River Datala Bridge
S6
3. K. Ansari, N. M. Hemke / International Journal of Engineering Research and Applications
(IJERA) ISSN: 2248-9622 www.ijera.com
Vol. 3, Issue 3, May-Jun 2013, pp.233-237
235 | P a g e
5.0 PHYSICO-CHEMICAL ANALYSIS OF WATER SAMPLES :
Table 2 shows the values of various physico-chemical parameters for different locations.
Samples
Parameters
WHO/
BIS
S1 S2 S3 S4 S5 S6
R W R W R W R W R W R W
PH 6.5-8.5 7.0 7.5 6.9
5
7.5 6.9
6
7.5 7.0
4
7.6 7.01 7.2 7.0
Total Hardness(mg
/l)
500 268 540 144 292 160 576 284 224 240 30
0
212
Chlorides (mg/l) 200 40 275.9
1
25 55.9
8
28 93.9
7
65 155.9
5
66 50 97.66
Alkalinity (mg/l) 200 300 170 220 204 440 212 450 250 280 20
0
78
D.O. (mg/l) 4-6 4.2 8 6.0 6.5 8.0 8.2 6.8 8.2 7.0 7.8 9.0
B.O.D. (mg/l) 6 60 80 87 110 80 100 98 100 100 90 110
M.P.N.(per 100 ml) 10 900 920 7.2 16 20 17 180 210 430 92
0
540
Turbidity(NTU) 5-10 3.8 0.5 2.0 0.4 4.2 0.4 3.0 0.6 2.0 3.0 3.7
Fluoride(mg/l) 1.5 1.1 0.7 1.0 0.3 0.6 0.8 0.9 0.6 0.18 0.4 1.4
Iron (mg/l) 0.3 0.1 0.1 0.1
2
0.12 0.1 0.18 0.1
6
0.2 0.18 0.2 0.16
6.0 Determination of Water Quality
Index(WQI)
The Water Quality Index was calculated using
Weighted Arithmetic Index Method. Essentially a
WQI is a compilation of number of parameters that
can be used to determine the overall quality of a
water.
The mathematical relation used to calculate WQI
is given as-
WQI= Σ Q i Wi / ΣWi
Where Q i – Quality rating scale
Wi - Relative weight , Wi = 1/Si
Si- Std. permissible value
Q i = 100 [ (Vn-Vi) /(Vs- Vi) ]
Vn- actual or test value of the parameter
Vi- ideal value of the parameter
Vs- recommended WHO std of the
parameter
In this study, the WQI for human consumption is
considered and permissible WQI for drinking water
is taken as 100.
Sample Calculation for S1(Rainy Season) Table
3
S.No. Parameter Test
value
Si Qi Wi=1/Si QiWi
1 pH 7.0 7.0 0 0.143 0
2 Total
Hardness
268 500 53.6 0.002 0.1072
3 Chlorides 40 200 20 0.005 0.1
4 Alkalinity 300 200 150 0.005 0.75
5 D.O. 4.2 6.0 121 0.17 20.6
6 B.O.D 60 6.0 1000 0.17 170
7 MPN 900 10 9000 0.1 900
8 Turbidity 3.8 10 38 0.1 3.8
9 Fluoride 1.1 1.5 73.33 0.7 51.33
10 Iron 0.1 0.3 33.33 3.33 111
ΣWi=
4.55
ΣQ iW
i =
1257.68
WQI
=
276.41
Water Quality Classification (Table 4)
WQI Value Water Quality
Less than 50 Excellent
50 – 100 Good Water
100 – 200 Poor Water
200 – 300 Very Poor Water
Above 300 Water unsuitable for
drinking
4. K. Ansari, N. M. Hemke / International Journal of Engineering Research and Applications
(IJERA) ISSN: 2248-9622 www.ijera.com
Vol. 3, Issue 3, May-Jun 2013, pp.
236 | P a g e
7.0 Results for WQI (Table 5)
Locatio
n
Rainy Season Winter Season
WQI Water
Quality
WQI Water
Quality
S1 276.41 Very
poor
287.91 Very poor
S2 98.57 Good 109.2 Poor
S3 83.61 Good 122.25 Poor
S4 145.38 Poor 167.78 Poor
S5 204.92 Very
poor
315.33 Unsuitable
for
drinking
S6 243.93 Very poor
Graphical Representation of WQI (fig1)
8.0 DISCUSSION:
Water Quality Index for various locations
are calculated for rainy as well as winter season.
The water quality indices that were found in two
different seasons have been tabulated in Table 5.
Table3 represents calculation of Water Quality
Index (WQI) of location S1(Market area) in rainy
season which is 276.41.
For better understanding of the variation, the result
was also represented graphically in Figure 1. Also,
Table 4 explains water quality classification based
on WQI criteria for different ranges of WQI values.
From the comparative analysis of WQI
values for all sampling location in both rainy and
winter season, it was observed that WQI values for
location S1 varied from 276.41 in rainy to 287.91
in winter season. In location S2, it varied by 98.57
in rainy to 109.2 in winter season. At location S3,
WQI varied from 83.61 to 122.25. For S4 , it
varied from 145.38 to167.78 and for S5 from
204.92 to 315.33 in rainy and winter season
respectively.
Hence, it can be seen that water quality of
different locations in the city deteriorates slightly
from rainy season to winter season. This could be
due to the fact that the microbial activity get
reduced due to low temperature, thereby keeping
DO level at a very satisfactory range during entire
rainy season. Also during winter , the water quality
deteriorates on account of the increase in microbial
activity as well as increase in pollutants
concentration due water evaporation as the
temperature is normally higher in the city.
The permissible WQI for human
consumption is upto 100. Samples S2 and S3
( Rainy seasons)shows quality good for drinking
purpose but at the same time poor quality in winter
season. In majority of the cases water
contamination has been remarkebaly increased .
9.0 CONCLUSION :
The permissible WQI for human
consumption is upto 100. Samples S2 and S3
( Rainy seasons)shows quality good for drinking
purpose but at the same time poor quality in winter
season. In majority of the cases water
contamination has been remarkebaly increased .
It is very clear from the
graph that WQI for coal mines region (S5)is totally
unsuitable for drinking purpose while for market
area (S1) is of very poor quality.
Application of Water Quality Index
(WQI) in this study has been found useful in
assessing the overall quality of water and to get rid
of judgment on quality of the water. This method
appears to be more systematic and gives
comparative evaluation of the water quality of
sampling stations.
There are some limitations of WQI. For
instance, WQI may not carry enough information
about the real quality situation of the water. Also
many uses of water quality data cannot be met with
an index. But there are more advantages of WQI
than disadvantages. An index is a useful tool for
"communicating water quality information to the
public and to legislative decision makers;" it is not
"a complex predictive model for technical and
scientific application" (McClelland, 1974).
REFERENCES
1) Report on Environment Action Plan of
Chandrapur by Pollution Control Board
2) Indian standard drinking water,
Specification (First Revision) IS-
10500:1991. BIS, New Delhi, India
0
50
100
150
200
250
300
350
S1 S2 S3 S4 S5 S6WQI Permi
Rainy
Winter
5. K. Ansari, N. M. Hemke / International Journal of Engineering Research and Applications
(IJERA) ISSN: 2248-9622 www.ijera.com
Vol. 3, Issue 3, May-Jun 2013, pp.233-237
237 | P a g e
3) Assessment of of physico-chemical
quality of groundwater in rural area
nearby Sagar city (MP)- Mr. Hemant
Pathak and his team.
4) Evaluation of drinking water quality of
three seasons of Navsari district (Gujrat) -
Mr. Krishna Vaidya and his team.
5) Evaluation of various activities affecting
to the physico- chemical behavior of
Machna river, Betul - Mr. Neelesh
Shrivastava and his group
6) Environmental status report of
Chandrapur- Maharashta Pollution
Control Board- A major source of
inspiration to carry out the analysis
work.
7) Guidelines for Water Quality Monitoring-
Central Pollution Control Board, India
8) WHO’s Drinking Water Standards