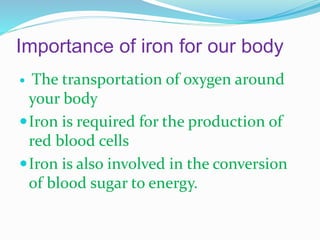
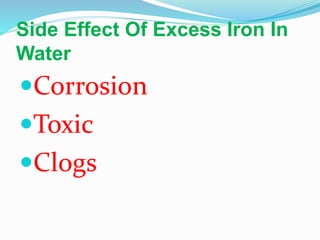
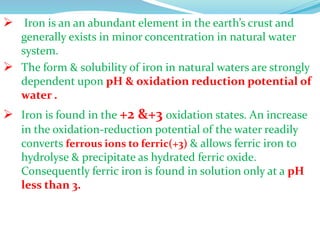
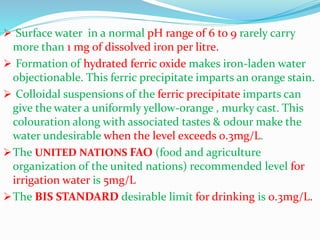
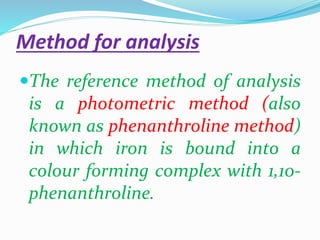
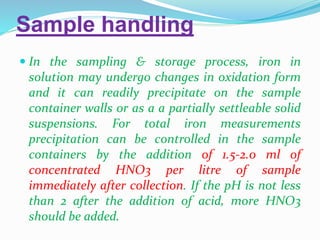
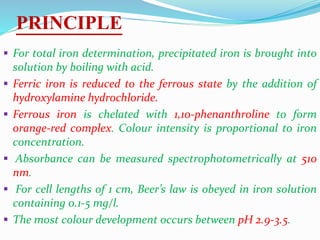
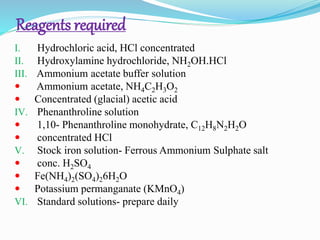
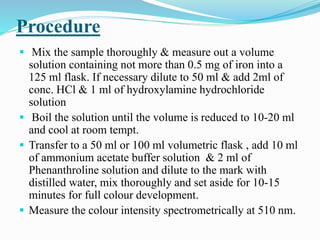
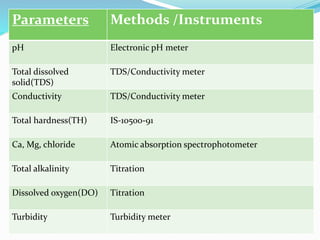
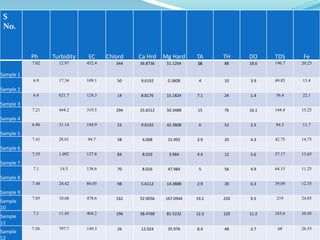
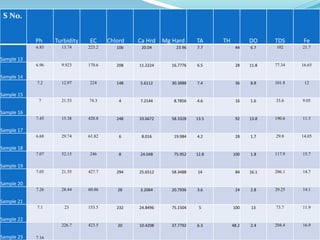
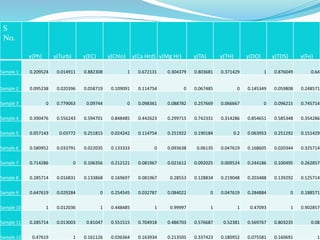
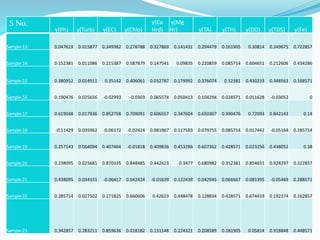
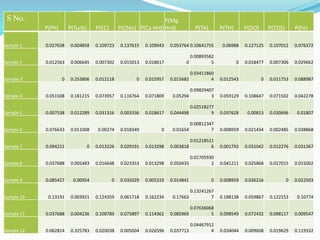
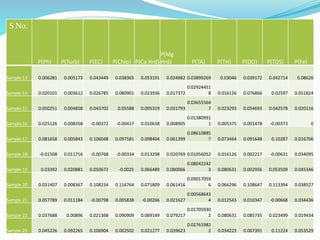
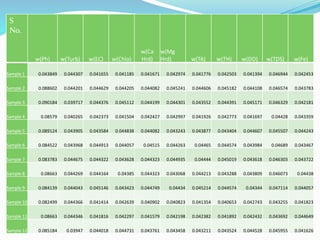
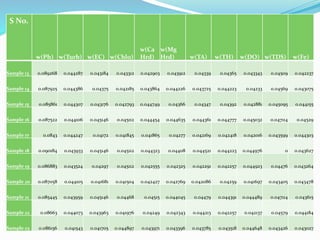
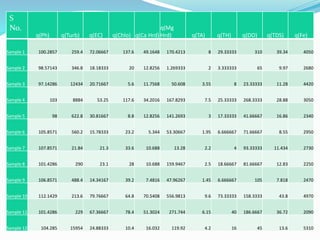
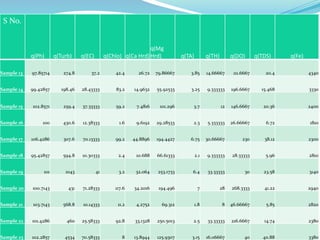
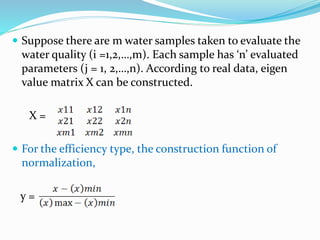
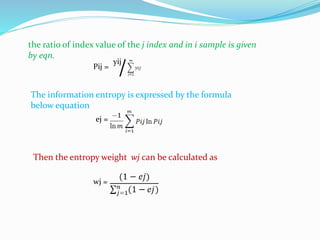
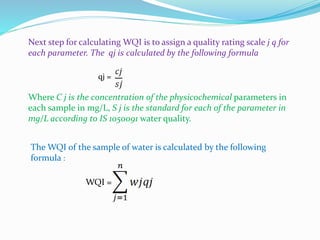
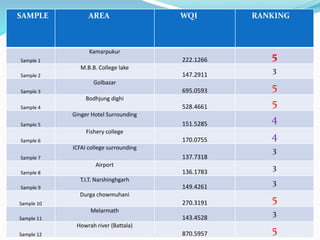
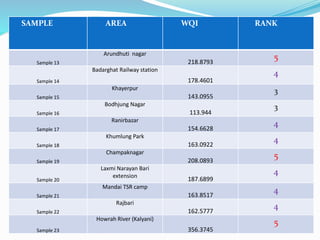
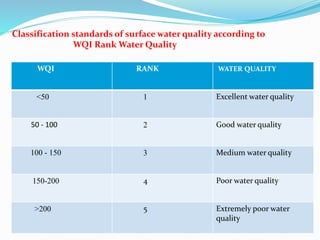
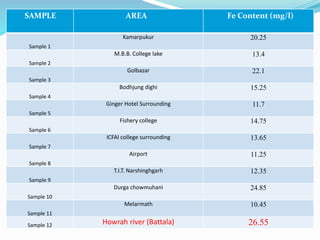
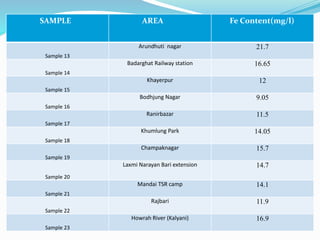
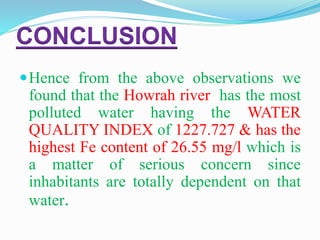
The quality of surface water depends primarily on geological
formation of a particular region .Tripura, situated in the
North eastern region of India, is industrially
underdeveloped. Other factors such as leachate from a
solid waste dumping sites dumping of industrial waste and
municipal solid waste etc. may have an effect on surface
water quality here. From health point of view it is therefore,
becomes imperative to regularly monitor the quality of
surface water and to device ways and means to protect it.
Surface water samples were collected from 23
locations . Samples were collected in pre cleaned
plastic polyethylene bottles for physicochemical
analysis of sample. Prior to sampling, all the
sampling containers were washed and rinsed
thoroughly with the distilled water for analysis. Each
of the surface water samples was analyzed for 10
parameters including pH, EC, turbidity, TDS, Fe, Ca,
Mg, K, Cu, Zn and total hardness (TH). Water quality
index is an important tool for checking the quality
of water, whether it is fit for drinking or not.
DETERMINATION
OF IRON BY UV
SPECTROSCOPY...
Importance of iron for our body
 The transportation of oxygen around
your body
Iron is required for the production of
red blood cells
Iron is also involved in the conversion
of blood sugar to energy.
Side Effect Of Excess Iron In
Water
Corrosion
Toxic
Clogs
 Iron is an an abundant element in the earth’s crust and
generally exists in minor concentration in natural water
system.
 The form & solubility of iron in natural waters are strongly
dependent upon pH & oxidation reduction potential of
water .
 Iron is found in the +2 &+3 oxidation states. An increase
in the oxidation-reduction potential of the water readily
converts ferrous ions to ferric(+3) & allows ferric iron to
hydrolyse & precipitate as hydrated ferric oxide.
Consequently ferric iron is found in solution only at a pH
less than 3.
 Surface water in a normal pH range of 6 to 9 rarely carry
more than 1 mg of dissolved iron per litre.
 Formation of hydrated ferric oxide makes iron-laden water
objectionable. This ferric precipitate imparts an orange stain.
 Colloidal suspensions of the ferric precipitate imparts can
give the water a uniformly yellow-orange , murky cast. This
colouration along with associated tastes & odour make the
water undesirable when the level exceeds 0.3mg/L.
The UNITED NATIONS FAO (food and agriculture
organization of the united nations) recommended level for
irrigation water is 5mg/L
The BIS STANDARD desirable limit for drinking is 0.3mg/L.
Method for analysis
The reference method of analysis
is a photometric method (also
known as phenanthroline method)
in which iron is bound into a
colour forming complex with 1,10-
phenanthroline.
Sample handling
 In the sampling & storage process, iron in
solution may undergo changes in oxidation form
and it can readily precipitate on the sample
container walls or as a a partially settleable solid
suspensions. For total iron measurements
precipitation can be controlled in the sample
containers by the addition of 1.5-2.0 ml of
concentrated HNO3 per litre of sample
immediately after collection. If the pH is not less
than 2 after the addition of acid, more HNO3
should be added.
PRINCIPLE
 For total iron determination, precipitated iron is brought into
solution by boiling with acid.
 Ferric iron is reduced to the ferrous state by the addition of
hydroxylamine hydrochloride.
 Ferrous iron is chelated with 1,10-phenanthroline to form
orange-red complex. Colour intensity is proportional to iron
concentration.
 Absorbance can be measured spectrophotometrically at 510
nm.
 For cell lengths of 1 cm, Beer’s law is obeyed in iron solution
containing 0.1-5 mg/l.
 The most colour development occurs between pH 2.9-3.5.
Reagents required
I. Hydrochloric acid, HCl concentrated
II. Hydroxylamine hydrochloride, NH2OH.HCl
III. Ammonium acetate buffer solution
 Ammonium acetate, NH4C2H3O2
 Concentrated (glacial) acetic acid
IV. Phenanthroline solution
 1,10- Phenanthroline monohydrate, C12H8N2H2O
 concentrated HCl
V. Stock iron solution- Ferrous Ammonium Sulphate salt
 conc. H2SO4
 Fe(NH4)2(SO4)26H2O
 Potassium permanganate (KMnO4)
VI. Standard solutions- prepare daily
Procedure
 Mix the sample thoroughly & measure out a volume
solution containing not more than 0.5 mg of iron into a
125 ml flask. If necessary dilute to 50 ml & add 2ml of
conc. HCl & 1 ml of hydroxylamine hydrochloride
solution
 Boil the solution until the volume is reduced to 10-20 ml
and cool at room tempt.
 Transfer to a 50 ml or 100 ml volumetric flask , add 10 ml
of ammonium acetate buffer solution & 2 ml of
Phenanthroline solution and dilute to the mark with
distilled water, mix thoroughly and set aside for 10-15
minutes for full colour development.
 Measure the colour intensity spectrometrically at 510 nm.
Methods for estimating
the physico-chemical
parameters...
Parameters Methods /Instruments
pH Electronic pH meter
Total dissolved
solid(TDS)
TDS/Conductivity meter
Conductivity TDS/Conductivity meter
Total hardness(TH) IS-10500-91
Ca, Mg, chloride Atomic absorption spectrophotometer
Total alkalinity Titration
Dissolved oxygen(DO) Titration
Turbidity Turbidity meter
Finding the Water
Quality Index using the
concept of
“Information Entropy”...
S
No.
Ph Turbidity EC Chlord Ca Hrd Mg Hard TA TH DO TDS Fe
Sample 1
7.02 12.97 432.4 344 36.8736 51.1264 16 88 18.6 196.7 20.25
Sample 2
6.9 17.34 109.1 50 9.6192 0.3808 4 10 3.9 49.85 13.4
Sample 3
6.8 621.7 124.3 14 8.8176 15.1824 7.1 24 1.4 56.4 22.1
Sample 4
7.21 444.2 319.5 294 25.6512 50.3488 15 76 16.1 144.4 15.25
Sample 5
6.86 31.14 184.9 22 9.6192 42.3808 6 52 2.5 84.3 11.7
Sample 6
7.41 28.01 94.7 58 4.008 15.992 3.9 20 4.3 42.75 14.75
Sample 7
7.55 1.092 127.8 84 8.016 3.984 4.4 12 5.6 57.17 13.65
Sample 8
7.1 14.5 138.6 70 8.016 47.984 5 56 4.9 64.15 11.25
Sample 9
7.48 24.42 86.05 98 5.6112 14.3888 2.9 20 6.3 39.09 12.35
Sample
10
7.85 10.68 478.6 162 52.9056 167.0944 19.2 220 9.5 219 24.85
Sample
11
7.1 11.45 404.2 196 38.4768 81.5232 12.3 120 11.2 183.6 10.45
Sample
12
7.30. 797.7 149.3 26 12.024 35.976 8.4 48 2.7 68 26.55
S No.
Ph Turbidity EC Chlord Ca Hrd Mg Hard TA TH DO TDS Fe
Sample 13
6.85 13.74 223.2 106 20.04 23.96 7.7 44 6.7 102 21.7
Sample 14
6.96 9.923 170.6 208 11.2224 16.7776 6.5 28 11.8 77.34 16.65
Sample 15
7.2 12.97 224 148 5.6112 30.3888 7.4 36 8.8 101.8 12
Sample 16
7 21.53 74.3 4 7.2144 8.7856 4.6 16 1.6 33.6 9.05
Sample 17
7.45 15.38 420.8 248 33.6672 58.3328 13.5 92 13.8 190.6 11.5
Sample 18
6.68 29.74 61.82 6 8.016 19.984 4.2 28 1.7 29.8 14.05
Sample 19
7.07 52.15 246 8 24.048 75.952 12.8 100 1.8 117.9 15.7
Sample 20
7.05 21.55 427.7 294 25.6512 58.3488 14 84 16.1 206.1 14.7
Sample 21
7.26 28.44 60.86 28 3.2064 20.7936 3.6 24 2.8 29.25 14.1
Sample 22
7.1 23 153.5 232 24.8496 75.1504 5 100 13 73.7 11.9
Sample 23 7.16
226.7 423.5 20 10.4208 37.7792 6.3 48.2 2.4 204.4 16.9
S
No.
y(Ph) y(Turb) y(EC) y(Chlo) y(Ca Hrd) y(Mg Hr) y(TA) y(TH) y(DO) y(TDS) y(Fe)
Sample 1 0.209524 0.014911 0.882308 1 0.672131 0.304379 0.803681 0.371429 1 0.876049 0.64
Sample 2 0.095238 0.020396 0.058719 0.109091 0.114754 0 0.067485 0 0.145349 0.059808 0.248571
Sample 3 0 0.779063 0.09744 0 0.098361 0.088782 0.257669 0.066667 0 0.096215 0.745714
Sample 4 0.390476 0.556243 0.594701 0.848485 0.442623 0.299715 0.742331 0.314286 0.854651 0.585348 0.354286
Sample 5 0.057143 0.03772 0.251815 0.024242 0.114754 0.251922 0.190184 0.2 0.063953 0.251292 0.151429
Sample 6 0.580952 0.033791 0.022035 0.133333 0 0.093638 0.06135 0.047619 0.168605 0.020344 0.325714
Sample 7 0.714286 0 0.106356 0.212121 0.081967 0.021612 0.092025 0.009524 0.244186 0.100495 0.262857
Sample 8 0.285714 0.016831 0.133868 0.169697 0.081967 0.28553 0.128834 0.219048 0.203488 0.139292 0.125714
Sample 9 0.647619 0.029284 0 0.254545 0.032787 0.084022 0 0.047619 0.284884 0 0.188571
Sample 10 1 0.012036 1 0.448485 1 0.99997 1 1 0.47093 1 0.902857
Sample 11 0.285714 0.013003 0.81047 0.551515 0.704918 0.486703 0.576687 0.52381 0.569767 0.803235 0.08
Sample 12 0.47619 1 0.161126 0.036364 0.163934 0.213505 0.337423 0.180952 0.075581 0.160691 1
S No.
y(Ph) y(Turb) y(EC) y(Chlo)
y(Ca
Hrd)
y(Mg
Hr) y(TA) y(TH) y(DO) y(TDS) y(Fe)
Sample 13 0.047619 0.015877 0.349382 0.278788 0.327869 0.141431 0.294479 0.161905 0.30814 0.349675 0.722857
Sample 14 0.152381 0.011086 0.215387 0.587879 0.147541 0.09835 0.220859 0.085714 0.604651 0.212606 0.434286
Sample 15 0.380952 0.014911 0.35142 0.406061 0.032787 0.179992 0.276074 0.12381 0.430233 0.348563 0.168571
Sample 16 0.190476 0.025656 -0.02993 -0.0303 0.065574 0.050413 0.104294 0.028571 0.011628 -0.03052 0
Sample 17 0.619048 0.017936 0.852758 0.709091 0.606557 0.347604 0.650307 0.390476 0.72093 0.842143 0.14
Sample 18 -0.11429 0.035962 -0.06172 -0.02424 0.081967 0.117583 0.079755 0.085714 0.017442 -0.05164 0.285714
Sample 19 0.257143 0.064094 0.407464 -0.01818 0.409836 0.453286 0.607362 0.428571 0.023256 0.438052 0.38
Sample 20 0.238095 0.025681 0.870335 0.848485 0.442623 0.3477 0.680982 0.352381 0.854651 0.928297 0.322857
Sample 21 0.438095 0.034331 -0.06417 0.042424 -0.01639 0.122439 0.042945 0.066667 0.081395 -0.05469 0.288571
Sample 22 0.285714 0.027502 0.171825 0.660606 0.42623 0.448478 0.128834 0.428571 0.674419 0.192374 0.162857
Sample 23 0.342857 0.283211 0.859636 0.018182 0.131148 0.224321 0.208589 0.181905 0.05814 0.918848 0.448571
S No.
P(Ph) P(Turb) P(EC) P(Chlo) P(Ca Hrd)
P(Mg
Hrd) P(TA) P(TH) P(DO) P(TDS) P(Fe)
Sample 1 0.027638 0.004858 0.109723 0.137615 0.109043 0.053764 0.10641755 0.06988 0.127125 0.107012 0.076372
Sample 2 0.012563 0.006645 0.007302 0.015013 0.018617 0
0.00893582
5 0 0.018477 0.007306 0.029662
Sample 3 0 0.253806 0.012118 0 0.015957 0.015682
0.03411860
4 0.012543 0 0.011753 0.088987
Sample 4 0.051508 0.181215 0.073957 0.116764 0.071809 0.05294
0.09829407
3 0.059129 0.108647 0.071502 0.042278
Sample 5 0.007538 0.012289 0.031316 0.003336 0.018617 0.044498
0.02518277
9 0.037628 0.00813 0.030696 0.01807
Sample 6 0.076633 0.011008 0.00274 0.018349 0 0.01654
0.00812347
7 0.008959 0.021434 0.002485 0.038868
Sample 7 0.094221 0 0.013226 0.029191 0.013298 0.003818
0.01218521
6 0.001792 0.031042 0.012276 0.031367
Sample 8 0.037688 0.005483 0.016648 0.023353 0.013298 0.050435
0.01705930
2 0.041211 0.025868 0.017015 0.015002
Sample 9 0.085427 0.00954 0 0.035029 0.005319 0.014841 0 0.008959 0.036216 0 0.022503
Sample 10 0.13191 0.003921 0.124359 0.061718 0.162234 0.17663
0.13241267
7 0.188138 0.059867 0.122153 0.10774
Sample 11 0.037688 0.004236 0.100789 0.075897 0.114362 0.085969
0.07636068
5 0.098549 0.072432 0.098117 0.009547
Sample 12 0.062814 0.325783 0.020038 0.005004 0.026596 0.037713
0.04467912
4 0.034044 0.009608 0.019629 0.119332
S No.
P(Ph) P(Turb) P(EC) P(Chlo) P(Ca Hrd)
P(Mg
Hrd) P(TA) P(TH) P(DO) P(TDS) P(Fe)
Sample 13 0.006281 0.005173 0.043449 0.038365 0.053191 0.024982 0.03899269 0.03046 0.039172 0.042714 0.08626
Sample 14 0.020101 0.003612 0.026785 0.080901 0.023936 0.017372
0.02924451
8 0.016126 0.076866 0.02597 0.051824
Sample 15 0.050251 0.004858 0.043702 0.05588 0.005319 0.031793
0.03655564
7 0.023293 0.054693 0.042578 0.020116
Sample 16 0.025126 0.008358 -0.00372 -0.00417 0.010638 0.008905
0.01380991
1 0.005375 0.001478 -0.00373 0
Sample 17 0.081658 0.005843 0.106048 0.097581 0.098404 0.061399
0.08610885
7 0.073464 0.091648 0.10287 0.016706
Sample 18 -0.01508 0.011716 -0.00768 -0.00334 0.013298 0.020769 0.01056052 0.016126 0.002217 -0.00631 0.034095
Sample 19 0.03392 0.020881 0.050672 -0.0025 0.066489 0.080066
0.08042242
3 0.080631 0.002956 0.053509 0.045346
Sample 20 0.031407 0.008367 0.108234 0.116764 0.071809 0.061416
0.09017059
6 0.066296 0.108647 0.113394 0.038527
Sample 21 0.057789 0.011184 -0.00798 0.005838 -0.00266 0.021627
0.00568643
4 0.012543 0.010347 -0.00668 0.034436
Sample 22 0.037688 0.00896 0.021368 0.090909 0.069149 0.079217
0.01705930
2 0.080631 0.085735 0.023499 0.019434
Sample 23 0.045226 0.092265 0.106904 0.002502 0.021277 0.039623
0.02761982
2 0.034223 0.007391 0.11224 0.053529
S
No.
w(Ph) w(Turb) w(EC) w(Chlo)
w(Ca
Hrd)
w(Mg
Hrd) w(TA) w(TH) w(DO) w(TDS) w(Fe)
Sample 1 0.043849 0.044307 0.041655 0.041185 0.041671 0.042974 0.041776 0.042503 0.041394 0.046944 0.042453
Sample 2 0.088602 0.044201 0.044629 0.044205 0.044082 0.045241 0.044606 0.045182 0.044108 0.046574 0.043783
Sample 3 0.090184 0.039717 0.044376 0.045112 0.044199 0.044301 0.043552 0.044391 0.045171 0.046329 0.042181
Sample 4 0.08579 0.040265 0.042373 0.041504 0.042427 0.042997 0.041926 0.042773 0.041697 0.04428 0.043359
Sample 5 0.089124 0.043905 0.043584 0.044838 0.044082 0.043243 0.043877 0.043404 0.044607 0.045507 0.044243
Sample 6 0.084522 0.043968 0.044913 0.044057 0.04515 0.044263 0.04465 0.044574 0.043984 0.04689 0.043467
Sample 7 0.083783 0.044675 0.044322 0.043628 0.044323 0.044935 0.04444 0.045019 0.043618 0.046303 0.043722
Sample 8 0.08663 0.044269 0.044164 0.04385 0.044323 0.043068 0.044213 0.043288 0.043809 0.046073 0.04438
Sample 9 0.084139 0.044043 0.045146 0.043423 0.044749 0.04434 0.045214 0.044574 0.04344 0.047114 0.044057
Sample 10 0.082499 0.044366 0.041414 0.042639 0.040902 0.040823 0.041354 0.040653 0.042743 0.043255 0.041823
Sample 11 0.08663 0.044346 0.041816 0.042297 0.041579 0.042198 0.042382 0.041892 0.042432 0.043692 0.044649
Sample 12 0.085184 0.03947 0.044018 0.044731 0.043761 0.043458 0.043211 0.043524 0.044528 0.045955 0.041626
S No.
w(Ph) w(Turb) w(EC) w(Chlo)
w(Ca
Hrd)
w(Mg
Hrd) w(TA) w(TH) w(DO) w(TDS) w(Fe)
Sample 13 0.089268 0.044287 0.043184 0.043312 0.042903 0.043912 0.04339 0.04365 0.043343 0.04509 0.042237
Sample 14 0.087925 0.044386 0.04375 0.042185 0.043864 0.044226 0.043725 0.044223 0.04233 0.04569 0.043075
Sample 15 0.085861 0.044307 0.043176 0.042793 0.044749 0.04366 0.04347 0.04392 0.042881 0.045095 0.044155
Sample 16 0.087522 0.044106 0.045146 0.045112 0.044454 0.044635 0.044361 0.044777 0.045032 0.047114 0.04529
Sample 17 0.0843 0.044247 0.04172 0.041845 0.041865 0.04277 0.042169 0.042418 0.042016 0.043599 0.044303
Sample 18 0.090184 0.043933 0.045146 0.045112 0.044323 0.04408 0.044521 0.044223 0.044976 0 0.043627
Sample 19 0.086883 0.043524 0.04297 0.045112 0.042555 0.042325 0.042291 0.042257 0.044923 0.04476 0.043264
Sample 20 0.087058 0.044105 0.041681 0.041504 0.042427 0.042769 0.042086 0.04259 0.041697 0.043405 0.043478
Sample 21 0.085445 0.043959 0.045146 0.04468 0.04515 0.044045 0.04479 0.044391 0.044489 0.047114 0.043615
Sample 22 0.08663 0.044073 0.043963 0.041976 0.04249 0.042343 0.044213 0.042257 0.042137 0.04579 0.044184
Sample 23 0.086156 0.041543 0.041705 0.044897 0.043971 0.043396 0.043785 0.043518 0.044648 0.043426 0.043027
S
No.
q(Ph) q(Turb) q(EC) q(Chlo) q(Ca Hrd)
q(Mg
Hrd) q(TA) q(TH) q(DO) q(TDS) q(Fe)
Sample 1 100.2857 259.4 72.06667 137.6 49.1648 170.4213 8 29.33333 310 39.34 4050
Sample 2 98.57143 346.8 18.18333 20 12.8256 1.269333 2 3.333333 65 9.97 2680
Sample 3 97.14286 12434 20.71667 5.6 11.7568 50.608 3.55 8 23.33333 11.28 4420
Sample 4 103 8884 53.25 117.6 34.2016 167.8293 7.5 25.33333 268.3333 28.88 3050
Sample 5 98 622.8 30.81667 8.8 12.8256 141.2693 3 17.33333 41.66667 16.86 2340
Sample 6 105.8571 560.2 15.78333 23.2 5.344 53.30667 1.95 6.666667 71.66667 8.55 2950
Sample 7 107.8571 21.84 21.3 33.6 10.688 13.28 2.2 4 93.33333 11.434 2730
Sample 8 101.4286 290 23.1 28 10.688 159.9467 2.5 18.66667 81.66667 12.83 2250
Sample 9 106.8571 488.4 14.34167 39.2 7.4816 47.96267 1.45 6.666667 105 7.818 2470
Sample 10 112.1429 213.6 79.76667 64.8 70.5408 556.9813 9.6 73.33333 158.3333 43.8 4970
Sample 11 101.4286 229 67.36667 78.4 51.3024 271.744 6.15 40 186.6667 36.72 2090
Sample 12 104.285 15954 24.88333 10.4 16.032 119.92 4.2 16 45 13.6 5310
S No.
q(Ph) q(Turb) q(EC) q(Chlo) q(Ca Hrd)
q(Mg
Hrd) q(TA) q(TH) q(DO) q(TDS) q(Fe)
Sample 13 97.85714 274.8 37.2 42.4 26.72 79.86667 3.85 14.66667 111.6667 20.4 4340
Sample 14 99.42857 198.46 28.43333 83.2 14.9632 55.92533 3.25 9.333333 196.6667 15.468 3330
Sample 15 102.8571 259.4 37.33333 59.2 7.4816 101.296 3.7 12 146.6667 20.36 2400
Sample 16 100 430.6 12.38333 1.6 9.6192 29.28533 2.3 5.333333 26.66667 6.72 1810
Sample 17 106.4286 307.6 70.13333 99.2 44.8896 194.4427 6.75 30.66667 230 38.12 2300
Sample 18 95.42857 594.8 10.30333 2.4 10.688 66.61333 2.1 9.333333 28.33333 5.96 2810
Sample 19 101 1043 41 3.2 32.064 253.1733 6.4 33.33333 30 23.58 3140
Sample 20 100.7143 431 71.28333 117.6 34.2016 194.496 7 28 268.3333 41.22 2940
Sample 21 103.7143 568.8 10.14333 11.2 4.2752 69.312 1.8 8 46.66667 5.85 2820
Sample 22 101.4286 460 25.58333 92.8 33.1328 250.5013 2.5 33.33333 216.6667 14.74 2380
Sample 23 102.2857 4534 70.58333 8 13.8944 125.9307 3.15 16.06667 40 40.88 3380
Formulas used for
calculating the Water
Quality Index by
“INFORMATION
ENTROPY CONCEPT”...
 Suppose there are m water samples taken to evaluate the
water quality (i =1,2,…,m). Each sample has ‘n’ evaluated
parameters (j = 1, 2,…,n). According to real data, eigen
value matrix X can be constructed.
X =
 For the efficiency type, the construction function of
normalization,
y =
the ratio of index value of the j index and in i sample is given
by eqn.
Pij =
yij
/
The information entropy is expressed by the formula
below equation
ej =
Then the entropy weight wj can be calculated as
wj =
Next step for calculating WQI is to assign a quality rating scale j q for
each parameter. The qj is calculated by the following formula
qj =
Where C j is the concentration of the physicochemical parameters in
each sample in mg/L, S j is the standard for each of the parameter in
mg/L according to IS 1050091 water quality.
The WQI of the sample of water is calculated by the following
formula :
WQI =
Assessment of
water quality
index and its
ranking...
SAMPLE AREA WQI RANKING
Sample 1
Kamarpukur
222.1266 5
Sample 2
M.B.B. College lake
147.2911
3
Sample 3
Golbazar
695.0593 5
Sample 4
Bodhjung dighi
528.4661 5
Sample 5
Ginger Hotel Surrounding
151.5285
4
Sample 6
Fishery college
170.0755 4
Sample 7
ICFAI college surrounding
137.7318
3
Sample 8
Airport
136.1783
3
Sample 9
T.I.T. Narshinghgarh
149.4261
3
Sample 10
Durga chowmuhani
270.3191 5
Sample 11
Melarmath
143.4528
3
Sample 12
Howrah river (Battala)
870.5957 5
SAMPLE AREA WQI RANK
Sample 13
Arundhuti nagar
218.8793
5
Sample 14
Badarghat Railway station
178.4601
4
Sample 15
Khayerpur
143.0955
3
Sample 16
Bodhjung Nagar
113.944
3
Sample 17
Ranirbazar
154.6628
4
Sample 18
Khumlung Park
163.0922
4
Sample 19
Champaknagar
208.0893
5
Sample 20
Laxmi Narayan Bari
extension
187.6899
4
Sample 21
Mandai TSR camp
163.8517
4
Sample 22
Rajbari
162.5777
4
Sample 23
Howrah River (Kalyani)
356.3745
5
Classification standards of surface water quality according to
WQI Rank Water Quality
WQI RANK WATER QUALITY
<50 1 Excellent water quality
50 - 100 2 Good water quality
100 - 150 3 Medium water quality
150-200 4 Poor water quality
>200 5 Extremely poor water
quality
Fe content
present in
samples...
SAMPLE AREA Fe Content (mg/l)
Sample 1
Kamarpukur 20.25
Sample 2
M.B.B. College lake 13.4
Sample 3
Golbazar 22.1
Sample 4
Bodhjung dighi 15.25
Sample 5
Ginger Hotel Surrounding 11.7
Sample 6
Fishery college 14.75
Sample 7
ICFAI college surrounding 13.65
Sample 8
Airport 11.25
Sample 9
T.I.T. Narshinghgarh 12.35
Sample 10
Durga chowmuhani 24.85
Sample 11
Melarmath 10.45
Sample 12 Howrah river (Battala) 26.55
SAMPLE AREA Fe Content(mg/l)
Sample 13
Arundhuti nagar 21.7
Sample 14
Badarghat Railway station 16.65
Sample 15
Khayerpur 12
Sample 16
Bodhjung Nagar 9.05
Sample 17
Ranirbazar 11.5
Sample 18
Khumlung Park 14.05
Sample 19
Champaknagar 15.7
Sample 20
Laxmi Narayan Bari extension 14.7
Sample 21
Mandai TSR camp 14.1
Sample 22
Rajbari 11.9
Sample 23
Howrah River (Kalyani) 16.9
Methods for
removal of iron...
.
Water Softener
Aeration
Oxidizing Filter
Chemical Oxidation
CONCLUSION
Hence from the above observations we
found that the Howrah river has the most
polluted water having the WATER
QUALITY INDEX of 1227.727 & has the
highest Fe content of 26.55 mg/l which is
a matter of serious concern since
inhabitants are totally dependent on that
water.
Thank you...
Samadrita Lodh
Biprojit Roy
Shalini Singh
Praveen Kumar

Water Quality Index

  • 2.
    The quality ofsurface water depends primarily on geological formation of a particular region .Tripura, situated in the North eastern region of India, is industrially underdeveloped. Other factors such as leachate from a solid waste dumping sites dumping of industrial waste and municipal solid waste etc. may have an effect on surface water quality here. From health point of view it is therefore, becomes imperative to regularly monitor the quality of surface water and to device ways and means to protect it.
  • 3.
    Surface water sampleswere collected from 23 locations . Samples were collected in pre cleaned plastic polyethylene bottles for physicochemical analysis of sample. Prior to sampling, all the sampling containers were washed and rinsed thoroughly with the distilled water for analysis. Each of the surface water samples was analyzed for 10 parameters including pH, EC, turbidity, TDS, Fe, Ca, Mg, K, Cu, Zn and total hardness (TH). Water quality index is an important tool for checking the quality of water, whether it is fit for drinking or not.
  • 4.
    DETERMINATION OF IRON BYUV SPECTROSCOPY...
  • 5.
    Importance of ironfor our body  The transportation of oxygen around your body Iron is required for the production of red blood cells Iron is also involved in the conversion of blood sugar to energy.
  • 6.
    Side Effect OfExcess Iron In Water Corrosion Toxic Clogs
  • 7.
     Iron isan an abundant element in the earth’s crust and generally exists in minor concentration in natural water system.  The form & solubility of iron in natural waters are strongly dependent upon pH & oxidation reduction potential of water .  Iron is found in the +2 &+3 oxidation states. An increase in the oxidation-reduction potential of the water readily converts ferrous ions to ferric(+3) & allows ferric iron to hydrolyse & precipitate as hydrated ferric oxide. Consequently ferric iron is found in solution only at a pH less than 3.
  • 8.
     Surface waterin a normal pH range of 6 to 9 rarely carry more than 1 mg of dissolved iron per litre.  Formation of hydrated ferric oxide makes iron-laden water objectionable. This ferric precipitate imparts an orange stain.  Colloidal suspensions of the ferric precipitate imparts can give the water a uniformly yellow-orange , murky cast. This colouration along with associated tastes & odour make the water undesirable when the level exceeds 0.3mg/L. The UNITED NATIONS FAO (food and agriculture organization of the united nations) recommended level for irrigation water is 5mg/L The BIS STANDARD desirable limit for drinking is 0.3mg/L.
  • 9.
    Method for analysis Thereference method of analysis is a photometric method (also known as phenanthroline method) in which iron is bound into a colour forming complex with 1,10- phenanthroline.
  • 10.
    Sample handling  Inthe sampling & storage process, iron in solution may undergo changes in oxidation form and it can readily precipitate on the sample container walls or as a a partially settleable solid suspensions. For total iron measurements precipitation can be controlled in the sample containers by the addition of 1.5-2.0 ml of concentrated HNO3 per litre of sample immediately after collection. If the pH is not less than 2 after the addition of acid, more HNO3 should be added.
  • 11.
    PRINCIPLE  For totaliron determination, precipitated iron is brought into solution by boiling with acid.  Ferric iron is reduced to the ferrous state by the addition of hydroxylamine hydrochloride.  Ferrous iron is chelated with 1,10-phenanthroline to form orange-red complex. Colour intensity is proportional to iron concentration.  Absorbance can be measured spectrophotometrically at 510 nm.  For cell lengths of 1 cm, Beer’s law is obeyed in iron solution containing 0.1-5 mg/l.  The most colour development occurs between pH 2.9-3.5.
  • 12.
    Reagents required I. Hydrochloricacid, HCl concentrated II. Hydroxylamine hydrochloride, NH2OH.HCl III. Ammonium acetate buffer solution  Ammonium acetate, NH4C2H3O2  Concentrated (glacial) acetic acid IV. Phenanthroline solution  1,10- Phenanthroline monohydrate, C12H8N2H2O  concentrated HCl V. Stock iron solution- Ferrous Ammonium Sulphate salt  conc. H2SO4  Fe(NH4)2(SO4)26H2O  Potassium permanganate (KMnO4) VI. Standard solutions- prepare daily
  • 13.
    Procedure  Mix thesample thoroughly & measure out a volume solution containing not more than 0.5 mg of iron into a 125 ml flask. If necessary dilute to 50 ml & add 2ml of conc. HCl & 1 ml of hydroxylamine hydrochloride solution  Boil the solution until the volume is reduced to 10-20 ml and cool at room tempt.  Transfer to a 50 ml or 100 ml volumetric flask , add 10 ml of ammonium acetate buffer solution & 2 ml of Phenanthroline solution and dilute to the mark with distilled water, mix thoroughly and set aside for 10-15 minutes for full colour development.  Measure the colour intensity spectrometrically at 510 nm.
  • 14.
    Methods for estimating thephysico-chemical parameters...
  • 15.
    Parameters Methods /Instruments pHElectronic pH meter Total dissolved solid(TDS) TDS/Conductivity meter Conductivity TDS/Conductivity meter Total hardness(TH) IS-10500-91 Ca, Mg, chloride Atomic absorption spectrophotometer Total alkalinity Titration Dissolved oxygen(DO) Titration Turbidity Turbidity meter
  • 16.
    Finding the Water QualityIndex using the concept of “Information Entropy”...
  • 17.
    S No. Ph Turbidity ECChlord Ca Hrd Mg Hard TA TH DO TDS Fe Sample 1 7.02 12.97 432.4 344 36.8736 51.1264 16 88 18.6 196.7 20.25 Sample 2 6.9 17.34 109.1 50 9.6192 0.3808 4 10 3.9 49.85 13.4 Sample 3 6.8 621.7 124.3 14 8.8176 15.1824 7.1 24 1.4 56.4 22.1 Sample 4 7.21 444.2 319.5 294 25.6512 50.3488 15 76 16.1 144.4 15.25 Sample 5 6.86 31.14 184.9 22 9.6192 42.3808 6 52 2.5 84.3 11.7 Sample 6 7.41 28.01 94.7 58 4.008 15.992 3.9 20 4.3 42.75 14.75 Sample 7 7.55 1.092 127.8 84 8.016 3.984 4.4 12 5.6 57.17 13.65 Sample 8 7.1 14.5 138.6 70 8.016 47.984 5 56 4.9 64.15 11.25 Sample 9 7.48 24.42 86.05 98 5.6112 14.3888 2.9 20 6.3 39.09 12.35 Sample 10 7.85 10.68 478.6 162 52.9056 167.0944 19.2 220 9.5 219 24.85 Sample 11 7.1 11.45 404.2 196 38.4768 81.5232 12.3 120 11.2 183.6 10.45 Sample 12 7.30. 797.7 149.3 26 12.024 35.976 8.4 48 2.7 68 26.55
  • 18.
    S No. Ph TurbidityEC Chlord Ca Hrd Mg Hard TA TH DO TDS Fe Sample 13 6.85 13.74 223.2 106 20.04 23.96 7.7 44 6.7 102 21.7 Sample 14 6.96 9.923 170.6 208 11.2224 16.7776 6.5 28 11.8 77.34 16.65 Sample 15 7.2 12.97 224 148 5.6112 30.3888 7.4 36 8.8 101.8 12 Sample 16 7 21.53 74.3 4 7.2144 8.7856 4.6 16 1.6 33.6 9.05 Sample 17 7.45 15.38 420.8 248 33.6672 58.3328 13.5 92 13.8 190.6 11.5 Sample 18 6.68 29.74 61.82 6 8.016 19.984 4.2 28 1.7 29.8 14.05 Sample 19 7.07 52.15 246 8 24.048 75.952 12.8 100 1.8 117.9 15.7 Sample 20 7.05 21.55 427.7 294 25.6512 58.3488 14 84 16.1 206.1 14.7 Sample 21 7.26 28.44 60.86 28 3.2064 20.7936 3.6 24 2.8 29.25 14.1 Sample 22 7.1 23 153.5 232 24.8496 75.1504 5 100 13 73.7 11.9 Sample 23 7.16 226.7 423.5 20 10.4208 37.7792 6.3 48.2 2.4 204.4 16.9
  • 19.
    S No. y(Ph) y(Turb) y(EC)y(Chlo) y(Ca Hrd) y(Mg Hr) y(TA) y(TH) y(DO) y(TDS) y(Fe) Sample 1 0.209524 0.014911 0.882308 1 0.672131 0.304379 0.803681 0.371429 1 0.876049 0.64 Sample 2 0.095238 0.020396 0.058719 0.109091 0.114754 0 0.067485 0 0.145349 0.059808 0.248571 Sample 3 0 0.779063 0.09744 0 0.098361 0.088782 0.257669 0.066667 0 0.096215 0.745714 Sample 4 0.390476 0.556243 0.594701 0.848485 0.442623 0.299715 0.742331 0.314286 0.854651 0.585348 0.354286 Sample 5 0.057143 0.03772 0.251815 0.024242 0.114754 0.251922 0.190184 0.2 0.063953 0.251292 0.151429 Sample 6 0.580952 0.033791 0.022035 0.133333 0 0.093638 0.06135 0.047619 0.168605 0.020344 0.325714 Sample 7 0.714286 0 0.106356 0.212121 0.081967 0.021612 0.092025 0.009524 0.244186 0.100495 0.262857 Sample 8 0.285714 0.016831 0.133868 0.169697 0.081967 0.28553 0.128834 0.219048 0.203488 0.139292 0.125714 Sample 9 0.647619 0.029284 0 0.254545 0.032787 0.084022 0 0.047619 0.284884 0 0.188571 Sample 10 1 0.012036 1 0.448485 1 0.99997 1 1 0.47093 1 0.902857 Sample 11 0.285714 0.013003 0.81047 0.551515 0.704918 0.486703 0.576687 0.52381 0.569767 0.803235 0.08 Sample 12 0.47619 1 0.161126 0.036364 0.163934 0.213505 0.337423 0.180952 0.075581 0.160691 1
  • 20.
    S No. y(Ph) y(Turb)y(EC) y(Chlo) y(Ca Hrd) y(Mg Hr) y(TA) y(TH) y(DO) y(TDS) y(Fe) Sample 13 0.047619 0.015877 0.349382 0.278788 0.327869 0.141431 0.294479 0.161905 0.30814 0.349675 0.722857 Sample 14 0.152381 0.011086 0.215387 0.587879 0.147541 0.09835 0.220859 0.085714 0.604651 0.212606 0.434286 Sample 15 0.380952 0.014911 0.35142 0.406061 0.032787 0.179992 0.276074 0.12381 0.430233 0.348563 0.168571 Sample 16 0.190476 0.025656 -0.02993 -0.0303 0.065574 0.050413 0.104294 0.028571 0.011628 -0.03052 0 Sample 17 0.619048 0.017936 0.852758 0.709091 0.606557 0.347604 0.650307 0.390476 0.72093 0.842143 0.14 Sample 18 -0.11429 0.035962 -0.06172 -0.02424 0.081967 0.117583 0.079755 0.085714 0.017442 -0.05164 0.285714 Sample 19 0.257143 0.064094 0.407464 -0.01818 0.409836 0.453286 0.607362 0.428571 0.023256 0.438052 0.38 Sample 20 0.238095 0.025681 0.870335 0.848485 0.442623 0.3477 0.680982 0.352381 0.854651 0.928297 0.322857 Sample 21 0.438095 0.034331 -0.06417 0.042424 -0.01639 0.122439 0.042945 0.066667 0.081395 -0.05469 0.288571 Sample 22 0.285714 0.027502 0.171825 0.660606 0.42623 0.448478 0.128834 0.428571 0.674419 0.192374 0.162857 Sample 23 0.342857 0.283211 0.859636 0.018182 0.131148 0.224321 0.208589 0.181905 0.05814 0.918848 0.448571
  • 21.
    S No. P(Ph) P(Turb)P(EC) P(Chlo) P(Ca Hrd) P(Mg Hrd) P(TA) P(TH) P(DO) P(TDS) P(Fe) Sample 1 0.027638 0.004858 0.109723 0.137615 0.109043 0.053764 0.10641755 0.06988 0.127125 0.107012 0.076372 Sample 2 0.012563 0.006645 0.007302 0.015013 0.018617 0 0.00893582 5 0 0.018477 0.007306 0.029662 Sample 3 0 0.253806 0.012118 0 0.015957 0.015682 0.03411860 4 0.012543 0 0.011753 0.088987 Sample 4 0.051508 0.181215 0.073957 0.116764 0.071809 0.05294 0.09829407 3 0.059129 0.108647 0.071502 0.042278 Sample 5 0.007538 0.012289 0.031316 0.003336 0.018617 0.044498 0.02518277 9 0.037628 0.00813 0.030696 0.01807 Sample 6 0.076633 0.011008 0.00274 0.018349 0 0.01654 0.00812347 7 0.008959 0.021434 0.002485 0.038868 Sample 7 0.094221 0 0.013226 0.029191 0.013298 0.003818 0.01218521 6 0.001792 0.031042 0.012276 0.031367 Sample 8 0.037688 0.005483 0.016648 0.023353 0.013298 0.050435 0.01705930 2 0.041211 0.025868 0.017015 0.015002 Sample 9 0.085427 0.00954 0 0.035029 0.005319 0.014841 0 0.008959 0.036216 0 0.022503 Sample 10 0.13191 0.003921 0.124359 0.061718 0.162234 0.17663 0.13241267 7 0.188138 0.059867 0.122153 0.10774 Sample 11 0.037688 0.004236 0.100789 0.075897 0.114362 0.085969 0.07636068 5 0.098549 0.072432 0.098117 0.009547 Sample 12 0.062814 0.325783 0.020038 0.005004 0.026596 0.037713 0.04467912 4 0.034044 0.009608 0.019629 0.119332
  • 22.
    S No. P(Ph) P(Turb)P(EC) P(Chlo) P(Ca Hrd) P(Mg Hrd) P(TA) P(TH) P(DO) P(TDS) P(Fe) Sample 13 0.006281 0.005173 0.043449 0.038365 0.053191 0.024982 0.03899269 0.03046 0.039172 0.042714 0.08626 Sample 14 0.020101 0.003612 0.026785 0.080901 0.023936 0.017372 0.02924451 8 0.016126 0.076866 0.02597 0.051824 Sample 15 0.050251 0.004858 0.043702 0.05588 0.005319 0.031793 0.03655564 7 0.023293 0.054693 0.042578 0.020116 Sample 16 0.025126 0.008358 -0.00372 -0.00417 0.010638 0.008905 0.01380991 1 0.005375 0.001478 -0.00373 0 Sample 17 0.081658 0.005843 0.106048 0.097581 0.098404 0.061399 0.08610885 7 0.073464 0.091648 0.10287 0.016706 Sample 18 -0.01508 0.011716 -0.00768 -0.00334 0.013298 0.020769 0.01056052 0.016126 0.002217 -0.00631 0.034095 Sample 19 0.03392 0.020881 0.050672 -0.0025 0.066489 0.080066 0.08042242 3 0.080631 0.002956 0.053509 0.045346 Sample 20 0.031407 0.008367 0.108234 0.116764 0.071809 0.061416 0.09017059 6 0.066296 0.108647 0.113394 0.038527 Sample 21 0.057789 0.011184 -0.00798 0.005838 -0.00266 0.021627 0.00568643 4 0.012543 0.010347 -0.00668 0.034436 Sample 22 0.037688 0.00896 0.021368 0.090909 0.069149 0.079217 0.01705930 2 0.080631 0.085735 0.023499 0.019434 Sample 23 0.045226 0.092265 0.106904 0.002502 0.021277 0.039623 0.02761982 2 0.034223 0.007391 0.11224 0.053529
  • 23.
    S No. w(Ph) w(Turb) w(EC)w(Chlo) w(Ca Hrd) w(Mg Hrd) w(TA) w(TH) w(DO) w(TDS) w(Fe) Sample 1 0.043849 0.044307 0.041655 0.041185 0.041671 0.042974 0.041776 0.042503 0.041394 0.046944 0.042453 Sample 2 0.088602 0.044201 0.044629 0.044205 0.044082 0.045241 0.044606 0.045182 0.044108 0.046574 0.043783 Sample 3 0.090184 0.039717 0.044376 0.045112 0.044199 0.044301 0.043552 0.044391 0.045171 0.046329 0.042181 Sample 4 0.08579 0.040265 0.042373 0.041504 0.042427 0.042997 0.041926 0.042773 0.041697 0.04428 0.043359 Sample 5 0.089124 0.043905 0.043584 0.044838 0.044082 0.043243 0.043877 0.043404 0.044607 0.045507 0.044243 Sample 6 0.084522 0.043968 0.044913 0.044057 0.04515 0.044263 0.04465 0.044574 0.043984 0.04689 0.043467 Sample 7 0.083783 0.044675 0.044322 0.043628 0.044323 0.044935 0.04444 0.045019 0.043618 0.046303 0.043722 Sample 8 0.08663 0.044269 0.044164 0.04385 0.044323 0.043068 0.044213 0.043288 0.043809 0.046073 0.04438 Sample 9 0.084139 0.044043 0.045146 0.043423 0.044749 0.04434 0.045214 0.044574 0.04344 0.047114 0.044057 Sample 10 0.082499 0.044366 0.041414 0.042639 0.040902 0.040823 0.041354 0.040653 0.042743 0.043255 0.041823 Sample 11 0.08663 0.044346 0.041816 0.042297 0.041579 0.042198 0.042382 0.041892 0.042432 0.043692 0.044649 Sample 12 0.085184 0.03947 0.044018 0.044731 0.043761 0.043458 0.043211 0.043524 0.044528 0.045955 0.041626
  • 24.
    S No. w(Ph) w(Turb)w(EC) w(Chlo) w(Ca Hrd) w(Mg Hrd) w(TA) w(TH) w(DO) w(TDS) w(Fe) Sample 13 0.089268 0.044287 0.043184 0.043312 0.042903 0.043912 0.04339 0.04365 0.043343 0.04509 0.042237 Sample 14 0.087925 0.044386 0.04375 0.042185 0.043864 0.044226 0.043725 0.044223 0.04233 0.04569 0.043075 Sample 15 0.085861 0.044307 0.043176 0.042793 0.044749 0.04366 0.04347 0.04392 0.042881 0.045095 0.044155 Sample 16 0.087522 0.044106 0.045146 0.045112 0.044454 0.044635 0.044361 0.044777 0.045032 0.047114 0.04529 Sample 17 0.0843 0.044247 0.04172 0.041845 0.041865 0.04277 0.042169 0.042418 0.042016 0.043599 0.044303 Sample 18 0.090184 0.043933 0.045146 0.045112 0.044323 0.04408 0.044521 0.044223 0.044976 0 0.043627 Sample 19 0.086883 0.043524 0.04297 0.045112 0.042555 0.042325 0.042291 0.042257 0.044923 0.04476 0.043264 Sample 20 0.087058 0.044105 0.041681 0.041504 0.042427 0.042769 0.042086 0.04259 0.041697 0.043405 0.043478 Sample 21 0.085445 0.043959 0.045146 0.04468 0.04515 0.044045 0.04479 0.044391 0.044489 0.047114 0.043615 Sample 22 0.08663 0.044073 0.043963 0.041976 0.04249 0.042343 0.044213 0.042257 0.042137 0.04579 0.044184 Sample 23 0.086156 0.041543 0.041705 0.044897 0.043971 0.043396 0.043785 0.043518 0.044648 0.043426 0.043027
  • 25.
    S No. q(Ph) q(Turb) q(EC)q(Chlo) q(Ca Hrd) q(Mg Hrd) q(TA) q(TH) q(DO) q(TDS) q(Fe) Sample 1 100.2857 259.4 72.06667 137.6 49.1648 170.4213 8 29.33333 310 39.34 4050 Sample 2 98.57143 346.8 18.18333 20 12.8256 1.269333 2 3.333333 65 9.97 2680 Sample 3 97.14286 12434 20.71667 5.6 11.7568 50.608 3.55 8 23.33333 11.28 4420 Sample 4 103 8884 53.25 117.6 34.2016 167.8293 7.5 25.33333 268.3333 28.88 3050 Sample 5 98 622.8 30.81667 8.8 12.8256 141.2693 3 17.33333 41.66667 16.86 2340 Sample 6 105.8571 560.2 15.78333 23.2 5.344 53.30667 1.95 6.666667 71.66667 8.55 2950 Sample 7 107.8571 21.84 21.3 33.6 10.688 13.28 2.2 4 93.33333 11.434 2730 Sample 8 101.4286 290 23.1 28 10.688 159.9467 2.5 18.66667 81.66667 12.83 2250 Sample 9 106.8571 488.4 14.34167 39.2 7.4816 47.96267 1.45 6.666667 105 7.818 2470 Sample 10 112.1429 213.6 79.76667 64.8 70.5408 556.9813 9.6 73.33333 158.3333 43.8 4970 Sample 11 101.4286 229 67.36667 78.4 51.3024 271.744 6.15 40 186.6667 36.72 2090 Sample 12 104.285 15954 24.88333 10.4 16.032 119.92 4.2 16 45 13.6 5310
  • 26.
    S No. q(Ph) q(Turb)q(EC) q(Chlo) q(Ca Hrd) q(Mg Hrd) q(TA) q(TH) q(DO) q(TDS) q(Fe) Sample 13 97.85714 274.8 37.2 42.4 26.72 79.86667 3.85 14.66667 111.6667 20.4 4340 Sample 14 99.42857 198.46 28.43333 83.2 14.9632 55.92533 3.25 9.333333 196.6667 15.468 3330 Sample 15 102.8571 259.4 37.33333 59.2 7.4816 101.296 3.7 12 146.6667 20.36 2400 Sample 16 100 430.6 12.38333 1.6 9.6192 29.28533 2.3 5.333333 26.66667 6.72 1810 Sample 17 106.4286 307.6 70.13333 99.2 44.8896 194.4427 6.75 30.66667 230 38.12 2300 Sample 18 95.42857 594.8 10.30333 2.4 10.688 66.61333 2.1 9.333333 28.33333 5.96 2810 Sample 19 101 1043 41 3.2 32.064 253.1733 6.4 33.33333 30 23.58 3140 Sample 20 100.7143 431 71.28333 117.6 34.2016 194.496 7 28 268.3333 41.22 2940 Sample 21 103.7143 568.8 10.14333 11.2 4.2752 69.312 1.8 8 46.66667 5.85 2820 Sample 22 101.4286 460 25.58333 92.8 33.1328 250.5013 2.5 33.33333 216.6667 14.74 2380 Sample 23 102.2857 4534 70.58333 8 13.8944 125.9307 3.15 16.06667 40 40.88 3380
  • 27.
    Formulas used for calculatingthe Water Quality Index by “INFORMATION ENTROPY CONCEPT”...
  • 28.
     Suppose thereare m water samples taken to evaluate the water quality (i =1,2,…,m). Each sample has ‘n’ evaluated parameters (j = 1, 2,…,n). According to real data, eigen value matrix X can be constructed. X =  For the efficiency type, the construction function of normalization, y =
  • 29.
    the ratio ofindex value of the j index and in i sample is given by eqn. Pij = yij / The information entropy is expressed by the formula below equation ej = Then the entropy weight wj can be calculated as wj =
  • 30.
    Next step forcalculating WQI is to assign a quality rating scale j q for each parameter. The qj is calculated by the following formula qj = Where C j is the concentration of the physicochemical parameters in each sample in mg/L, S j is the standard for each of the parameter in mg/L according to IS 1050091 water quality. The WQI of the sample of water is calculated by the following formula : WQI =
  • 31.
  • 32.
    SAMPLE AREA WQIRANKING Sample 1 Kamarpukur 222.1266 5 Sample 2 M.B.B. College lake 147.2911 3 Sample 3 Golbazar 695.0593 5 Sample 4 Bodhjung dighi 528.4661 5 Sample 5 Ginger Hotel Surrounding 151.5285 4 Sample 6 Fishery college 170.0755 4 Sample 7 ICFAI college surrounding 137.7318 3 Sample 8 Airport 136.1783 3 Sample 9 T.I.T. Narshinghgarh 149.4261 3 Sample 10 Durga chowmuhani 270.3191 5 Sample 11 Melarmath 143.4528 3 Sample 12 Howrah river (Battala) 870.5957 5
  • 33.
    SAMPLE AREA WQIRANK Sample 13 Arundhuti nagar 218.8793 5 Sample 14 Badarghat Railway station 178.4601 4 Sample 15 Khayerpur 143.0955 3 Sample 16 Bodhjung Nagar 113.944 3 Sample 17 Ranirbazar 154.6628 4 Sample 18 Khumlung Park 163.0922 4 Sample 19 Champaknagar 208.0893 5 Sample 20 Laxmi Narayan Bari extension 187.6899 4 Sample 21 Mandai TSR camp 163.8517 4 Sample 22 Rajbari 162.5777 4 Sample 23 Howrah River (Kalyani) 356.3745 5
  • 34.
    Classification standards ofsurface water quality according to WQI Rank Water Quality WQI RANK WATER QUALITY <50 1 Excellent water quality 50 - 100 2 Good water quality 100 - 150 3 Medium water quality 150-200 4 Poor water quality >200 5 Extremely poor water quality
  • 35.
  • 36.
    SAMPLE AREA FeContent (mg/l) Sample 1 Kamarpukur 20.25 Sample 2 M.B.B. College lake 13.4 Sample 3 Golbazar 22.1 Sample 4 Bodhjung dighi 15.25 Sample 5 Ginger Hotel Surrounding 11.7 Sample 6 Fishery college 14.75 Sample 7 ICFAI college surrounding 13.65 Sample 8 Airport 11.25 Sample 9 T.I.T. Narshinghgarh 12.35 Sample 10 Durga chowmuhani 24.85 Sample 11 Melarmath 10.45 Sample 12 Howrah river (Battala) 26.55
  • 37.
    SAMPLE AREA FeContent(mg/l) Sample 13 Arundhuti nagar 21.7 Sample 14 Badarghat Railway station 16.65 Sample 15 Khayerpur 12 Sample 16 Bodhjung Nagar 9.05 Sample 17 Ranirbazar 11.5 Sample 18 Khumlung Park 14.05 Sample 19 Champaknagar 15.7 Sample 20 Laxmi Narayan Bari extension 14.7 Sample 21 Mandai TSR camp 14.1 Sample 22 Rajbari 11.9 Sample 23 Howrah River (Kalyani) 16.9
  • 38.
  • 39.
  • 40.
    CONCLUSION Hence from theabove observations we found that the Howrah river has the most polluted water having the WATER QUALITY INDEX of 1227.727 & has the highest Fe content of 26.55 mg/l which is a matter of serious concern since inhabitants are totally dependent on that water.
  • 41.
    Thank you... Samadrita Lodh BiprojitRoy Shalini Singh Praveen Kumar